A Decades Old Strategy
June 2016 Client Letter
The Sell in May and Go Away investment strategy is a perennial favorite of the financial press. Each spring I read at least one article that opines on the Sell in May strategy. Some articles are pro-sell while others oppose the approach.
A Decades Old Strategy
The Sell in May and Go Away strategy has been around for decades and is one of the easiest investment strategies to follow. In the most popular form, you literally make two trades a year—one to buy stocks in November and one to sell stocks in May. That’s it. No need for a fancy computer or deep knowledge of markets to execute this strategy. If you can read a calendar, you can execute the strategy.
How does the Sell in May strategy perform in the real world? Is it sound advice or just a catchy adage? The first academic study on the Sell in May and Go Away strategy was published in 2002 by Sven Bouman and Ben Jacobsen and titled “The Halloween Indicator, ‘Sell in May and Go Away’: Another Puzzle.” They studied 37 markets and found that, in 35 of the markets, the November to April period had higher returns than the May to October period. In 20 of the 37 markets, the returns were significantly higher.
This does not mean the Sell in May strategy still works. Oftentimes when an academic paper is published identifying a successful investment strategy, investors pile into the strategy and drive away the excess profits. Fortunately, in the case of the Sell in May strategy, Andrade et al. published a follow-up study (and revision) in July 2012 and March 2013 issues of Financial Analysts Journal titled, “‘Sell in May and Go Away’ Just Won’t Go Away.” What did this study find?
The authors performed an out-of-sample test of the sell-in-May effect documented in previous research. Reducing equity exposure starting in May and levering it up starting in November persists as a profitable market-timing strategy. On average, stock returns are about 10 percentage points higher for November-April half-year periods than for May-October half-year periods. The authors also found that the sell-in-May effect is pervasive in financial markets.
The Historical Record Seems Clear
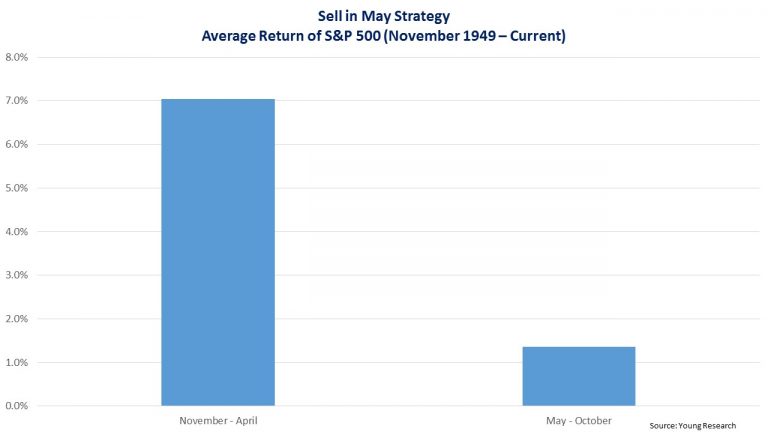
The historical record seems to be clear and backed by rigorous academic research. Returns for the November to April period have been higher than the returns for the May to October period. Our chart below shows that since November of 1949, the average six-month return on the S&P 500 in the November to April period is 7% compared to 1.4% for the May to October period.
So on paper there is no denying that the Sell in May strategy has worked. But how confident should we be that it is sound investment advice? To answer this question we must determine why the strategy has worked, why it will continue to work, whether or not it works across styles and sectors, and what happens to the strategy after taxes are factored in. This is where things start to fall apart.
Historical data shows the Sell in May strategy was a success, but there is no accepted explanation for its strong performance. And if there is little to explain the outperformance in the November to April period, what basis do we have for expecting the strategy to perform well in the future? Are we really supposed to risk our life-savings following a strategy we don’t fully understand and can’t explain?
There Are Problems
Even for those who don’t have reservations about blindly following an investment strategy, there are problems with the Sell in May strategy. For example, at Richard C. Young & Co., Ltd., we craft stock portfolios of only dividend-paying companies favoring defensive sectors in the market. Does the Sell in May strategy work as well for defensive sectors as for the broader market? And what about for dividend-paying shares?
Let’s look at the performance of the Sell in May strategy over a period when it was successful for the broader market. From November 1999 through May 2016 an investor who pursued the strategy using the S&P 500 Index would have earned more than a buy-and-hold investor. If the strategy is valid for all sectors and styles, we would expect to see similar results for defensive sectors and dividend stocks alike. What does the evidence show?
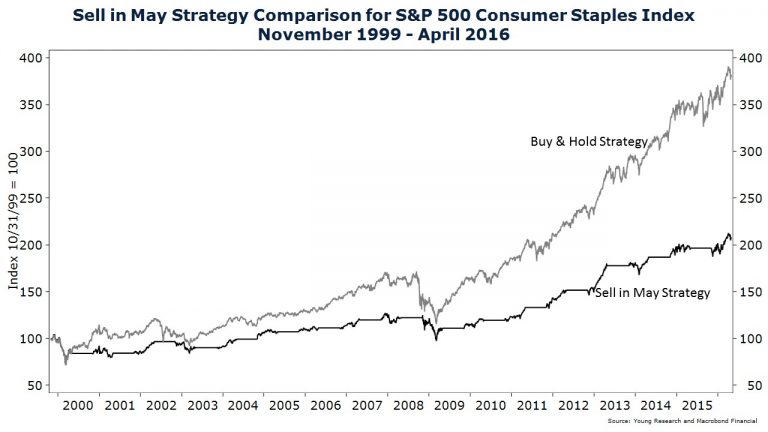
The Sell in May strategy was not as successful in the defensive sectors of the market as for the S&P 500 as a whole; it did not work for consumer staples and healthcare, it was neutral for utilities, and it worked in telecom. The chart below compares the performance of a Sell in May strategy for the S&P 500 Consumer Staples sector to a buy-and-hold strategy. The buy-and-hold approach is the clear winner for consumer staples stocks.
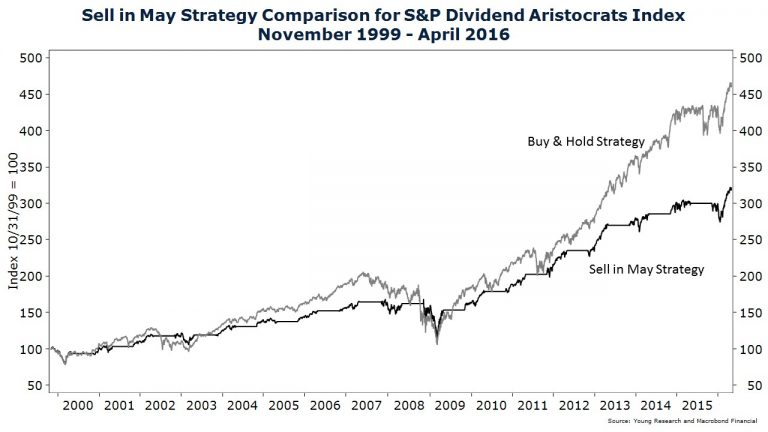
The same turns out to be true for dividend-paying stocks. The total return of a buy-and-hold position in the S&P Dividend Aristocrats Index (companies that regularly pay and increase their dividends) earned significantly more than an investor selling out of the index every May and buying back in every November. And that’s even before accounting for taxes.
The Fatal Blow: Taxes
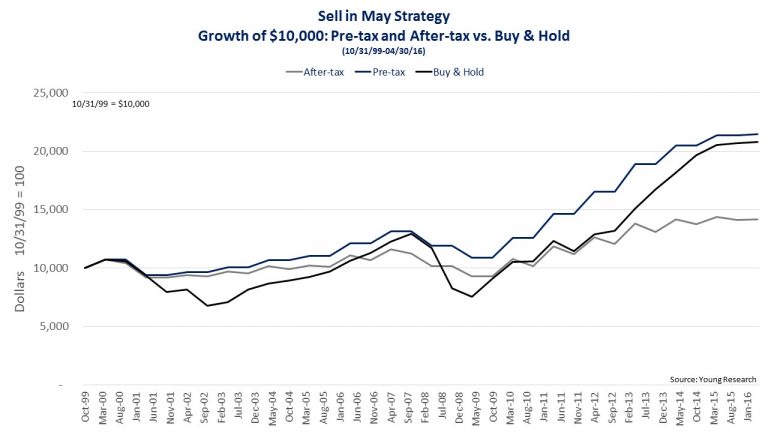
The final nail in the coffin for the Sell in May strategy is taxes. When you sell stocks every six months, all of your gains are taxable at ordinary income tax rates. For investors in the highest income tax bracket, investing in a taxable account, that means at least a 39.6% haircut on every gain. The tax liability that the Sell in May strategy generates turns a marginally winning strategy into a big loser. Our chart below compares the growth of a hypothetical $10,000 invested in the S&P 500 in November 1999 using a buy-and-hold strategy, a Sell in May strategy before tax, and a Sell in May strategy after tax. As stated above, after taxes, Sell in May loses and buy-and-hold wins.
In our view, Sell in May and Go Away is not sound long-term investment advice. It is a market timing strategy that cannot be adequately explained, does not work across sectors and styles, and may generate tax liabilities that significantly outweigh its pre-tax performance advantage.
As most of you are aware, market timing is not a strategy to which we subscribe. Over the short term, markets are extremely unpredictable. It is only over the long run that returns can be reasonably estimated and, even then, there is a large degree of uncertainty.
In a business where investors who are right even a little more than half the time are often considered extraordinary, market timers stack the deck against themselves. To win at market timing, you have to be right nearly 100% of the time—on the way out and on the way back in. Timers who sold out of the market as things started heading south in January and February of this year might have missed out on a quick rally and put themselves in the difficult position of deciding when to reenter the market.
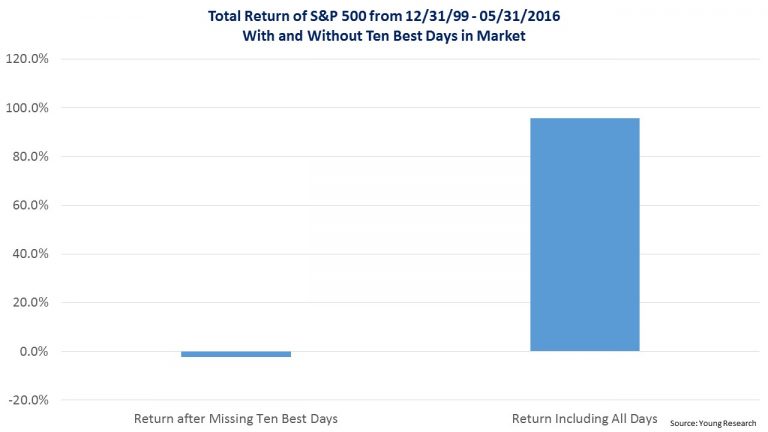
Don’t Miss the Best Days
Missing out on even a few days of gains can destroy an investor’s long-term returns. The chart below compares the performance of the S&P 500 from year-end 1999 through May 2016, including all days and excluding the 10 best days. An investor who missed the 10 best days in the market would have lost 2.3% compared to a gain of over 95% for a buy-and-hold investor.
The evidence on market timing should be clear. Achieving long-term investment success is not about market timing, but rather about time in the market. Now, that’s an adage worth remembering.
Have a good month. As always, please call us at (888) 456-5444 if your financial situation has changed or if you have questions about your investment portfolio.
Warm regards,
Matthew A. Young
President and Chief Executive Officer
P.S. With the European Central Bank and the Bank of Japan moving rates into negative territory, it is estimated that there is over $10 trillion in negative-yielding debt across the global financial system. Why have the ECB and the Bank of Japan gone negative with rates? A skeptic might respond that it is an act of desperation. After keeping rates at zero and printing billions of yen and euros a month to buy bonds and other assets, the banks have failed to ignite the kind of inflation they had hoped these policies would generate. By experimenting with negative rates, the central banks are hoping commercial banks will lend more to the private sector and stimulate growth. Thus far, the results have been mixed. Negative rates act like a tax on the banking system, which isn’t an inducement to lend more. Negative rates have also encouraged some to pull their money out of the banking system and hold it in the form of cash. Safe sales in Japan are soaring as Japanese savers look to secure their increased cash holdings. The final verdict isn’t yet in on negative interest rates, but so far the negatives seem to outweigh the positives.
P.P.S. As reported on 6/20/2016 in The Wall Street Journal,
The European Central Bank bought almost €2 billion ($2.26 billion) of corporate bonds last week, keeping up an aggressive pace for a new stimulus program that policy makers hope will help drive up stubbornly low inflation in the euro area. The ECB said its corporate bond holdings rose to €2.25 billion last Friday, up from €348 million a week earlier. That total puts the ECB on track to buy around €8 billion or more of corporate bonds a month, if it continues to buy at the same pace. The corporate bond buys, launched on June 8, are part of the central bank’s yearslong (sic) attempt to stoke inflation and lower financing costs across the euro area. The ECB aims to keep inflation just below 2% over the medium term, but it has missed that target for three straight years, despite launching an array of novel policy measures, including negative interest rates and large-scale bond purchases.