A Stealth Down Year in Stocks
January 2016 Client Letter
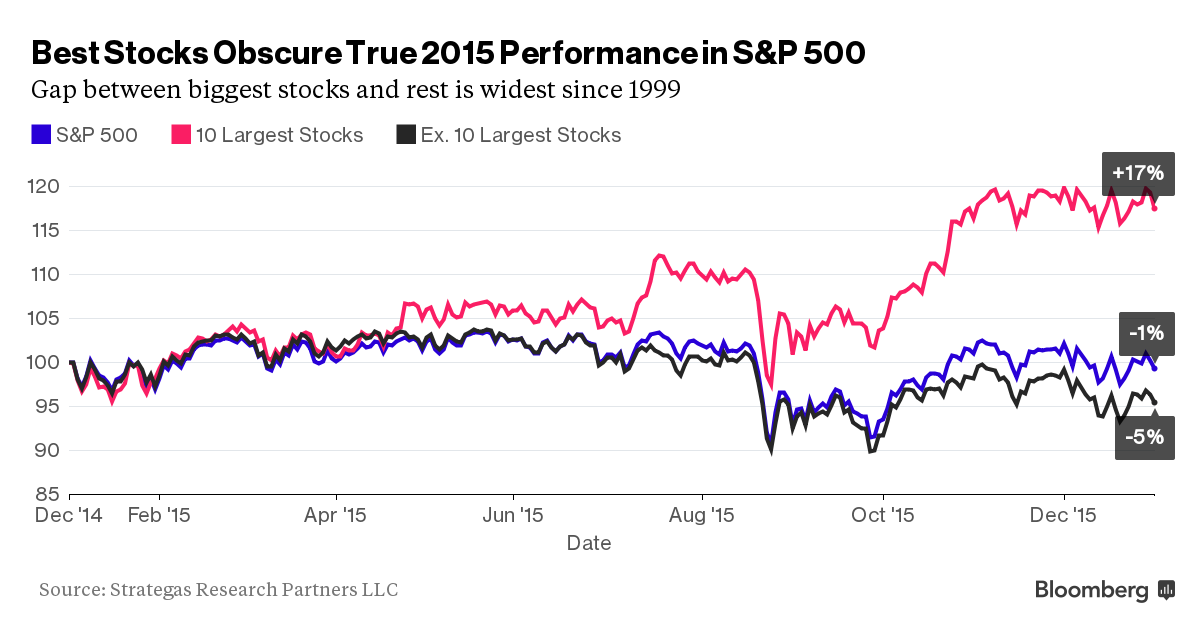
For many investors, 2015 was a challenging year. The S&P 500 managed to eke out a positive total return, but it was a handful of stocks (many of the more speculative variety) that carried the market. The average U.S. stock was down more than 4% last year. Take away Amazon, Netflix, Google, and Facebook and the S&P 500 would have finished in the red.
The following chart from Bloomberg presents the narrowness of last year’s stock market gains in another way. It compares the total return of the 10 largest S&P 500 stocks to the total return of the S&P 500 excluding the 10 largest stocks. Excluding the 10 mega-cap stocks, the S&P 500 would have fallen 5% last year.
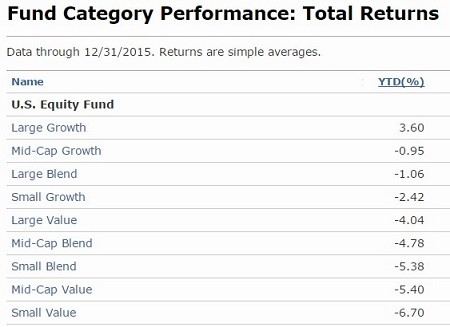
Few investment strategies managed to finish in the black in 2015. According to Morningstar, the only U.S. equity mutual fund category that delivered positive returns was large-cap growth. The large-cap growth strategy favors what we consider to be more speculative shares including Netflix, Google, Facebook, and Amazon.
The average return of mutual funds in Morningstar’s remaining eight fund categories were down in 2015. The table below shows the average return in each of Morningstar’s nine equity-strategy Style Boxes. Value shares were punished the most.
For conservative investors and investors focused on income, the news gets even more frustrating. According to Bespoke Investments, the average return of the 74 stocks in the S&P 500 that didn’t pay a dividend at the beginning of 2015 was almost 4%. The average return of the dividend-paying stocks in the index was -5.15%.
The chart below from Bespoke breaks the S&P 500 into deciles (10 groups) based on dividend yield at the beginning of 2015. The only group that managed to gain ground last year was the non-dividend-paying group. The highest-yielding stocks had the lowest returns in 2015.
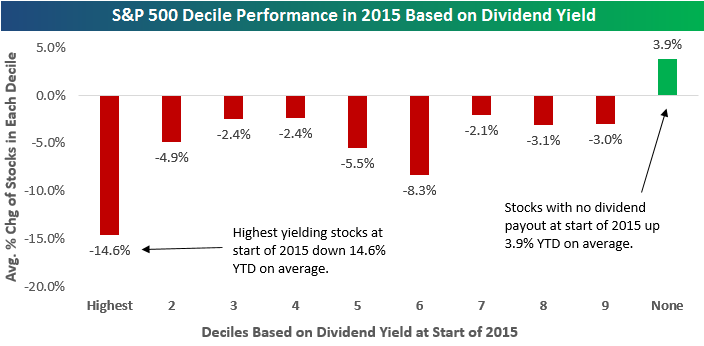
If you believe the dividend record is an indicator of quality as Benjamin Graham advised and as we believe, then it would seem that the higher the quality and the greater the investment merits of a stock, the lower the return in 2015.
Investment strategies based on diversification, dividends, and the miracle of compound interest faced significant headwinds in 2015. It was an off year for high-quality businesses with durable competitive advantages and admirable dividend records. That’s no reason to abandon a winning strategy.
International Stocks Down in 2015
The difficult year for investors was not limited to U.S. equities. International-developed and emerging-market stocks were both down last year. Emerging market shares fell almost 15%. All 17 of Morningstar’s balanced fund strategies, 11 of 15 taxable bond categories, and all 6 alternative fund categories were also down last year.
Even precious metals, which often rise when everything else falls, had a difficult year. Gold and other precious metals are a unique holding in our clients’ portfolios. They are an exception to our focus on dividend- and interest-paying securities. And gold is the only asset we buy hoping it will fall in price. Why do we hope gold falls in price? Because most often when gold is down, everything else our clients own will be up. With loads of overly indebted countries in the global economy, a new era of aggressive central bank interventionism, and an ongoing global currency war, we view gold as a necessary counterbalancer.
Except for gold, which is up over 3% YTD, 2016 hasn’t started much better than where 2015 ended. The broad-based U.S. indices had their worst start to the year on record and are currently down about 10% YTD. Smaller capitalization stocks, such as those represented by the Russell 2000 Index, fell into bear market territory in January. Foreign shares, high-yield bonds, and commodities have also had a rough go of it so far in 2016.
While some investors have been rattled by the early January correction, equity markets started showing signs of potential trouble in 2015. In mid-August, the Dow and the S&P declined by more than 10% in about a week’s time. The Chinese market crashed from a bubble high; high-yield bonds sold off; energy markets continued to weaken throughout the year; and, as we alluded to earlier, the market was carried by a narrow group of stocks and investment strategies.
As many of you know, we’ve had concerns about the nature of the rally for some time. We have written to you in the past about the Federal Reserve’s ultra-loose monetary policy distorting asset prices, creating bubble conditions in the market, and pulling equity returns from the future into the present.
Zero-percent interest rates and multiple rounds of quantitative easing successfully pushed equity prices up to levels that were not commensurate with the underlying fundamentals.
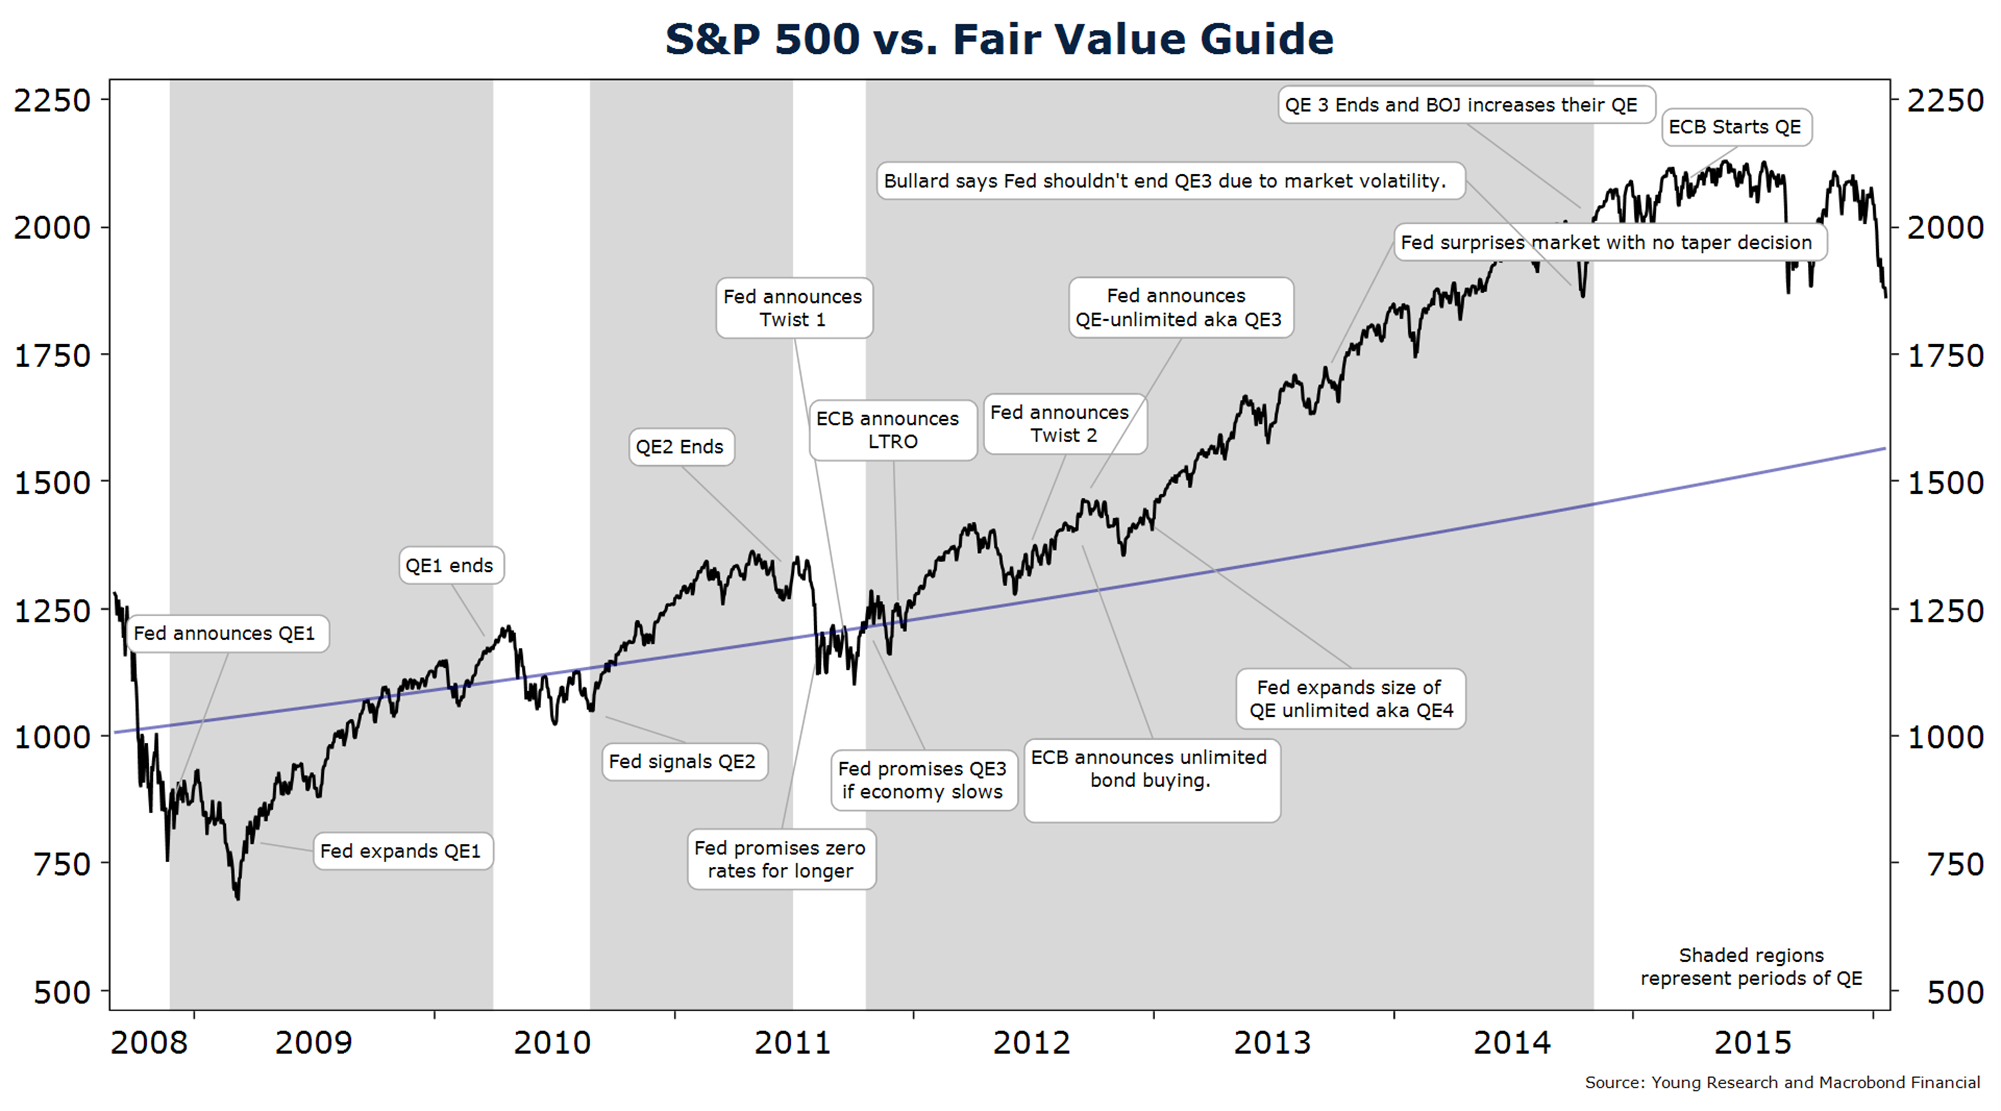
In our October 2013 client letter to you, we presented a version of the chart that follows and advised:
The problem with continuing QE is the potential for creating another bubble. We have seen this bubble situation before. In the early 2000s, high valuations were justified as a result of new efficiencies from technology and the internet. Leading up to 2008, then Fed chairman Alan Greenspan pointed to new credit derivatives as one reason why risks could be controlled by financial institutions. Today, the justification for excessive stock market valuations is the TINA (there is no alternative) factor. The Fed’s policy of holding short-term interest rates at zero and putting pressure on long-term interest rates has convinced many investors to bid up stocks to prices that imply dismal medium-term returns. As in 2000 and 2007, the Fed appears unmoved by the financial excesses that its policies are creating.
More than two years later and 15 months after the end of the Fed’s last money-printing campaign, the Dow is trading about where it was in October 2013. Meanwhile, some bonds that were seen as no alternative to stocks delivered greater returns than the Dow. Our favored Vanguard GNMA was up 7.5% to the Dow’s 7%, with much less volatility.
After a couple of years of equity market stagnation, fundamentals have started to catch up to prices, but there is still a way to go to get back to historical norms. What would it take for stocks to return to more normalized levels? There are two ways markets can adjust: through price or time. By our estimates, another two years of flat performance plus a further correction of about 5% would get the market back to about 16X normalized earnings. That’s right around the long-term historical mean level. Alternatively, an immediate 16% correction from current levels would also get the market back to its historical level. Of course, the market is prone to overshooting on the upside as well as the downside, so we’re under no illusion that the stock market will stop falling or start rising immediately after hitting our fair-value guide.
Even though we’ve had nagging concerns about the equity markets and have positioned our clients’ portfolios defensively, sharp corrections are still painful for many to endure and unnerving to watch. However, corrections are a regular part of the equity investing landscape. One reason stocks tend to provide greater long-term returns than bonds is because of this volatility.
The Frequency of Stock Market Corrections
Typically there are about three corrections of 5% or more in a 12-month period, and one correction of 10% or more. Corrections of 20% or more—which is the accepted definition of a bear market—occur every 3.5 years on average. We haven’t had a 20% correction in almost seven years.
We’ve been overdue for a big correction, but big corrections are no reason to abandon an investment plan. We’ve had many corrections since this bull market began.
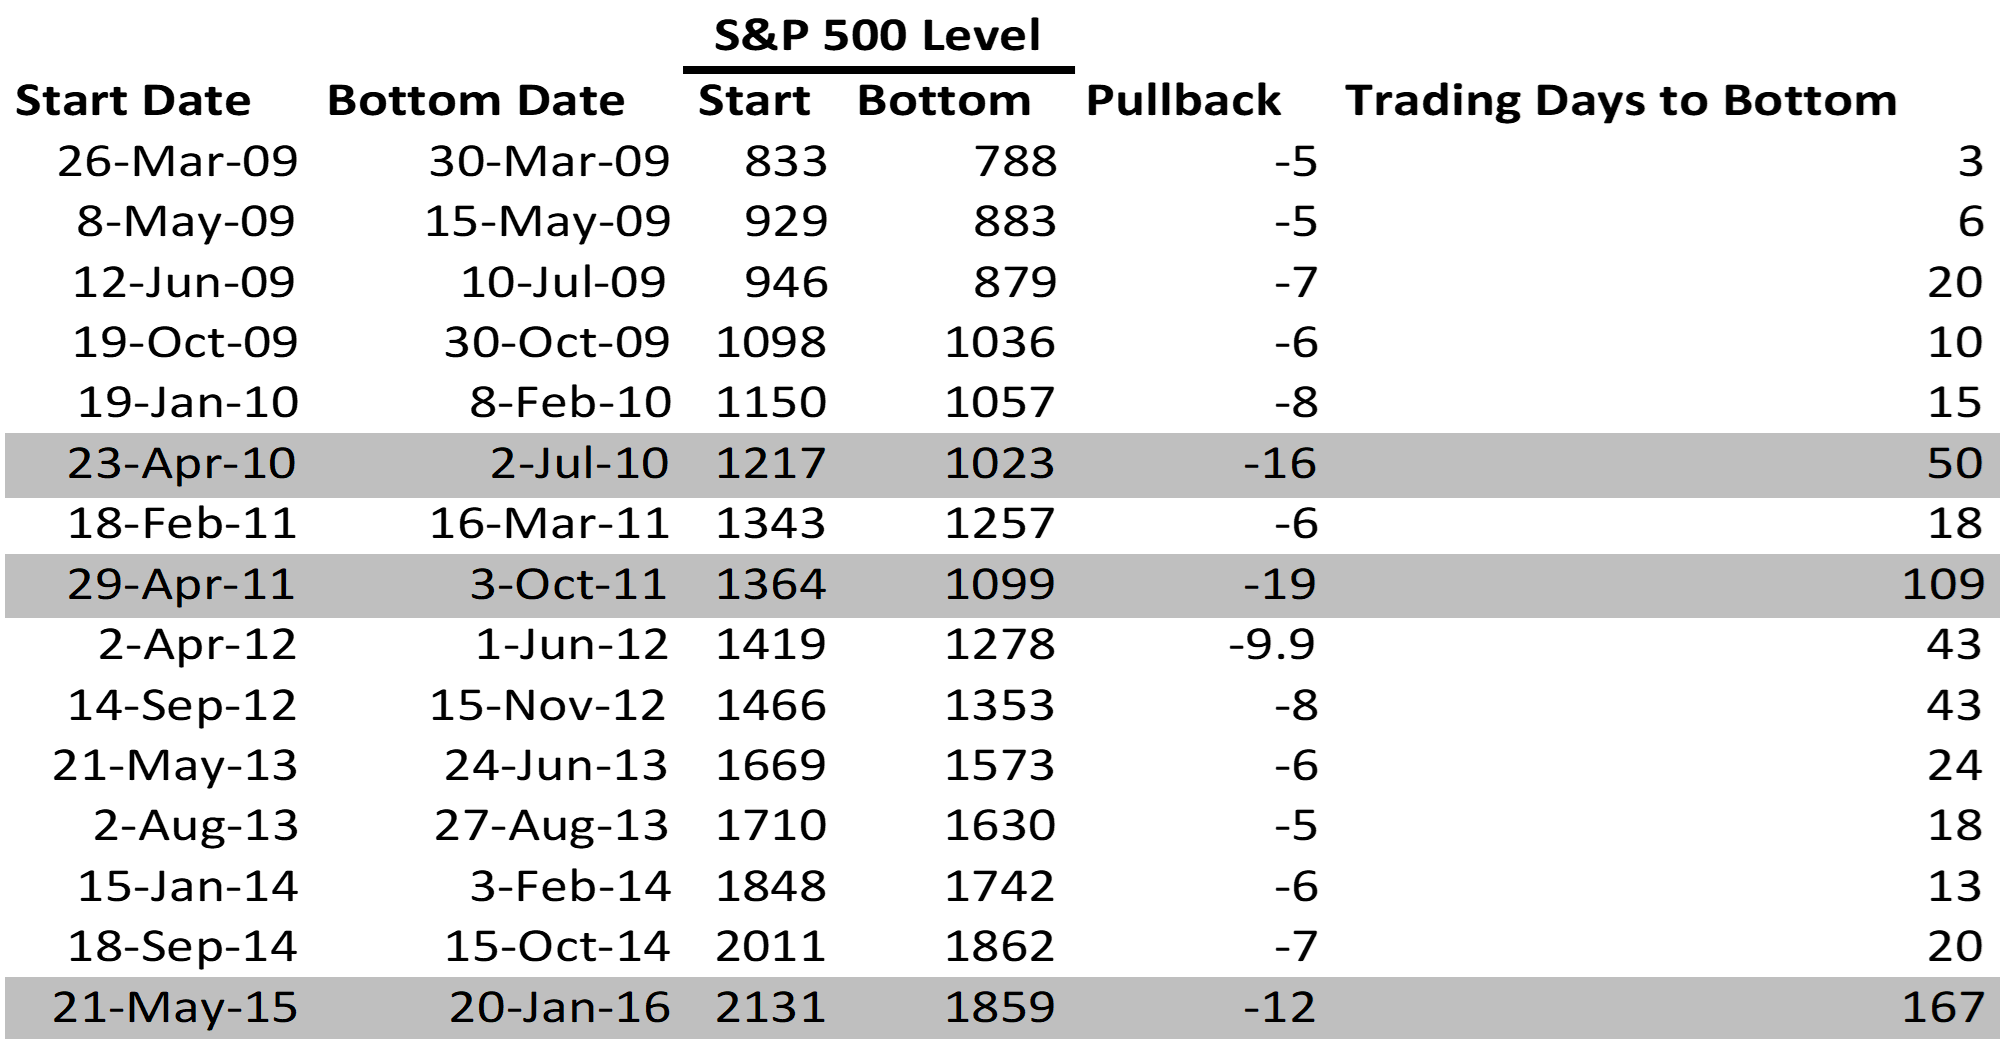
From the March 2009 low through year-end 2015, the S&P 500 was up 248%, or nearly 20% per annum. During this time the S&P has had 15 corrections of 5% or more and 3 corrections that made it past the 10% mark. (The 2012 episode fell just short.) The market hasn’t had a 20% correction since the March 2009 low, though it came close in 2011. Below is a list of all corrections of 5% or more from the March 2009 low through January 2016. Shading indicates pullbacks of 10% or more.
What is driving this current down-leg in stocks? While there are likely a multitude of factors affecting prices, many investors seem to be focused on oil prices. Oil prices have fallen sharply over the last 18 months. Many oil producers are bleeding cash, there is concern that some overly indebted producers could default on their debt, and the downturn in oil is hurting some oil-exporting nations. A strengthening dollar has also contributed to oil’s slide.
There is little doubt this has been one of the worst environments on record for oil and oil companies. Twenty-eight-dollar oil seemed unthinkable only months ago, but is a reality today. We remain skeptical of the sustainability of $28 oil. Many fields are unprofitable at current prices, and bringing on much new production at sub-$30/barrel is a pipe dream. So, as has been true in past oil-price cycles, low prices should eventually be the cure for low prices. Demand is growing at about one million bbls of oil per day. The natural decline rate of existing oil wells is about 4% or almost four million bbls per day. Excess supply is currently in the neighborhood of two to three million bbls per day. If the low oil price prevents new production from coming online to replace declining fields, the oil market could turn from a surplus to a deficit within the year. That’s not a forecast, but we do remain reasonably comfortable with our energy positions and the prospects for a future rebound in this sector.
Consumer Staples Lag in Bull Markets
We also remain comfortable with our significant weighting in consumer staples companies. Consumer staples stocks are the largest component of our equities portfolios, and they are among the more defensive areas of the market. Staples stocks tend to be a drag on performance during bull runs, but they make up for it during corrections and bear markets. From the stock market bottom on March 9, 2009, through year-end 2013, the S&P 500 gained 203% compared to consumer staples’ 157% gain. From year-end 2013 through January 20, 2016, the S&P 500 gained 5% to consumer staples’ 18%. The total return gap between the two sectors has narrowed from 46% to 15% and the stock market has yet to experience a full-blown bear market.
Many of the consumer staples stocks we invest in have high barriers to entry, durable competitive advantages, and low sensitivity to the business cycle. In our view, many of the market’s best dividend stocks are in the consumer staples sector. Consumer staples stocks often have higher dividend yields and stronger dividend growth than stocks in other sectors. We believe high dividends today and the promise of higher dividends tomorrow are a powerful tonic for retired investors and those soon to retire.
Have a good month and, as always, please call us at (888) 456-5444 if your financial situation has changed or if you have questions about your investment portfolio.
Warm regards,

Matthew A. Young
President and Chief Executive Officer
P.S. “What’s the best action you can look for in a stock? A long record of increasing dividends. Many lies can be told about a stock, but dividends don’t lie. In order to increase dividends, a stock must create a history of producing cash. Analysts can lie, CEOs can lie, but dividends don’t lie. A company must increase its actual earnings in order to raise dividends.” Richard Russell, editor of the Dow Theory Letters.
P.P.S. We eliminated our position in the Fidelity Floating Rate High Income fund late last year. It is our view that we have reached the peak in the credit cycle. Credit fundamentals have started to deteriorate and lower-quality bonds have sold off. The illiquidity in bond markets created by new regulations has also become worrisome in light of the soured sentiment on the sector. We have been investing the proceeds in higher-quality individual bonds and selecting lower-quality individual bonds that we continue to view as creditworthy.
P.P.P.S. Investors could face a challenging 2016 even if equity markets rebound. In discussing the errors of the Federal Reserve and the U.S. government, David Malpass writes in the February 8, 2016, issue of Forbes:
The Federal Reserve and other financial regulators have been aggressively deflationary, driving the dollar up and prices down, starting with gold in 2011. Both the Fed’s zero interest rate and its post-2009 bond buying have been giant mistakes, causing global growth to grind to a near halt.
The monetary policy burden has been compounded by a lack of structural reforms in the U.S., Japan and Europe. The U.S. government spends without a meaningful budget, squandering hundreds of billions of taxpayer dollars per year while imposing a regulatory maze that’s almost impenetrable. Our personal income tax system is in shambles. Our corporate tax rate is one of the world’s highest, causing corporate flight, while some of our strongest companies keep their cash abroad to avoid confiscatory tax rates at home.