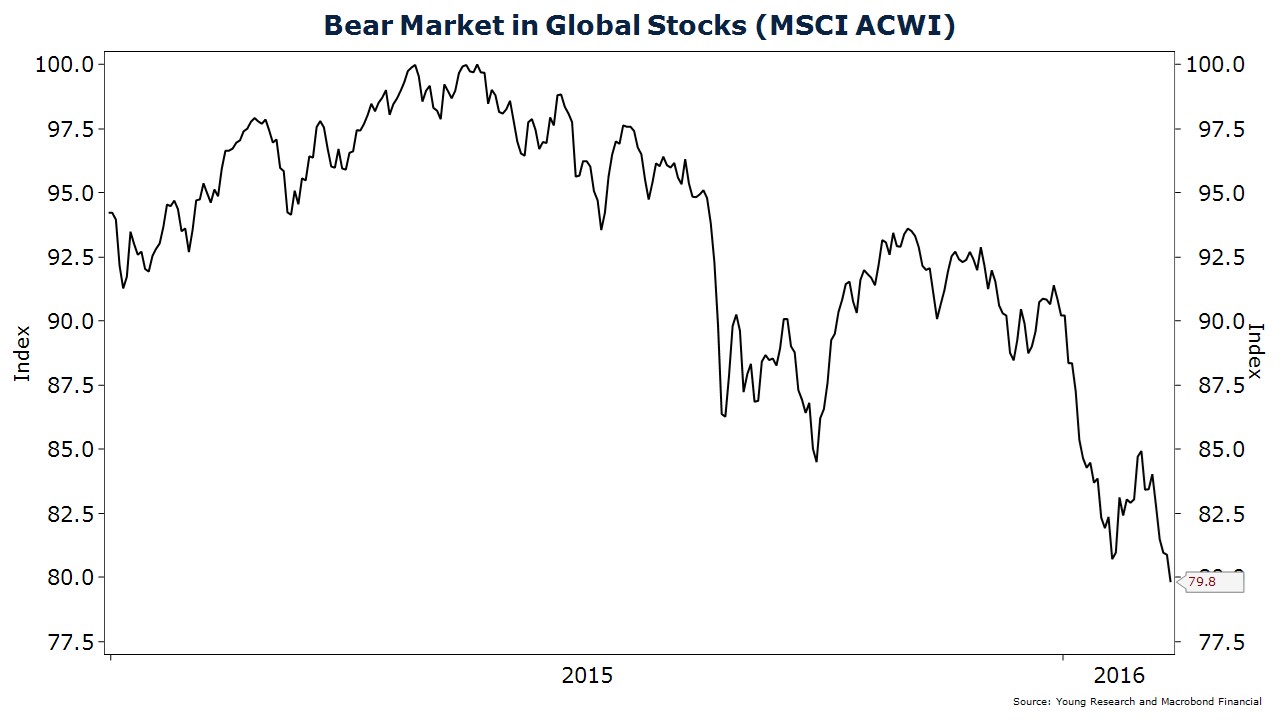
Bear Market in Global Stocks
February 2016 Client Letter
The stock market volatility that started in January continued into February. Up until mid-February, global equity market indices recorded lower lows and lower highs. Many equity markets entered bear markets. According to its widely accepted definition, a “bear market” describes a decline of 20% or more from the prior bull-market high. By that definition, the S&P 500 hasn’t officially entered a bear market, but over 75% of the 3,000 largest U.S. companies have fallen at least 20% from their highs. That’s a quorum by our count.
Bear Market in Small-Cap Stocks
Small company U.S. stocks have officially entered bear-market territory. The small-company Russell 2000 Index has fallen 26% from its bull-market high. And as of early February, the MSCI All-Country World Index—the gold standard of global stock market indices—crossed into bear country. Emerging market stocks have long been in a bear market, and foreign-developed world equities arrived in bear territory in January.
With the U.S. economy still plugging along at a moderate pace of growth, why are stocks falling so sharply? Some have attributed the selling to the continued drop in oil prices and the strain energy company defaults may put on the global financial system. Others have cited the recession now underway in the manufacturing sector of the economy and slowing global growth as causes for concern. The liquidation of sovereign wealth funds has also been viewed as a catalyst for the selling. As has a potential currency devaluation in China and other emerging nations.
While all of these factors may be contributing to the sell-off, investors have been at a loss to fully understand the persistent weakness in stocks. You might call it a correction without a cause, which, for the record, the chartists insist is the most dangerous kind.
What is Young’s view on the correction? There isn’t a single catalyst we can point to with any degree of confidence to fully explain the most recent down-leg in stocks. But we have been consistent in saying for years now that the QE-fueled ascent of stock prices was unlikely to end with roses and butterflies.
In our view, by deliberately holding rates at zero and flooding the global financial system with liquidity, the Fed and its foreign counterparts purposefully drove up asset prices to levels not adequately supported by fundamentals.
We’ve run the following chart more than a couple of times over the last few years (including in January), but I think it provides a useful illustration of market dynamics in the post-financial crisis era. Every time the Fed has laid on the monetary accelerator with quantitative easing, stock prices have risen far above fair value (according to our estimates). And every time the Fed has let off the gas, stock prices have reverted back toward our fair-value guide. Correlation doesn’t guarantee causation, but one should not ignore the fact this indicator is three for three.
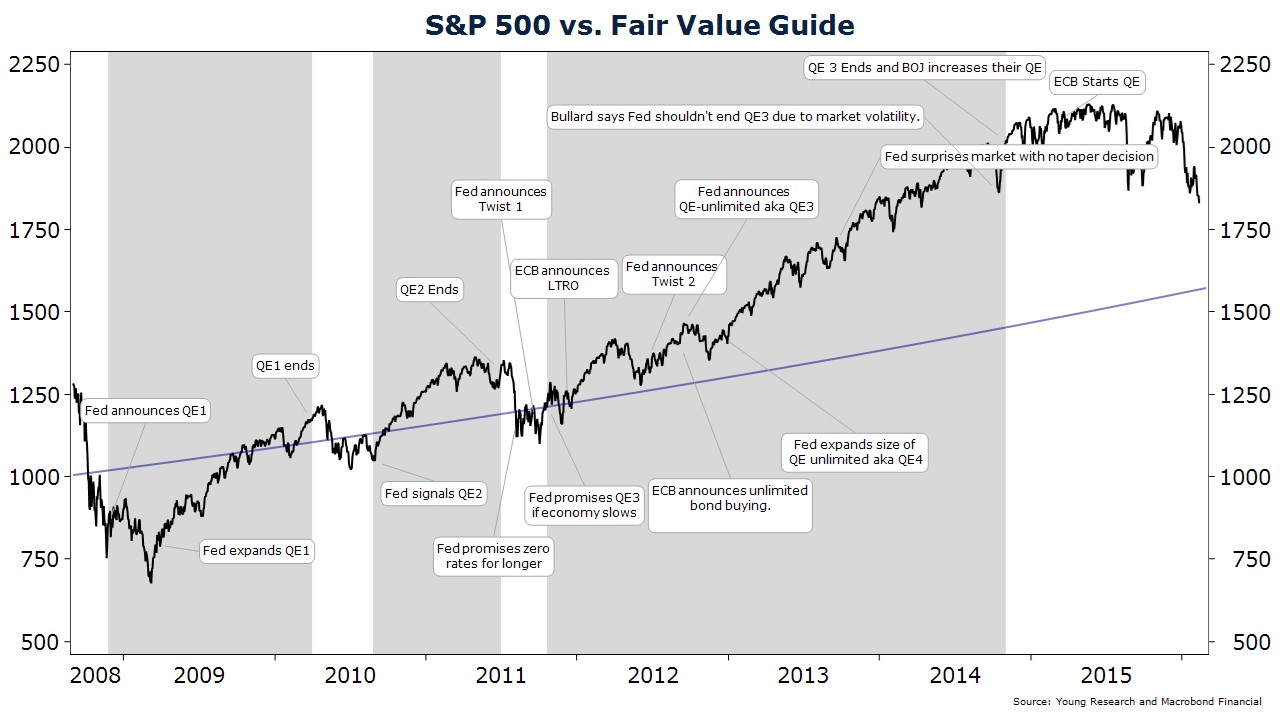
As shown in the chart, during the latest episode, the descent toward fair value has taken more time to unfold and it hasn’t been as sharp as prior corrections. That may have something to do with the Bank of Japan and the European Central Bank ramping up stimulus of their own just as the Federal Reserve was unwinding QE.
Our S&P 500 vs. Fair-Value Guide isn’t intended to predict stock prices. We use it more as an indicator of risk. It is possible stock prices won’t hit our fair-value guide before reaching new highs. The Fed could always announce another quantitative easing program or come up with a new policy tool in an effort to stimulate economic growth through asset price inflation.
Central Banks are Already Dreaming up New Policies to Stimulate
The world’s other central banks are already dreaming up new and creative (some might say desperate) policies to stimulate their economies.
The latest foray into real-time monetary experimentation comes courtesy of the Bank of Japan (BOJ). At its last policy meeting, the BOJ decided to go negative with interest rates. The BOJ cut the rate on new reserve deposits held at the bank to -0.10% from +0.10% and hinted it could reduce rates further into negative territory.
The negative interest rate policy comes on the heels of a bond-buying program (still under way) that has led to the monetization of 30% of Japan’s outstanding government debt and a balance sheet that is now equal to over 70% of the country’s annual GDP. The BOJ has bought everything from government bonds to Japanese stocks (the BOJ owns half of the ETF market in Japan). Japan’s QE program has failed to generate the 2% inflation target the BOJ is after, so policymakers decided to try a different tactic.
The BOJ joins the European Central Bank and the central banks of Denmark, Sweden, and Switzerland that have also cut rates into negative territory. The latter three have gone negative mainly because they have little choice. The citizens of European countries who use the ill-fated euro would much rather hold francs, krona, or krone than euros; but Switzerland, Sweden, and Denmark are tiny compared to the euro area. Hot money-flows into these countries can unduly drive up the value of their currencies and destabilize their economies. Negative rates are a necessary deterrent to these volatile safe-haven flows from the euro zone.
The BOJ’s negative interest rate policy has a different aim than deterring safe-haven flows. Inflation is the goal. It seems odd to charge banks for holding reserves if one’s goal is higher inflation. Banks are the institutions that convert base money into broad money, which is the raw material of inflation. If you erode their capital, they may convert reserves to cash or lend less to the private sector.
We also find it surprising central bankers haven’t considered the potentially longer-run deflationary implications of negative rates. It would seem to us that the BOJ’s renewed efforts to debase the yen (what negative rates tend to do) would accentuate the deflationary impulse in the global economy and ultimately be more negative than positive for global growth.
Japan is a big export-oriented economy. When it debases its currency, it weakens growth; causes competitor nations to retaliate with similar currency, weakening monetary policy; and ultimately leads to lower—not higher—inflation.
Monetary Policy Desperation
We view the embrace of negative interest rates by the global central banks as a sign of monetary policy desperation. Central banks have few if any sensible policy tools left in their arsenal. Anything beyond a few basis points into negative territory for rates is probably unsustainable in the medium-term. If central banks try to go too far down this path, investors, bankers, and depositors will probably start to hoard cash—it’s shocking they aren’t already.
How are we positioning our clients’ portfolios to deal with what may be a new iteration of misguided monetary activism? As we have advised for years, we continue to favor a globally diversified portfolio of dividend stocks, bonds, and precious metals. This type of diversification forms the foundation of our investment philosophy at Richard C. Young & Co., Ltd.
Properly diversified portfolios seem to fall in and out of favor with the investing public. In recent years, when U.S. stocks were the only asset class performing well, diversification fell out of favor. Nobody wanted to own fixed income—the yields were too low. TINA (There Is No Alternative to stocks) became the rallying cry of the big brokerage houses and their clients.
One major benefit of crafting a properly diversified portfolio is counterbalancing. With a counterbalanced portfolio, you will never have a portfolio with the highest return in any single year, but you also reduce knock-you-out-of-the-game losses that sabotage the retirement savings of so many.
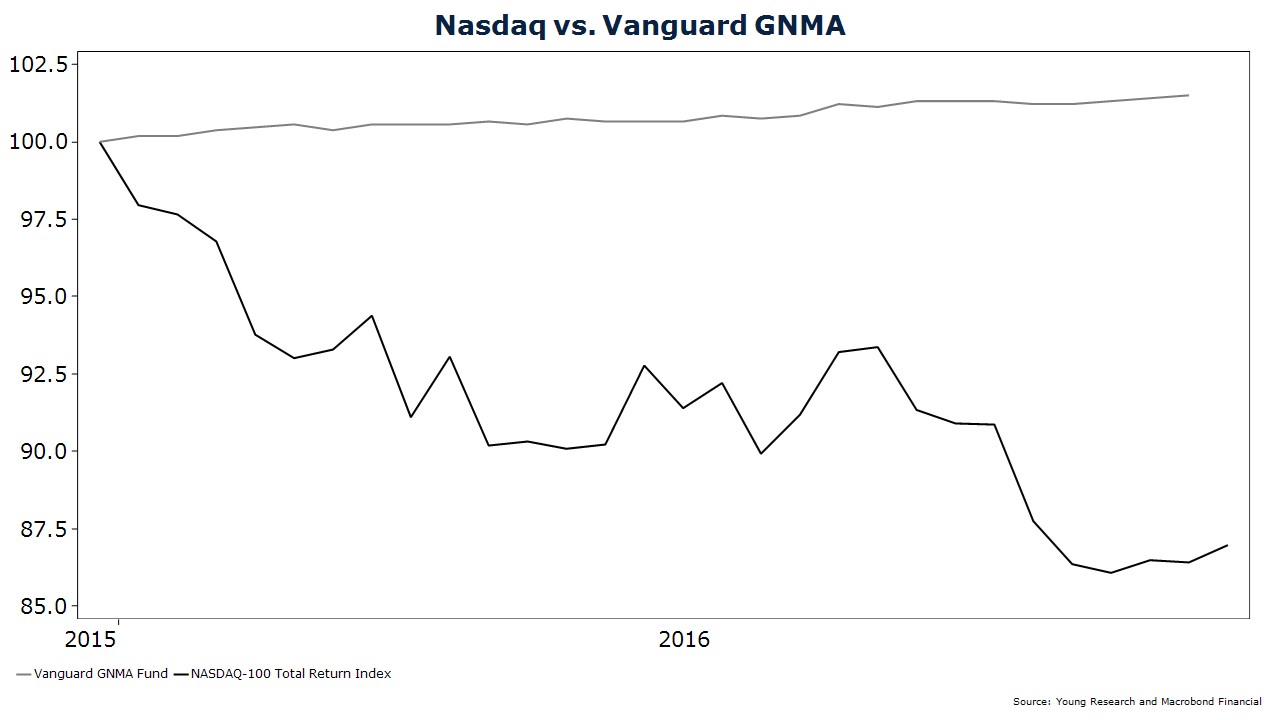
Vanguard GNMA, a long-time holding in many of our clients’ fixed-income portfolios, provides a powerful example of the benefit of counterbalancing. Vanguard GNMA hardly gets investors excited during favorable years for stocks like 2014 and 2015. When the Nasdaq was up 14% in 2014 and 7% in 2015, Vanguard GNMA was up 7% and 1.3%. But in a period like 2016 when the Nasdaq fell 14% from its high, Vanguard GNMA provided investors with a 1.6% total return. GNMA’s steady stream of income is a source of cash for compounding, and it helps save the day during difficult environments.
Gold is another asset we own for clients that has been unloved for a few years, but is now showing its counterbalancing bona fides. It wasn’t surprising to us that gold was a drag on returns in 2013, 2014, and 2015 when equity markets were up big. We’ve written often to you that we buy gold and hope it goes down because typically when gold is down, everything else in your portfolio will be up.
So I guess it is with some dismay that I report gold (and gold stocks) are up big in 2016—more than 14% for the SPDR Gold Shares Fund. That compares to the 4.4% loss in the S&P 500, the 5.5% loss in global stocks, and the 8% loss in the Nasdaq.
As outlined earlier, we haven’t believed markets would gradually and nicely unwind after years of quantitative easing. The table was set for some type of payback, and when payback comes, gold is an asset that tends to shine. We continue to own gold as a hedge against years of quantitative easing, zero and negative rates, mispricing, misallocation, and currency risk. However, we do still hope it goes down in price.
Payback Coming for the Speculative?
Payback is also a theme that applies to our equity investing strategy. Our equity portfolios include companies that pay dividends and often have a long record of regular dividend increases. We also tend to favor more defensive businesses, such as those in consumer staples and healthcare. During bull markets, defensive areas of the market tend to fall out of favor with investors. Defensive stocks lag their more cyclical and speculative peers. This has certainly been true over the last few years with 2015 serving as an especially glaring example. Corrections and bear markets are when payback comes for the cyclical and speculative.
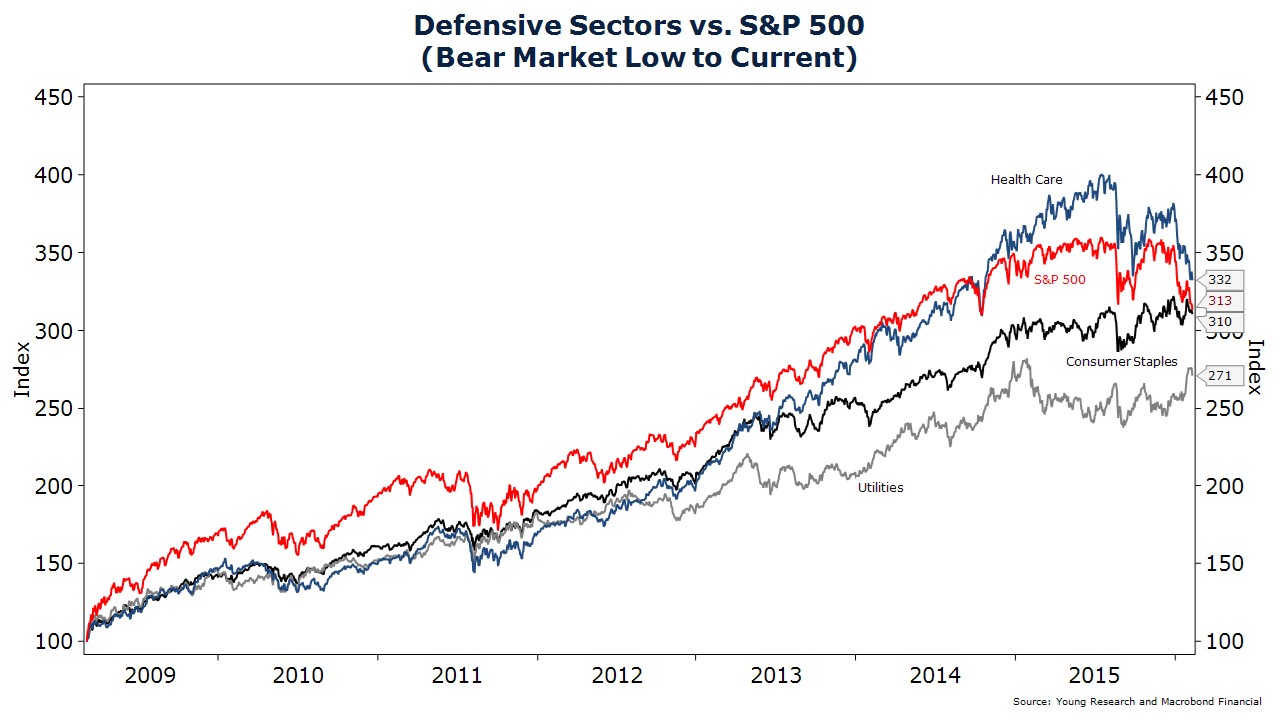
We haven’t yet seen a full-fledged bear market in the S&P 500; but, as our chart shows, from the bear market low in March 2009, the total return of the less volatile consumer staples sector is now slightly away from the return of the more volatile S&P 500. Healthcare shares are actually ahead of the market for the cycle, while utilities, having made up some ground recently, still lag a bit.
What’s the takeaway here? Retired investors and those saving for retirement can do just fine with a defensive portfolio of dividend-paying equities—if they are willing to ride out periods of soft relative performance.
Dividend-paying companies are often more durable businesses than are non-dividend-payers. Payers often have higher barriers to entry and stronger balance sheets than do non-dividend payers. And because there is a stigma associated with cutting dividend payments, the consistent payment of dividends is a signal of management confidence in the future prospects of a company. This is especially true of companies that raise dividends. These characteristics will not prevent a share price decline, but can offer some comfort during more difficult economic periods and periods of stock market volatility.
Have a good month and, as always, please call us at (888) 456-5444 if your financial situation has changed or if you have questions about your investment portfolio.
Warm regards,

Matthew A. Young
President and Chief Executive Officer
P.S. “The 70% decline in the price of oil since early 2015 will eventually turn out to have a positive impact on U.S. economic growth. Until now it has caused a dramatic decline of activity in the U.S. oil industry and in related manufacturing and construction firms. But the fall in gasoline prices alone has increased annual household spending power by about $129 billion or more than $1,000 per household. Although households have temporarily plowed much of this found money into savings, we are likely to see it lead to increased consumer spending in 2016 and 2017.” Martin Feldstein, The Wall Street Journal, 2/21/16
P.P.S. “In what could well be a final act of desperation, central banks are abdicating effective control of the economies they have been entrusted to manage. First came zero interest rates, then quantitative easing, and now negative interest rates—one futile attempt begetting another.
Just as the first two gambits failed to gain meaningful economic traction in chronically weak recoveries, the shift to negative rates will only compound the risks of financial instability and set the stage for the next crisis.” Stephen Roach, Project Syndicate, 2/18/16
P.P.P.S. Enclosed for your review is a brochure from the Federal Trade Commission identifying steps you can take to help protect yourself against identity theft. As indicated in previous letters, the threat of both identity theft and cybercrime continues to grow. Please contact us immediately if you have been or suspect you have been the victim of either.