Buying the Highest-Yielding Stocks
November 2019 Client Letter
For investors who may be new to dividend investing, a tempting first place to look for ideas is with the highest-yielding dividend stocks. If dividends are the goal, the assumption is bigger dividends are better than smaller dividends.
Take the S&P 500 as an example. The 10 highest-yielding stocks in the index have an average yield of almost 8% compared to less than 2% for an S&P 500 ETF. An 8% yield is surely better than a 2% yield reason some beginners. And with Macy’s yielding 10.3% and L Brands (Victoria’s Secret, Pink, Bath & Body Works) yielding 7.1% among the group, the familiarity of these household names can lead to misplaced confidence in such a strategy.
What’s wrong with just buying Macy’s, L Brands, and the eight other highest-yielding stocks in the S&P 500 and calling it a day?
The problem with limiting your dividend portfolio to the highest yielders is they are often the companies most likely to cut their dividends. For example, four of the ten highest-yielding S&P 500 stocks at year-end 2016 have since decreased or eliminated their dividend. The average return of that group of stocks since year-end 2016 is -33%.
The Best Dividend Stocks
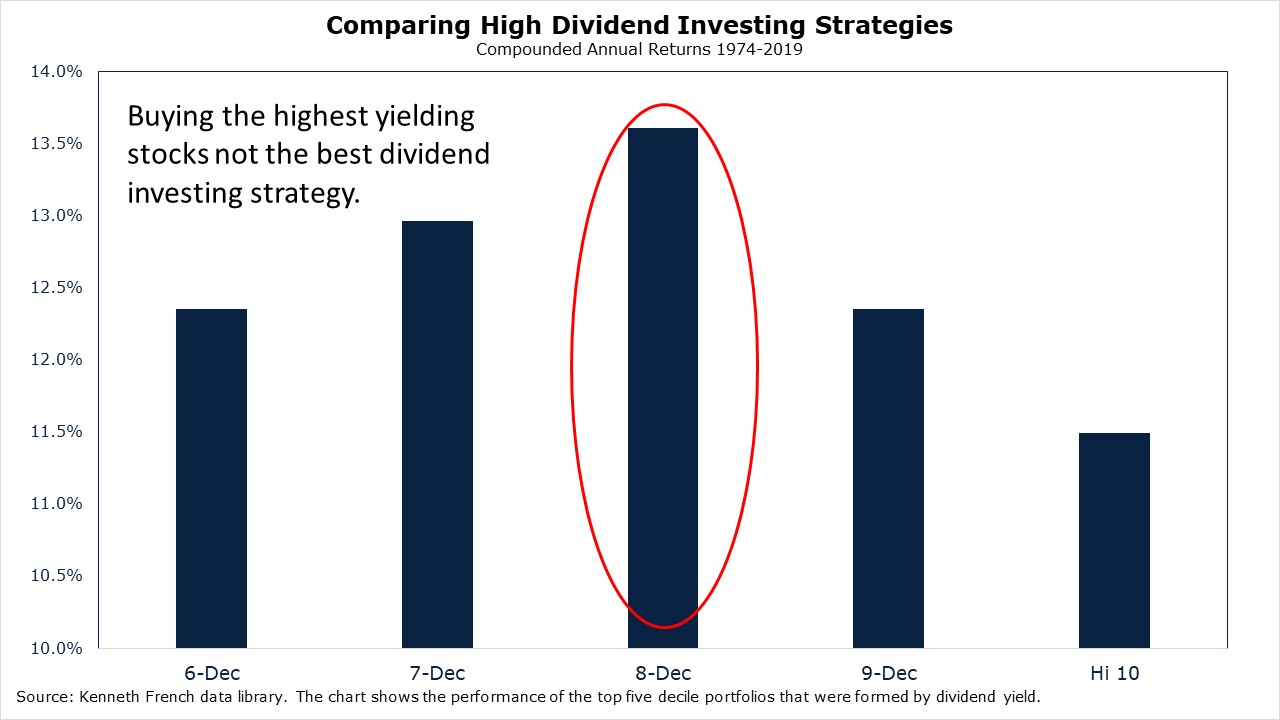
As most seasoned dividend investors would likely tell you, selecting the best dividend stocks isn’t as simple as buying the highest-yielding companies. The chart below compares the long-term performance of five different dividend-investing strategies.
The first strategy, represented by the column to the far-right, ranks all U.S. stocks by dividend yield and then invests in the highest-yielding 10% of stocks. All stocks are re-ranked, and the portfolio is reformed annually. The second strategy, represented by the second column in from the right, buys companies in the second-highest 10% as ranked by yield. The other three portfolios follow suit.
The Best-Performing Dividend Investment Strategy
As our dividend strategy chart illustrates, investing in the highest-yielding stocks hasn’t delivered the best returns. The best-performing dividend investing strategy out of the five shown here is the portfolio that invests in dividend-paying stocks in the third-highest 10% of stocks ranked by yield.
Proper Dividend Investing Weighs a Range of Factors
This doesn’t mean you should buy only stocks in the third group when ranked by yield, but it does mean you should weigh a range of factors when crafting dividend portfolios. A juicy yield is certainly one consideration, but dividend safety and dividend growth are others that may be even more important.
Our dividend-focused Retirement Compounders® program takes into account dividend yield, dividend growth, dividend consistency, and dividend safety, among other factors.
Our goal is not to craft a portfolio with the highest yield. We instead seek to craft portfolios that generate a sustainable and rising income stream that harnesses the profound power of compounding.
Dividend Stocks Help You Stay the Course
Investing in companies that pay a steady stream of income can help investors in or nearing retirement to stay the course.
During bull markets, many investors have an easy time riding though the minor ups and downs; but when bear markets begin, investing becomes much more difficult. Bear markets can be frightening. For starters, the losses can come with staggering velocity.
Historically, bear markets move from peak to trough more than twice as fast as bull markets move from trough to peak.
Last year was a good example. A New York Times piece in December 2018 titled “Investors Have Nowhere to Hide as Stocks, Bonds, and Commodities All Tumble” captured the mood.
For the first time in decades, every major type of investment has fared poorly, as the outlook for economic growth and corporate profits is dampened by rising trade tensions and interest rates. Stocks around the world are getting pummeled, while commodities and bonds are tumbling—all of which have left investors with few places to put their money.
If this persists or grows worse, it could create a damaging feedback loop, with doubts about the economy hurting the markets, and trouble in the markets undermining growth.
From its September 20, 2018, high, the S&P 500 lost 19.8% through its December 24 low. That three-month loss wiped out all of the index’s capital appreciation of the prior 20 months.
This year, the fear of recession has been replaced by the fear of missing out. In a survey of fund managers, Bank of America found in its latest monthly survey that institutional investors deployed the most cash since President Trump was elected in 2016. Today, cash on hand at funds is at its lowest level since June of 2013.
Risk and Reward
If you find yourself wanting to sell all your stocks when markets are caving in and all your bonds when stocks are rallying to capture a little more upside, it may be time to reevaluate your risk tolerance.
Determining how much risk you can afford to take and how much risk you are comfortable taking is key. Many investors are willing to forgo some amount of return to reduce the potential for loss.
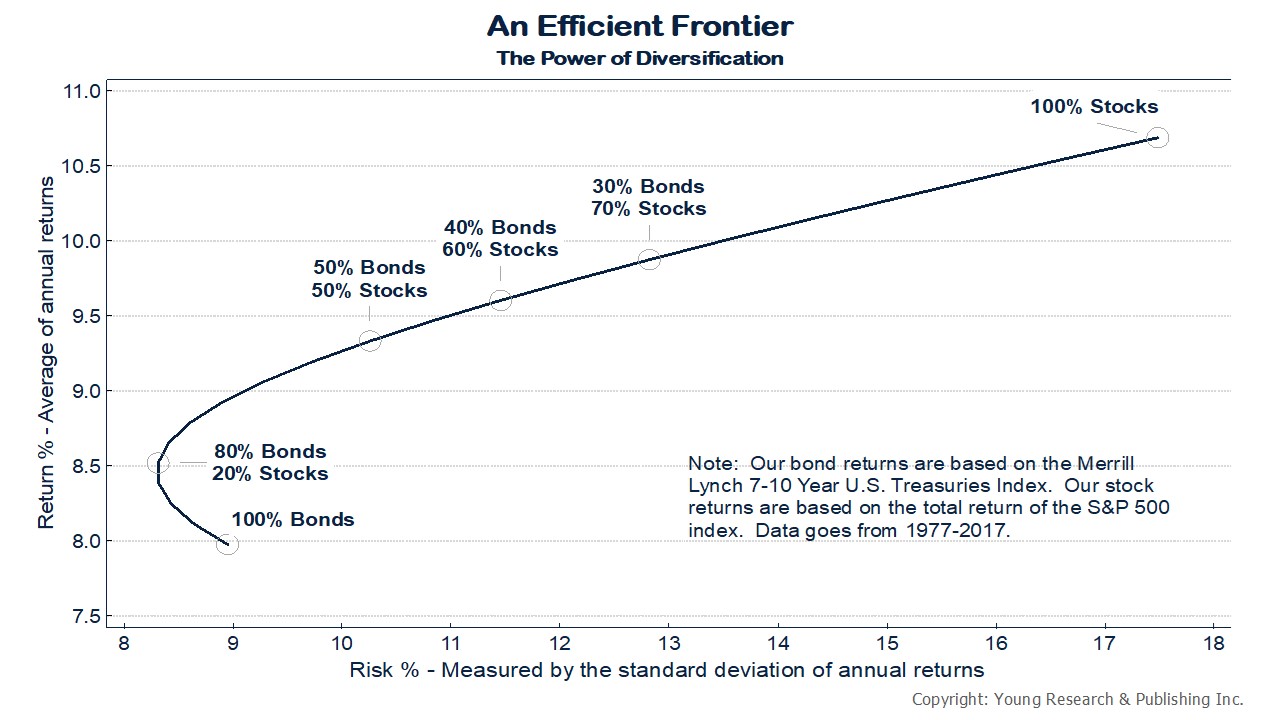
The “efficient frontier” concept, created by economist Harry Markowitz in 1952, measures the efficient diversification of investments that delivers the highest level of return at the lowest possible risk.
Investors must consider the trade-off between risk and reward in their portfolios. You can see on the chart below an efficient frontier line representing risk vs. reward for a portfolio allocated between different proportions of stocks and bonds.
On the vertical axis is the return earned by the portfolios, and along the horizontal axis is a measure of how much risk was taken to earn those returns. As you can see by comparing the portfolio of 75% bonds and 25% stocks to the portfolio of just bonds, as portfolios take on a small number of stocks, diversification lowers risk and increases reward.
Anything above the line is unachievable because no portfolios earning those returns are available at the corresponding risk levels. And any portfolios that fall below the line can be outperformed with the same amount of risk or have their returns matched with less risk.
But to achieve higher returns along the line, investors adding more stocks to their portfolios are taking on ever-greater amounts of risk. A portfolio of 100% stocks has a standard deviation of 17%.
The higher the standard deviation of a portfolio, the greater the potential for loss. For example, during the last two bear markets, an all-stock portfolio (as measured by the S&P 500) would have lost more than half of its peak value.
Buying Bonds for Ballast
As the efficient frontier illustrates, adding bonds to a stock-only portfolio can help reduce risk. Even at ultra-low yields, bonds have counterbalancing benefits. Take the hypothetical example of a 10-year bond yielding 1.50%. If interest rates were to decline one percentage point because stocks were crashing, the price of that 10-year bond would rise by 9.75%.
In 14 of the 15 years when the S&P 500 has been down since 1950, intermediate-term government bonds advanced. We would, of course, rather hold bonds at higher yields than at lower yields; but even at low yields, bonds are ballast for a portfolio.
Gold Has Counterbalancing Benefits Too
Gold is another asset we favor for its counterbalancing benefits. It doesn’t always behave as desired in a down market; it does, however, provide a hedge against some of the low likelihood, high-impact risks that can devastate portfolio returns. Those risks include a significant rise in inflation, a collapse of the dollar, geopolitical turmoil, and financial system upheaval, among others.
The Best Way to Buy Gold
We have long favored gold ownership via exchange-traded funds (ETFs). Gold ETFs are an easy and economical way for most investors to buy physical gold.
Since the SPDR Gold Shares ETF (GLD) debuted in 2004, it has been our go-to ETF for physical gold investing, primarily because GLD was the only game in town.
More recently, competition has emerged in the physical gold space, and the SPDR Gold Shares ETF is no longer our favored gold ETF.
Gold ETFs Are a Commodity
Unlike some equity ETFs that may cover value stocks or growth stocks by tracking an index that measures growth and value differently, the seven gold ETFs traded in the U.S. all purchase physical gold. Whether you buy the SPDR Gold Shares ETF (GLD) or the iShares Gold ETF (IAU), the assets held by each fund are essentially identical.
Expenses and Liquidity Are Key to Choosing a Good Gold ETF
Expenses and liquidity are the primary factors we focus on when selecting a gold ETF for investment. All else equal, we prefer a heavily traded gold ETF with a low expense ratio over a small infrequently traded fund with a high expense ratio.
SPDR Gold Shares ETF (GLD) is by far the largest and most liquid gold ETF. GLD has the greatest dollar volume of the seven ETFs traded in the U.S. and the lowest bid-ask spread. The average bid-ask spread of GLD is .01%, or one basis point. The next closest competitor is seven times as expensive as GLD.
The problem with GLD and the reason we have moved away from the ETF is the expense ratio. GLD charges investors a 0.40% expense ratio—more than double some of the low-cost options now available.
For investors with a multi-year time horizon, GLD’s sector-leading liquidity and transaction costs aren’t enough to make up for the high expense ratio.
By example, if an investor plans to buy and hold a gold ETF for three years and is deciding between the SPDR Gold Shares ETF (GLD) and the SPDR Gold MiniShares ETF (GLDM), his average costs over the three-year holding period will be 40.3 basis points for GLD and 20.3 basis points with GLDM: a savings of 20 basis points per year for almost the exact same investment.
SPDR Gold MiniShares ETF Now Best for Investors
SPDR Gold MiniShares ETF (GLDM) has become our favored gold ETF for new money. GLDM has one of the lowest expense ratios among the gold ETFs traded in the U.S., and it has critical mass as well as a competitive bid-ask spread.
To take advantage of the lower expense ratio, we recently swapped GLD for GLDM in all tax-deferred accounts. We still own the SPDR Gold Shares ETF (GLD) in many taxable portfolios, as the position is held at a large gain. With new deposits and in new portfolios we are also now buying GLDM instead of GLD.
Have a good month. As always, please call us at (888) 456-5444 if your financial situation has changed or you have questions about your investment portfolio.
Warm regards,

Matthew A. Young
President and Chief Executive Officer
P.S. Sarah Nassauer reports in The Wall Street Journal that American consumers are showing no signs of being held back by tariffs, as they push Walmart sales to a five-year growth streak. She writes:
American consumers showed no signs of belt-tightening in sales results from Walmart Inc., offering comfort to retailers worried about fallout from the trade war and the health of the global economy as the holiday shopping season nears.
Walmart said its U.S. comparable sales, those from stores and websites operating for at least 12 months, rose 3.2% in the period ended Oct. 25, marking a five-year streak of quarterly sales gains. Its e-commerce sales in the U.S. rose 41% from a year earlier, bolstered by grocery orders.
