How Retired Investors can Invest with Comfort

July 2014 Client Letter

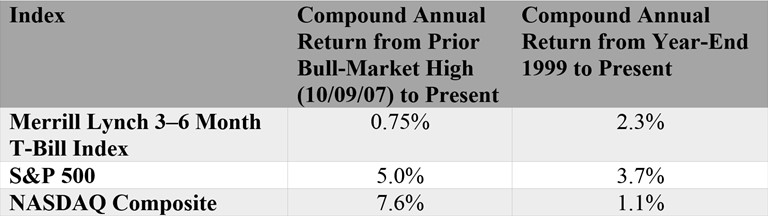
For most retired or soon-to-be-retired investors, significant portfolio losses are unacceptable. Since year-end 1999, the stock market has experienced two peak-to-trough declines of about 50%. During the dot-com bust, the S&P 500 lost 48% of its value, and during the credit crisis, the index cratered 56%.

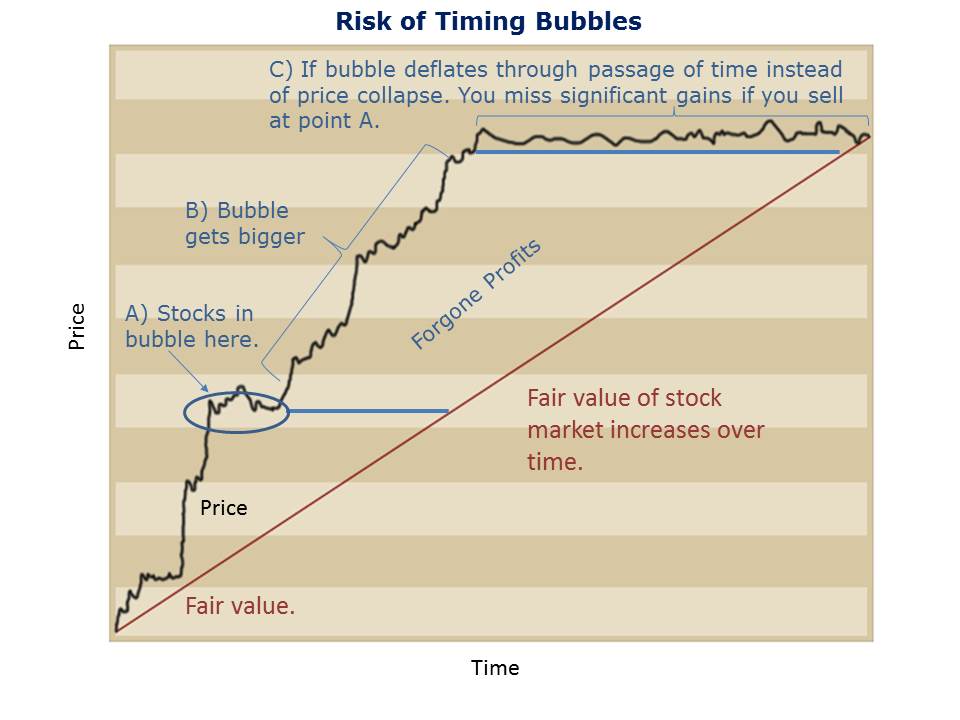
How would you react if your life savings, the source of your livelihood in retirement, was cut in half? Would you be comfortable riding out the storm in hopes of making your money back in future years? Or would you cut your losses? These are not hypothetical scenarios. These were actual returns. And based on the potential bubble valuations in the stock market today, significant market declines could be seen again before the decade is out.

Following the financial crises of 2008, it took six years of 0% interest rates, trillions in monetary bribery, and another bubble for the S&P 500 to recover its losses from the prior bear market. Investors nearing retirement or in retirement don’t have that kind of time, and they shouldn’t count on monetary policy bailing them out again.

Portfolios with a bond component often have reduced volatility compared to an all-stock portfolio offering investors a degree of comfort to ride out bear markets. When crafting a bond portfolio, there are many decisions to consider. These include the weightings in various types of bonds, maturities to favor, sectors to favor, and where to position the bond portfolio on the quality spectrum.

Before crafting a suitable fixed-income portfolio, it is useful to develop an interest rate outlook. The purpose here is not to make a precise forecast, but to assess the risk of possible outcomes. At Richard C. Young & Co., Ltd., we assess risk by answering various questions, including: Where are interest rates today? How is the economy performing? What is the Federal Reserve doing?

Where Are Rates?

Rates are currently low, but low in relation to what? In our view, the most common yardstick for the level of current rates is an estimate of their fair value.

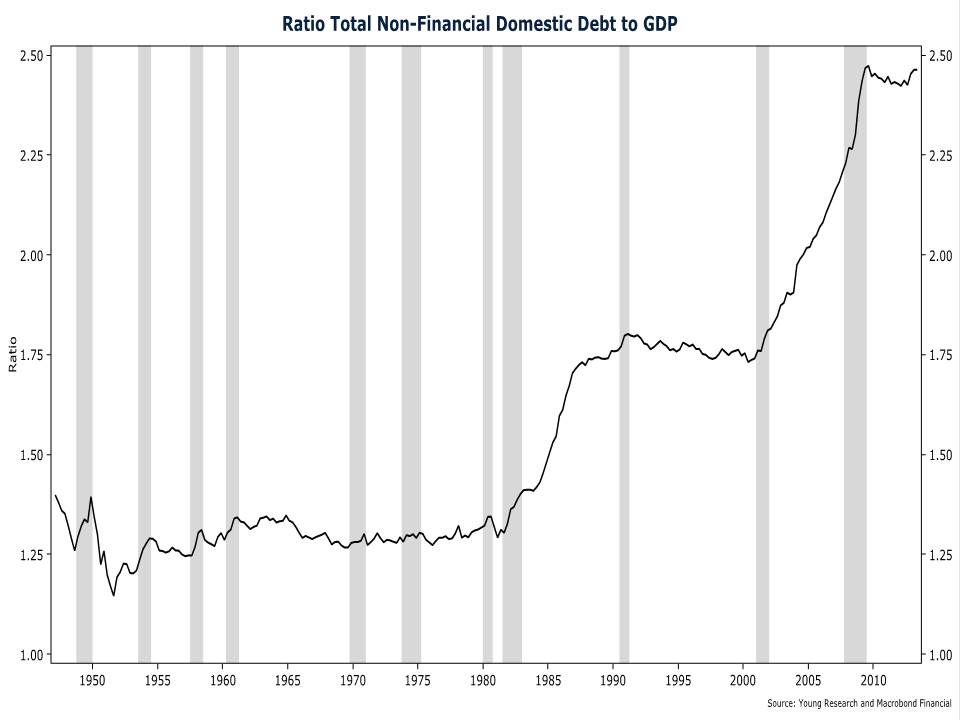
A back-of-the-envelope guide to the fair value in long-term interest rates is the growth rate in nominal GDP (GDP before adjusting for inflation). When long-term interest rates are below-trend nominal GDP growth, one should assume they will rise, and when rates are above-trend GDP growth, one should assume they will fall.

The chart below shows the close association between nominal GDP growth (10-year CAGR) and 10-year interest rates. If you assume that the Fed will prevent measured inflation from rising much above 2%–2.5% and that real GDP is capable of growing at 2%–2.5%, you get a fair value estimate for 10-year Treasury rates of 4%–5%.

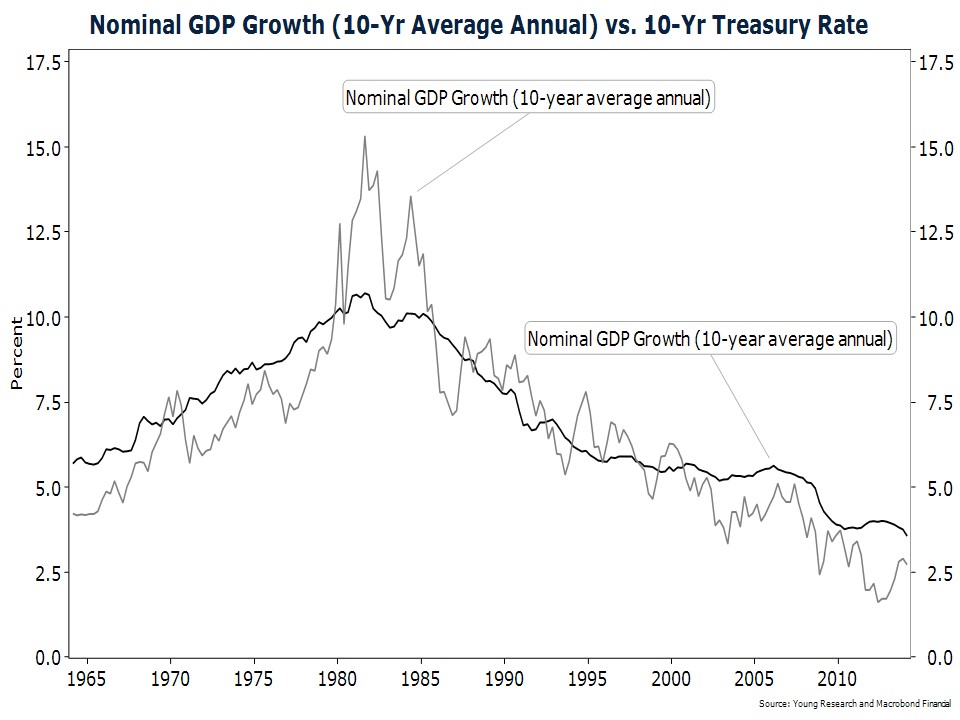
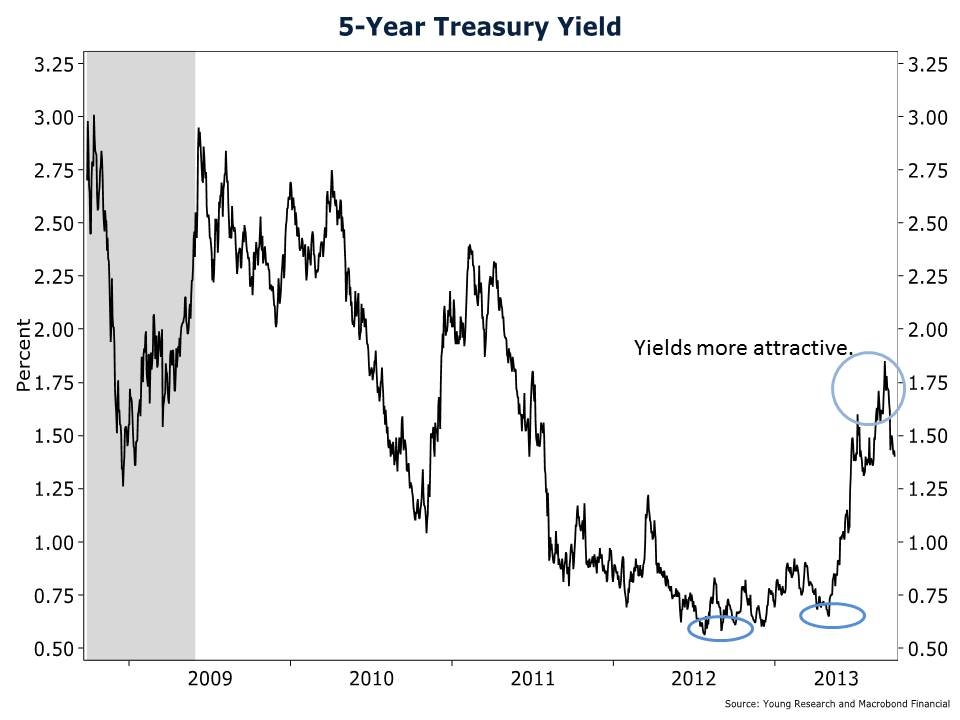
Today, 10-year Treasuries yield 2.6%, or about 1.4%–2.4% below fair value. Ignoring all other factors then, one should assume that, over time, 10-year Treasury rates could drift higher by at least 1.4% to 2.4%.

How Is the Economy Performing?

It is crucial to assess the economy when crafting a fixed-income strategy, because a slowing economy often pressures interest rates lower and a booming economy pressures rates higher.

Notwithstanding the dismal first-quarter GDP number (looks mostly weather-related), several U.S. economic indicators have shown signs of strength.

Labor market indicators look strong. The four-week moving average of jobless claims hit a post-recession low in early June, payroll employment growth is averaging a healthy 200,000 per month, and average manufacturing hours worked is at a more-than-six-decade high.

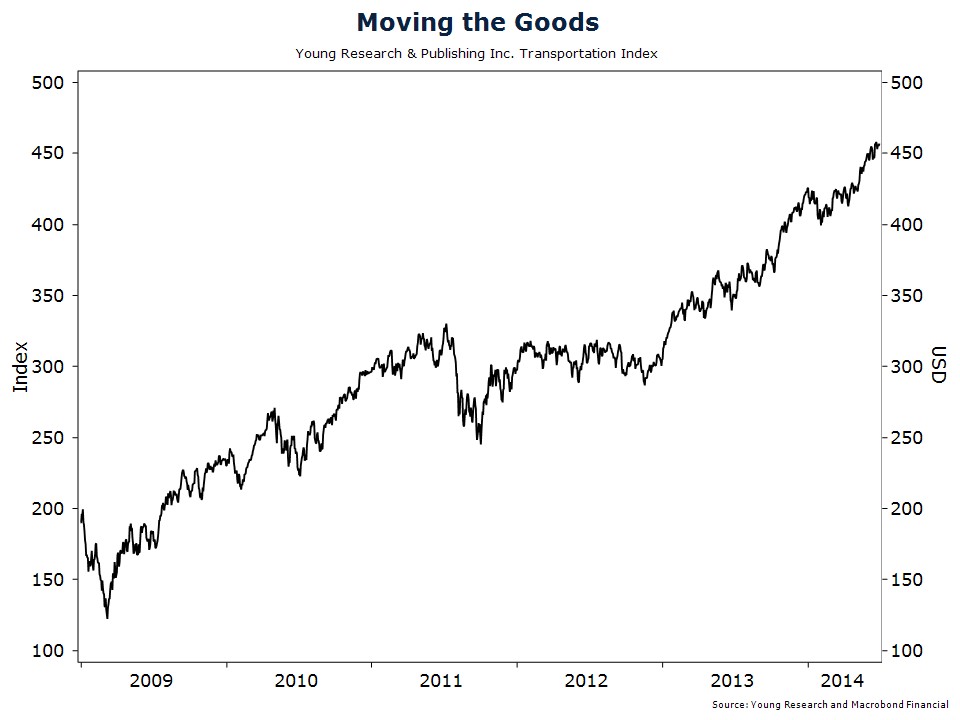
The Young Research Moving the Goods Index is in a solid uptrend. The Moving the Goods Index is a leading indicator of economic activity. Transportation companies are often the first business to experience a pickup in demand since they have to move goods before they can be purchased. If the economy were losing momentum, Young Research’s Moving the Goods Index would most likely be falling.

What Is the Fed Doing?

The Federal funds rate acts as the anchor in the bond market. Long-term interest rates can rise and fall, but they rarely get more than four percentage points above the Federal funds rate. With the Fed holding rates at zero, long-term interest rates are unlikely to get much above 4%.

Our Outlook and Strategy

In our view, long-term interest rates are well below normal levels, economic growth is moderate, and the Fed is signaling rates are likely to rise next year. We assume the risk of higher rates for both short- and long-term maturities far outweighs the risk of a substantial decline in rates.

A short maturity (duration) strategy remains our favored strategy, but we have reached the point in the credit cycle where it is time to pare back credit risk.

Our bond strategy during this prolonged period of 0% interest rates has been to take credit risk as opposed to maturity risk. Credit risk is the risk that a bond issuer will default. Maturity risk is the risk that interest rates will rise before the bond matures, thereby decreasing the value of that bond. We have invested primarily in short-term corporate bonds, with complementary positions in GNMA securities and floating rate notes.

GNMAs

GNMA securities remain one of our favored fixed-income sectors. GNMA securities are mortgage-backed securities (MBSs). They are the only MBSs that are explicitly backed by the full-faith-and-credit pledge of the United States government.

Mortgage-Backed Securities vs. Conventional Bonds

Mortgage-backed securities are not like conventional bonds. Conventional bonds pay interest during the life of the bond and all principal at maturity. Mortgages pay principal and interest every month in varying amounts. Most investors intuitively understand this. When you take out a mortgage, you make a payment each month that includes interest and principal. When you refinance your mortgage, you are making what is called a pre-payment.

Pre-Payment Risk

Because GNMA securities are backed by the U.S. government, they are free of credit risk, but they do carry other risks. The principal risks unique to mortgage-backed securities are pre-payment risk and extension risk. Pre-payment risk is the risk that your principal will be repaid before maturity. Why is that a risk?

Let’s say you invest in a GNMA security and every mortgage backing that security has a 6% rate. Fast-forward one year and assume that mortgage rates have fallen to 4%. Further assume that every mortgage backing the GNMA security is refinanced to lock in that lower 4% rate. As the investor in this GNMA security, the entire balance of your principal is returned to you. You can reinvest in another GNMA security, but the prevailing rate on GNMA securities is now only 4%. Instead of earning 6% on your money, you now earn 4%.

Extension Risk

Extension risk is the opposite of pre-payment risk. When interest rates rise, the rate of pre-payments on GNMA securities slows, which effectively extends the maturity of a GNMA security. You now have a longer maturity bond than you originally invested in just as interest rates are rising. The combination of higher rates and a longer maturity results in a lower price.

In return for taking on pre-payment risk and extension risk, investors in GNMA securities are compensated with yields that are greater than the yields on Treasuries. Today, GNMA securities yield 2.9%.

Corporate Bonds

Corporates have been our bond investment of choice since the last recession ended. During the credit crisis, yields on corporate bonds rose to extraordinary levels. The opportunities in corporate bonds in 2009 and 2010 were likely generational. But yields and spreads have compressed as the economy has recovered.

Priced for Perfection

Short-term investment-grade corporate bond spreads, or the additional compensation investors are paid for taking credit risk, are back to levels last seen during the height of the 2006 and 2007 credit market mania. If short-term interest rates were 4% and spreads were as low as they are today, there still might be a case for buying short corporates. But with low short rates and spreads at cycle lows, there is minimal upside in short-term corporates and enough risk to warrant a shift away from the sector.

Medium-Term Corporate Opportunities

The same is not true of intermediate-term corporates. While spreads on medium-term corporates are below average, they haven’t yet reached prior cycle lows. With the Fed still pinning interest rates at zero and a general shortage of decent income opportunities, we expect spreads on medium-term corporates to grind lower.

New Position in Treasuries

To keep the maturity of overall bond portfolios short and to reduce credit risk, we have begun building a position in 3-year Treasury securities. Yields on 3-year Treasuries have improved over the last 12 months and now offer a partial offset to inflation. The yield on 3-year Treasuries is about 0.95%. Not a great return, but the goal is not to maximize yield. It is to preserve principal for a time when investors are again adequately compensated for bearing risk.

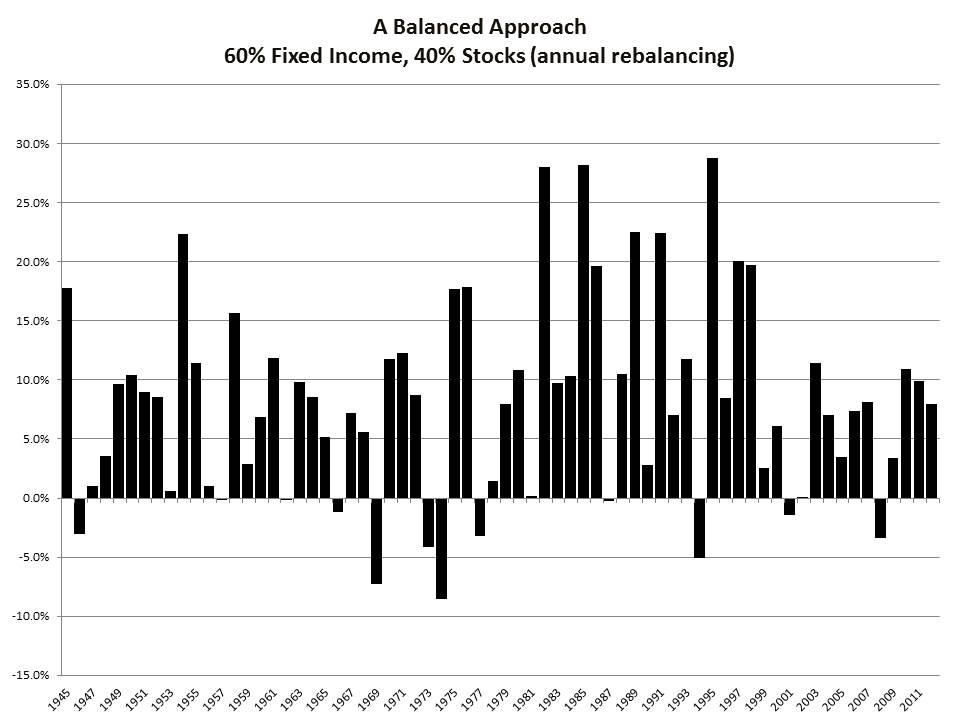
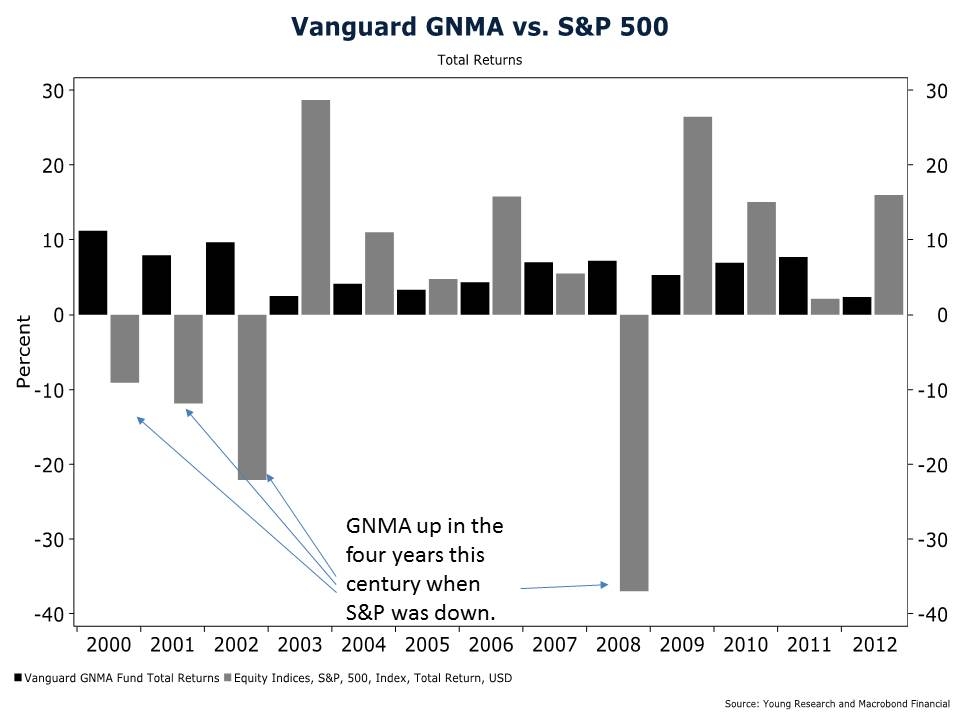
Adding a lower-risk bond component, such as Treasuries, to a portfolio can help smooth out returns over time. For years, we have used the Vanguard Wellesley Income Fund as a quick and easy proxy to measure how a balanced portfolio of stocks and bonds performs in various market environments.

For over 40 years, Wellesley’s portfolio has included a bond component. The Wellesley fund invests about 40% of its assets in blue-chip stocks and 60% in bonds. How has Wellesley weathered the financial market storms of recent years?

During the three-year dot-com bust when the S&P 500 fell by half, the Wellesley fund was up—yes, up—21%. During the last bear market, the S&P 500 lost 56%, but Wellesley’s losses were limited to a more manageable 21%.

On paper, an all-stock portfolio may offer the highest long-term returns. But in practice, the gut-wrenching volatility of an all-stock portfolio leaves investors more vulnerable to making emotionally charged decisions that can sabotage portfolio returns. In our experience, the stability of a bond component helps investors stay on course and ultimately achieve greater investment returns.

Have a good month, and as always, please call us at (888) 456-5444 if your financial situation has changed or if you have questions about your investment portfolio.

Best regards,

Matthew A. Young

President and Chief Executive Officer

P.S. In 2013, the Bank of Japan initiated a money printing campaign that, relative to the size of Japan’s economy, was much larger than Ben Bernanke’s. Japan’s quantitative easing program resulted in a massive depreciation of the yen, but the impact of that program is now waning. The yen has been range-bound for the better part of the last six months.

Bank of Japan Governor Haruhiko Kuroda recently came out and tried to jawbone the yen lower. His actions seem to signal that the BOJ has drawn a line in the sand for the yen around 101 to the dollar. If the exchange rate falls meaningfully below 101, we would anticipate a response from the BOJ that would likely weaken the yen further. The yen could also depreciate if U.S. economic momentum continues to accelerate. A short yen trade appears to offer limited downside with meaningful upside. We took a small position in the ProShares UltraShort Yen Fund (NYSE: YCS).


Dividend Stocks and Long Dry Spells in the Market

April 2014 Client Letter

During most stock-market cycles, usually in the later stages of a bull market, investor behavior can take a speculative turn. Caution is thrown to the wind as consensus builds that the market has nowhere to go but up. Investments considered safe fall out of favor, carefully developed asset-allocation plans are abandoned, and risky investments become fashionable.

These periods can lead to emotionally charged investment decisions with the potential to wreak havoc on investment portfolios. Based on anecdotal evidence we now observe (some of which we shared with you in recent letters), there are signals that investor sentiment has entered this speculative phase. Many investors today seem to worry more about generating the highest possible return (irrespective of risk) and less about crafting a suitable investment portfolio based on desired investment objectives.

Five years into this bull market, it is understandable that investors might wonder whether potential gains have been missed. With hindsight being 20-20, one could assume the only possible outcome was the one realized—a bull market. But events could have turned out much differently. During the bear-market lows in 2009, the risk of outright depression appeared greater than it had been in most investors’ lifetimes.

An important consideration when reflecting on the bull market is time periods. The media and Wall Street are enthusiastic about returns for the last five years but often exclude 2008 and the first two months of 2009 from their performance figures. Most of us are invested throughout up and down cycles.  Excluding either bear or bull markets will not accurately reflect the success or failure of an investment portfolio.

The major stock-market averages have made substantial gains from their 2009 lows. However, measured more comprehensively over a full market cycle, returns have been rather disappointing.

How disappointing? Let’s look at the NASDAQ as an example. Of the three major U.S. market averages, the NASDAQ Composite Index has been the best-performing index during this bull market. That makes it an easy target to pick on.

The NASDAQ is up an impressive 240% (27% compounded annually) since its March 2009 lows. Investors trying to make up for lost returns by chasing performance in NASDAQ stocks are likely hoping for similar future returns. What these investors may not appreciate is that when measured from the prior bull-market high in October of 2007, the NASDAQ is up a much more modest 7.6% annually. Not terrible, but not the shoot-the-lights-out returns many are counting on, either.

Now consider this surprising figure: since year-end 1999, the NASDAQ is up only 1.1% per year. That is nearly two full cycles and most of a retirement for many investors. Risk-free T-bills earned more than NASDAQ stocks over the same time period.

You may be thinking the NASDAQ isn’t a representative example because it was at the epicenter of the dot-com bubble, and fell much more than other major market averages during the bust. This is true, but a similar pattern emerges when evaluating the performance of the broader S&P 500. As shown below, from the October 2007 prior bull-market high, the S&P 500 has generated a total return of only about 5% per year. When measured from year-end 1999, the index generated a return of 3.7% per year. That beat T-bills, but not by much, and with significantly more risk.

The disappointing returns of the NASDAQ and the S&P since year-end 1999 are a sobering reminder that stock prices can remain depressed for agonizingly long periods. In our view, a solution to these long dry spells is to give dividend-paying stocks a leading role in equity portfolios. Dividends are a vital component of long-term investment returns. Over short time frames and during long bull markets, dividends may seem trivial, but as you can see in the chart below, over the last seven decades, dividends have accounted for an average of 54% of each decade’s stock-market returns. As always, past performance is no guarantee of future results.

When measured over multi-decade periods, the scales become even more tilted in favor of dividends. Over the last 40 years, dividends and the reinvestment of dividends have accounted for over 70% of the S&P 500’s total return.

A Steady Stream of Income

Chart 2 compares the capital-gains component of returns to the dividend component of returns for high-yielding stocks. Note the stability of dividend returns compared to capital gains.

Reduce Risk with Dividend Stocks

What’s more, dividends help reduce portfolio volatility. Chart 3 shows that high-yielding stocks have been less volatile than non-dividend-paying stocks. And high-yielders have held up better in down markets than both non-dividend-payers and broad-based stock-market indices such as the S&P 500.

Dividends as a Quality Filter

A dividend strategy can also help you avoid many of the pitfalls that wreak havoc on even the most seasoned investors’ portfolios. Dividend-paying companies are often more durable businesses than non-dividend-payers. Payers are also more likely to operate in industries with higher barriers to entry and have stronger balance sheets than non-dividend-payers. And because there is a stigma associated with cutting dividend payments, the consistent payment of dividends may be seen as a signal of management confidence in the future prospects of a company. This is especially true of companies that raise dividends. Management teams rarely commit to higher dividend payments unless they are confident the dividends can be maintained through thick and thin.

Cold, hard cash in the form of quarterly dividend payments can also help investors avoid some of the most deplorable examples of corporate fraud. Who can forget the accounting frauds of Enron, WorldCom, and Tyco that decimated many retirement portfolios? Not a single company in the group paid a meaningful dividend. Companies can manipulate and fake earnings by using creative accounting techniques, but regular dividend payments can’t be faked.

A Free Lunch?

What is the trade-off for consistent income, lower risk, and higher quality? How do higher returns sound? Although one might expect a high-quality, low-risk strategy to generate lower long-run returns, the opposite has been true. Over the long run, high-yielding stocks have outperformed the broader market. Not every year, of course, but over time, the highest-yielding quintile (top 20%) of stocks beat the market by a substantial margin (Chart 4). Again that is no guarantee of future results.

Dividend stocks, and especially high-yield dividend stocks, can have appeal for all types of investors. A continuous stream of dividends can be used for living expenses (ideal for retirees) or reinvested in down markets at a lower share price, resulting in higher future-dividend payments (ideal for long-term wealth accumulation). A steady stream of cash also makes it easier for investors to avoid the emotionally charged decisions that tend to sabotage portfolios in down markets.

Have a good month, and as always, please call us at (888) 456-5444 if your financial situation has changed or if you have questions about your investment portfolio.


Best regards,

Matthew A. Young
President and Chief Executive Officer

P.S. Several months ago, I briefly profiled the strong 2013 performance for consumer discretionary stocks— a sector we tend to avoid. In a rather quick about-face, the S&P 500 Consumer Discretionary index—which includes autos, media, retail, and hotels—is down nearly 5% in 2014 and is the year’s worst-performing sector. Stocks contributing to steep losses include Best Buy, Amazon, and GameStop, down 38%, 23%, and 20%, respectively.

P.P.S. The best-performing sector for 2014—and by a wide margin—is utilities. YTD, the utilities sector is up 13%. We favor utilities companies for several reasons. A main reason is that the industry in which they operate has high barriers to entry. I would not characterize many of the companies in the discretionary sector as businesses with high barriers to entry. Utility companies also tend to pay a relatively high dividend yield, often raised annually. Annual dividend increases are one way to combat the nasty effect of inflation.

P.P.P.S. Despite assurances from the Bureau of Labor Statistics that inflation is under control, many Americans will notice significant price increases this grilling season. U.S. beef prices are at all-time highs. USDA choice-grade beef reached a record $5.28 a pound in February, up from $4.91 one year ago. The same grade of beef cost $3.97 in 2008.


Signs of Speculation

March 2014 Client Letter

Is rampant speculation bubbling under the surface of today’s stock market? In February, Facebook announced its purchase of WhatsApp, a company with $20 million in sales that was nonexistent before 2009, for $19 billion in cash and stock. WhatsApp is a mobile messaging platform allowing users to send text messages without having to pay for SMS. If you own an iPhone, Apple’s iMessage program basically does the same thing. Seems like a large sum of money for a company whose product appears to be easily replicated.

Then in March, Facebook decided to buy virtual-reality firm Oculus for $2 billion. Oculus is a 20-month-old maker of virtual-reality goggles. Oculus doesn’t yet sell a product that is available to consumers. To date, the firm’s only revenue comes from a prototype sold to developers.

According to The Wall Street Journal, Mark Zuckerberg first met with the Oculus CEO in November. Zuckerberg said that putting on the virtual-reality glasses was “different from anything I’ve experienced in my life.” Maybe Zuckerberg is a visionary, but a $2-billion valuation for what is basically a start-up in a business outside of Facebook’s wheelhouse appears more like a gamble than an investment.

The hype and optimism aren’t limited to Facebook, though. Wall Street is taking advantage of the speculative mood. The investment banks are bringing public anything and everything they can unload on investors. At the current rate, the number of IPOs in 2014 is set to surpass last year’s level by at least 40%.

King Digital Entertainment, maker of the popular Candy Crush Saga game, recently came public at a $7-billion valuation. That’s about equal to the market value of Plum Creek Timber, the largest private landowner in the United States and $2.5 billion more than the market cap of Aqua America—the second largest publicly traded water utility in the nation. Sound fair to you? Based on current earnings and sales, one might argue that King Digital isn’t overpriced. But to date, the company is a one-hit wonder. The bankers underwriting the stock know it, institutional investors know it, and many retail investors know it. So then how does a one-hit wonder successfully execute an IPO at a $7-billion valuation?

We believe it’s greed. The hope of speculative gains has turned the IPO market red-hot. The chart below sourced from Renaissance Capital shows a 22% average one-day pop in IPOs in 2014—the highest in over a decade. Investors participating in the King Digital IPO were hoping to make a quick buck as they did with many of the other IPOs that came public in 2014.

There is also anecdotal evidence of Wall Street research analysts returning to dubious practices that were a staple of the dot-com bubble. Tesla Motors shares soared in February after Adam Jonas, the Morgan Stanley analyst covering the company, upgraded the stock. Mr. Jonas decided that Tesla wasn’t worth the $153 per share he had estimated only a few weeks prior, but instead priced the stock at $320 per share—a more than 100% revaluation.

We don’t follow Tesla shares closely, but the doubling of a price target grabs attention.

Apparently, Mr. Jonas decided to double the price target of Tesla because he saw profound promise in the company’s yet-to-be-announced plans for a battery factory. This pie-in-the-sky analysis implies that Mr. Jonas simply fell prey to a bubble-induced euphoria that caused a lapse in judgment. No harm, no foul, right?

Not a chance. This is Wall Street we are talking about.

Two days after the upgrade, The Wall Street Journal reported that Tesla was issuing $1.6 billion in convertible bonds to help finance the battery factory. Can you take a wild guess at who underwrote the bonds? It was none other than Mr. Jonas’s employer, Morgan Stanley.

If you thought these potential conflicts of interest were a thing of the past, think again. Wall Street is in the business of distributing securities. And brokerage clients are a convenient dumping ground for newly issued securities.

Another sign of the speculative fervor in the market is the level of margin debt. Emboldened by a prolonged period of 0% interest rates and an especially slow wind-down of the Federal Reserve’s bond-buying program, investors are piling on the leverage. Our chart shows margin debt has reached a record high.

Margin may sound like a good idea when prices go up, but on the way down, margin can be devastating. If you buy a stock with 50% margin and the shares drop 20%, you don’t lose 20%— you lose 40%! Even if you take a more conservative approach to margin and buy funds instead of an individual stock, margin could sting. In the 2008 calendar year, the S&P 500 fell by 37%. A 50% margined investment in the S&P 500 in 2008 would have lost you 74%—assuming, of course, you were able to meet your broker’s margin calls.

To craft an investment portfolio to help reduce steep volatility, investors must be willing to forgo potentially substantial upside rewards to balance against a downside wipeout. If you are retired or saving for retirement in the not-too-distant future, you can easily get a knot in your stomach when you look at the basic math of downside portfolio protection.

By example, if you lost 74% on your margined S&P 500 position, you would have to make 280% on the next trip to the plate just to get back to even. Even if you don’t use leverage, the S&P 500 fell by 37% in 2008—a loss that requires a 60% gain to get back to even. And that’s without considering the negative drag of expenses, potential taxes on any gains, and overcoming income pulled from the portfolio to satisfy distribution needs. Things can get real ugly—and fast.

To help reduce substantial losses all too common in the aftermath of a speculative bubble, we advise a strategy that can provide comfort and confidence. Focus on personal goals and objectives and ignore the pundits and promoters trying to seduce you with promises of speculative gains.

Take a realistic view of the gains the market is capable of delivering in the current environment. Stocks have come a long way over the last five years. Investors still forecasting 10% returns for the foreseeable future are likely too optimistic. Why? For starters, dividend yields are a fraction of what they used to be. The historical average dividend of the S&P 500—before the modern bubble era—was 4%. Today, the S&P 500 yields less than 2%. Valuations are also much richer than they were in decades past. The S&P 500 trades at a cyclically adjusted price-earnings ratio (CAPE) of 25X today. The historical average 10-year return of the S&P 500 when the starting CAPE is 21X–25X is about 4%.

Bonds are also likely to deliver less than they have historically. The secular decline in interest rates that began in the early 1980s and brought the 10-year Treasury yield from over 15% to under 2% is finished. Yields are now lower, and the tailwind from falling interest rates that added to bond returns is gone.

This doesn’t mean bonds will suffer colossal losses over the medium term. Measured inflation looks to be contained for now, and we are late in the business cycle. Interest rates may not rise as much as they typically would when the Fed begins to tighten policy, simply because the next recession is nearer than it usually is at this stage of the cycle. Investors who limit the duration of their portfolios are unlikely to suffer major losses. A bond portfolio with a duration of 4 would only drop by 4% if interest rates instantly increased by 1%.

As for investment strategy, it’s important to recognize that the uncertainty of today’s environment is amplified by the Fed running a full-tilt monetary stimulus program. Stock prices could continue to rise before the current cycle is complete. And there is no guarantee that today’s market will collapse in the same manner as in the past. It is possible (though not probable) that the market will correct by drifting sideways for an extended period of time, during which company fundamentals will catch up to prices.

Over the long haul, a portfolio balanced across asset classes is generally the best idea for conservative retired and soon-to-be-retired investors. That’s not because balanced portfolios will necessarily post the highest long-term returns—over most long time periods, stocks have posted the highest returns. Rather, balanced portfolios tend to work best because investors find it easier to ride out market volatility with this type of portfolio. By diversifying, investors help themselves to avoid the fear and regret that can emerge when the financial markets take a dive.

Have a good month, and as always, please call us at (888) 456-5444 if your financial situation has changed or if you have questions about your investment portfolio.

Best regards,

Matthew A. Young

President and Chief Executive Officer

P.S. Where possible, we look to buy securities that are out of favor. In today’s environment, that has become difficult to do. But there are still some good candidates—most businesses related to precious metals are viewed as ghastly and grizzly by institutions and individuals alike. Precious metals shares have taken a savage beating, both on an absolute basis and relative to gold. The Market Vectors Gold Miners index is down over 60% from its highs in 2011 and almost 50% since year-end 2012. You would be hard pressed to find a sector in the market that is more out of favor.

P.P.S. We have been purchasing shares of various gold and silver mining companies. The initial positions are small, but we plan to increase our allocation to precious metals miners over time. With metals miners deeply out of favor, we view the sector as one spot in the market offering value to long-term investors. Some miners are trading near levels they were at when the metal they produce was 30% cheaper than today.

P.P.P.S. We recently updated both Part 2A and Part 2B of our Form ADV as part of our annual filing with the SEC. This document provides information about the qualifications and business practices of Richard C. Young & Co., Ltd. If you would like a free copy of the updated document, please contact us at (401) 849-2137 or email Christopher Stack at cstack@younginvestments.com. There have been no material changes since the document was last updated on March 26, 2013.


Which Stocks Have High Barriers to Entry?

February 2014 Client Letter

On the back of over $1 trillion of virtual money-printing by the Federal Reserve, 2013 was a barnburner of a year for most U.S. stocks. Leading the way in the S&P 500 index was the consumer discretionary sector, with a 43% gain. Portfolios not packed with companies including Netflix, Best Buy, GameStop, TripAdvisor, and Priceline.com (the top-performing discretionary stocks) probably did not keep pace with the broader market.

Consumer discretionary companies are ones we tend to avoid. The fact the sector had a stellar year does not change our view. Why? At Richard C. Young & Co., Ltd. we favor companies operating in high-barrier-to-entry businesses. We favor companies with durable competitive advantages and ones owning vast reserves of essential natural resources. We favor companies that have built solid brands over decades, giving them pricing power and the ability to withstand threats from competition. Above all, we favor dividend-paying stocks with a history of annual dividend increases.

Go back and read the five stocks listed in the first paragraph and ponder this question. If the stock market closed tomorrow and didn’t reopen for another five years, would you be comfortable holding stocks from any one of those companies? There isn’t a blue-chip in the bunch. I can’t even tell you if Netflix, Best Buy, GameStop, or TripAdvisor will be around in five years.

Among the legion of stocks comprising the consumer discretionary sector, few meet our criteria of paying meaningful dividends and operating in high-barrier-to-entry industries. High-dividend, high-barrier-to-entry businesses tend to be concentrated in the defensive sectors of the market. To help you better discern the types of characteristics we look for in an investment, I’ve profiled several of our common stock holdings. 

Norfolk Southern

Norfolk Southern (NSC) is a company I am confident will still be a thriving business in five years. When you buy shares of Norfolk Southern, you are making an investment in a durable business operating in a high-barrier-to-entry industry.

The short-term case for Norfolk Southern is the resurgence in housing materials, strength in automotive transport, and the continued use of railroads to move the massive amount of oil coming out of North Dakota and Canada, which remain underserved by pipeline.

The long-term case for Norfolk Southern is that its 20,000 miles of track, stellar safety record, and superb efficiency make Norfolk Southern one of the continent’s best transportation companies. NSC serves 43 sea, lake, and river ports. NSC offers interchange service with all the other major railroads in North America, giving its customers unprecedented access to the continent. NSC has more short-line partners than any other Class I railroad, giving it access to an additional 41,000 miles of track in the Eastern U.S. And, to service fast-growing intermodal transport demands, NSC runs 51 intermodal terminals in the U.S. and Canada.

There are only a few superior rail transportation companies in North America, and chances are there won’t be any more. New competition is almost unheard of. The rights of way of North America’s railroads were established long ago in a different time unlikely to be duplicated. Norfolk Southern has paid a dividend every year since 1901.

Orkla

Founded over 350 years ago, Orkla is one of Norway’s oldest business conglomerates. Today Orkla is in the process of shedding its conglomerate structure in favor of a more focused strategy. Orkla’s new strategy is to become a pure branded-consumer-products company with a concentration in the Nordics. The new strategy has appeal. With a portfolio of well-known brands holding primarily No. 1 and No. 2 positions in the Nordic region, Orkla is already one of the region’s premier branded-consumer-goods companies. A more intense focus on branded consumer goods should help strengthen the business and improve profitability.

As Orkla continues to transition from a diversified conglomerate to a branded-consumer-goods company that looks more like a regional version of P&G or Clorox, we see opportunity for meaningful improvement in the stock’s valuation. We also see opportunity for significant profit margin expansion within the consumer goods division. If Orkla’s management is able to achieve margins similar to those of P&G and Unilever, earnings could rise by 70%. Orkla shares yield over 5%.

Pembina

Pembina is one of Canada’s largest pipeline companies. Pembina transports about half of Alberta’s conventional crude oil and 30% of western Canada’s natural gas liquids. Pembina’s business units include conventional pipelines, oil sands and heavy oil, gas services, and midstream.

At Richard C. Young & Co., Ltd., pipelines have long been one of our favored businesses. The pipeline business is simple, the barriers to entry are high, the cash flows are stable and often inflation-adjusted, and the maintenance and operating expenses are minimal.

Pembina shares yield 4.5% and offer the prospect of future dividend increases. Pembina shares also have appeal as a pipeline investment in tax-deferred accounts. Most of the pure-play U.S. pipeline companies are structured as master limited partnerships (MLPs). MLPs shouldn’t be owned in tax-deferred accounts. Since Pembina is a Canadian C-corp, the shares should be able to be purchased in tax-deferred accounts without incurring adverse tax consequences.

Mosaic

Did you know that according to The Fertilizer Institute, fertilizers are responsible for between 40% and 60% of the world’s food supply? Without a steady supply of phosphorus, a good portion of the world would face the threat of starvation.

Mosaic is the world’s number-one producer of phosphate and the fourth-largest producer of potash in the world. Mosaic’s phosphate business accounts for about 10% of global phosphate production. Phosphorous is an essential nutrient that is required for all life. There are no substitutes for phosphorus. It is most widely used in agriculture.

Unfortunately, almost three-quarters of the world’s identified phosphorus reserves lay in a disputed territory under the Bou Craa mine in the Western Sahara, a region rife with political unrest and terrorism. What is most troubling about the Bou Craa mine is that the phosphate rock produced at the mine must travel down the world’s longest conveyor belt (93 miles in total) to the port of El Ayoun before it can be shipped around the world to make fertilizer. The belt is vulnerable to attack and has been attacked in the past by rebels seeking to force Morocco’s monarchy from the territory. A major disruption in the supply of phosphate rock coming out of Bou Craa would likely cause phosphate prices to soar. Mosaic would be a big beneficiary in such a scenario, as it sources phosphate rock from its own mines in Florida.

Like phosphate, there are no substitutes for potassium as an essential plant nutrient and a vital nutritional requirement for animals and humans. Potassium is critical for plant growth. Mosaic’s potash business—potash is the source of potassium—accounts for about 30% of the company’s revenues and profits.

The potash industry has historically been controlled by an oligopoly that successfully kept prices high by limiting production. But last July the oligopoly pricing structure started to fall apart as one of the world’s largest potash producers, Uralkali, ended a production agreement with Belarusian Potash. Potash prices and the stocks of potash producers fell sharply on the news. But with a new CEO recently taking over at Uralkali, the prospects for a new agreement and in turn higher potash prices look promising. Mosaic would be a winner here. 

Mosaic may also be a winner as a result of a potential merger. BHP Billiton, one of the world’s largest mining companies, is interested in the potash business. BHP made an offer for Potash Corp in 2010 that was blocked by Canadian authorities. BHP has since decided to build its own potash mines, but the high cost of building a new potash mine leaves little profit opportunity for BHP. Instead of moving forward with its mine-building strategy, BHP may instead decide to buy its way into the potash business. As one of the world’s largest potash producers, Mosaic would be on a short list of candidates.

Southern Company

Of Fortune Magazine’s “Most Admired Electric and Gas Utilities,” Southern Company has scored first place in financial soundness each of the last four years. Southern’s service area stretches across the states of Georgia, Alabama, Mississippi, and Florida, where it serves 4.4 million residents. Southern Co. owns 46,000 megawatts of electrical generating capacity. Alongside Southern’s power business, it is active in telecommunications and wireless communications.

Southern Company’s board of directors has chosen to raise the company’s dividend in each of the last 12 years. This steady string of dividend increases has allowed Southern to maintain a dividend yield of over 4.9%, even while the price of the company’s stock has increased by more than 100% over the same time period.

Quantitative Easing World

If the Federal Reserve continues to pump unneeded liquidity into the U.S. financial system, a continuation of the speculation-driven rally that characterized much of the last two years may persist in 2014. The Fed has announced that it will taper its bond purchases, but only at a snail’s pace and only as long as the economy maintains an upward trajectory.

Despite evidence that quantitative easing (QE) has done little to help the real economy, the Fed remains sanguine about the costs and risks of its policies. As outlined regularly in these letters, we view the costs and risks of QE as unacceptably high. As just one example, in 2012 and 2013 the U.S. stock market rose over 45%, but corporate profits increased only 11%. The Fed’s extended period of ultra-loose monetary policy has fueled a speculative reach for return in the stock market that has markedly increased valuation risk.

The ratio of stock prices to revenues is now about 60% above historic norms. Over the long run, corporate revenues track the 5% growth rate of nominal gross domestic product. If an investor were to buy the S&P 500 index today under the assumption that corporate revenues would compound at 5% for the next five years, but that valuations would revert to their historic norm, he would be facing a loss on the order of 20% (not counting dividends). Of course, valuations could remain elevated for an extended period of time, especially in today’s QE world, but the historic record argues against such an outcome.

To combat the valuation risk in today’s stock market we continue to favor a balanced portfolio featuring individual corporate bonds, foreign currencies and precious metals, and an equity component focused on high-dividend, high-barrier-to-entry businesses.

Have a good month, and as always, please call us at (888) 456-5444 if your financial situation has changed or if you have questions about your investment portfolio.

Sincerely,

Matthew A. Young

President and Chief Executive Officer

P.S. “There is a secular change taking place in that baby boomers who are retiring know they still need to own equities for capital appreciation…. Dividend-paying stocks become very important not just because they generate income but because most are defensive plays, such as consumer staples, utilities and telecommunications, so there’s less risk to earnings in an economic slowdown.” Josh Peters, equities strategist for Morningstar®.

P.P.S. A recent Vanguard study shows that of the 1,540 actively managed U.S. domestic equity funds available to investors at the start of 1998, the number of funds that both survived and beat the market was only 18%. And of that small group, 97% lagged their benchmark in at least five of the fifteen calendar years tracked. The message here, of course, is that investors must expect to endure long periods of out-of-favor, poor relative performance. Staying the course is the winning, if difficult, hand. Patience is the name of the game.

P.P.P.S. According to Steve Forbes, stocks fell at the beginning of the year “because of brewing troubles in emerging markets. And those troubles are the result of economic ignorance: too many central bankers don’t know how to defend their currencies, which are under attack. If they don’t get their act together, we could have another big financial crisis like that which hit in Asia in 1997–98. The danger is that the Fed, the IMF, the European Central Bank, the Bank of England, and the Bank of Japan are just as clueless as their developing country counterparts on how to quickly put a stop to a potentially devastating currency crisis that will hit banks hard everywhere.”                  


Black Swans

December 2013 Client Letter

Lehman Brothers was founded in 1850, became a member of the New York Stock Exchange in 1887 and in 1906 teamed with Goldman, Sachs & Co. to bring Sears, Roebuck and Company to market. Over the next 20 years, Lehman and Goldman paired up to underwrite F.W. Woolworth Company, R.H. Macy & Company, The Studebaker Corporation, B.F. Goodrich Co. and Endicott Johnson Corporation, among many others.

A little over five years ago, Lehman’s fortunes drastically changed. On Monday, September 15, 2008, the world watched in disbelief as Lehman employees removed files, company items and other belongings from its world headquarters on Seventh Avenue. Earlier that morning, the 158-year-old investment bank announced it would file for Chapter 11 bankruptcy.

The Lehman crises could be described as a black swan event. Nassim Nicholas Taleb popularized the term black swan in his 2007 best-selling book The Black Swan. Taleb regards many major scientific discoveries, historical events and artistic achievements as black swans. These events include the rise of the Internet, the personal computer, World War I and September 11.

According to Taleb, a black swan event has three attributes. First, the event is an outlier, as it lies outside the realm of regular expectation. Second, the event has a major impact. And third, in spite of the outlier status, the event is rationalized by hindsight as if it could have been expected.

The Lessons of the Lehman Collapse

This past September The Wall Street Journal’s Brett Arends reflected on the 2008 financial crisis and how much we really learned from the event. Noting that many people lost their home, their savings or their jobs, Arends wondered if investors are any wiser or even better prepared than before the crisis.

Here are five lessons that, according to Arends, could be takeaways from the Wall Street collapse and financial crisis kicked off by the Lehman black swan event.

  1. Ignore Wall Street’s optimistic forecasts. According to the conventional wisdom on Wall Street in 2006, house prices would just keep going up. The reason: They always had. “We looked at the data since 1945,” said Treasury Secretary Hank Paulson later, “and we concluded house prices don’t go down. “Conventional wisdom also said then that stocks would produce average returns of about 9% a year and bonds about 5%. The reason: Those were the historical averages in Wall Street’s spreadsheets. The problem didn’t lie with the data, but the reasoning. You cannot reliably extrapolate a guide to the future from a limited set of past experiences. Yet today too many households are still basing their financial planning and retirement hopes on the same flawed forecasts.
  2. The people in charge don’t know much more than you. The International Monetary Fund was taken completely by surprise by the financial crisis. So were most of Wall Street and most economists. The Federal Reserve thought the subprime-mortgage blowup would be “contained.” Few economists predicted the recession before it was nearly over.
  3. Debt is dangerous. The three decades leading up to 2008 saw the entire U.S. go on a debt binge. That included households, companies and the government. Conventional wisdom on Wall Street viewed these debts as largely benign. Household borrowing was OK, the experts said. It allowed people to use their future income today to purchase better homes and consume. Today, many consumers are borrowing freely again. Good luck if they lose their jobs, or the economy turns down again. Asset prices and incomes can fall, but the debt-service payments march on regardless.
  4. We are more risk-averse than we think. When the stock market collapses, people sell. Seeing your net worth halved is very different in practice than in theory. From September 2008 through March 2009, as the Dow Jones Industrial Average plummeted from 11700 to 6500, mutual-fund investors withdrew more than $200 billion from stocks—at precisely the wrong time. Today, as the stock market hits new highs, Mom and Pop are feeling complacent again and are piling back into stocks.
  5. Cash isn’t trash. When times are good, Wall Street treats cash as…well, as a four-letter word. Conventional wisdom considers it “dead money,” a poor investment earning low returns. Investors prefer to swap it into more exciting assets—to “put that money to work,” as they like to say. They are assuming a liquidity crisis cannot or won’t happen again. Yet when it does, as in 2008, those who have wisely held cash in reserve hold all the cards.

A concerning element of today’s stock market, which has substantially appreciated since March 2009, is that the structural problems from the last financial crisis were never corrected. Monetary and fiscal authorities prevented a necessary deleveraging and market clearing.

Our debt-to-GDP chart shows the U.S. economy remains overly indebted. Non-financial debt to GDP is higher today than it was at the start of the last credit crisis. Deleveraging that occurred in the household sector was replaced by borrowing in the public sector. And much of the household deleveraging occurred as a result of mortgage defaults. Consumer household debt has already returned to the pre-crisis highs of 2007. (The shaded areas indicate recessions.)

If this stock market inflates further and eventually bursts, the financial and economic dislocation could be significant. The Fed is already running a full-tilt monetary stimulus. And the capacity for fiscal authorities to pump up demand in a future downturn is more limited than in 2008.

As for investment strategy, it’s important to recognize the uncertainty in today’s markets. Stock prices could go higher over a longer period of time than many expect before the cycle is complete. And there is no guarantee today’s market will collapse in the same manner as in the past. It is possible (though not probable) the market will correct by drifting sideways for an extended period of time, during which company fundamentals catch up to prices. If you were to liquidate your entire equity portfolio today you may miss out on stock market gains. Our diagram below illustrates this point.

Diversification is also critical to help protect against high volatility. An important component of diversification is to include portfolio counterbalancers. Ideally, a counterbalanced portfolio would have some assets rise in price when the stock market falls. Historically, bonds have been the most reliable counterweight to stocks. But because the Federal Reserve is pinning short-term interest rates at zero, the counterbalancing power of short and intermediate-term bonds is impaired. Short bonds may continue to offer the benefit of stability in a bear market, but they are unlikely to offset stock market losses as is typical during down years in the stock market.

Gold and precious metals also act as counterbalancers. The year 2013 will be the first down year for gold in 12 years. If the stock market continues to inflate, it is possible for gold and other precious metals to fall further in price. However, if the stock market collapses and the economy enters a recession before the labor market reaches the Fed’s hoped-for employment target, the Fed may shoot for a higher explicit-inflation target. Support for a higher inflation target is already building among the more liberal Keynesians, many of whom dominate policymaking circles. If the Fed raises its inflation target, look for gold and precious metals prices to soar.

To help reduce volatility within equities, we favor dividend-paying stocks. We prefer to take returns up front in the form of high dividend payments today and the prospect of higher dividend payments tomorrow. Should the stock market enter a period of low growth, portfolios with a high dividend-yield will at least provide a modest income return.

Dividend payers also tend to hold up better than non-dividend-payers when markets correct. In up markets, dividend-paying stocks have historically kept pace with the market; but in down markets, dividend payers have fallen less than stocks paying no dividends at all.

Over the long haul, a portfolio balanced across asset classes is generally the best idea for conservative retired and soon-to-be-retired investors. That’s not because balanced portfolios will necessarily post the highest long-term returns—over most long time-periods, stocks have posted the highest returns. Rather, balanced portfolios tend to work best because investors find it easier to ride out market volatility with this type of portfolio. By diversifying, investors help themselves to avoid the fear and regret that can emerge when one part of the financial markets takes a dive.

Have a good month and a great new year. As always, please call us at (888) 456-5444 if your financial situation has changed or if you have questions about your investment portfolio.

Best regards,
           

Matthew A. Young

President and Chief Executive Officer

P.S. Monetary scholar Kevin Dowd, while delivering a paper last month at the Cato Institute’s 31st-annual Monetary Conference, concluded: “The modern financial system has not only kicked away most of the constraints against excessive risk-taking, but positively incentivized systemic risk-taking in all manner of highly destructive ways. We have gone from a system that managed itself to one that requires management, but cannot be managed. We have gone from a system that was guarded by market forces operating under the rule of law to one that requires human guardians instead—but we have not solved the underlying problem of how to guard the guardians themselves.”

P.P.S. Stock and bond prices are not the only asset prices that have risen in part due to the Fed’s QE policy. Various real estate markets have also taken off. Across the state from me in Miami, real estate is certainly on the rise. According to The Wall Street Journal, “For several years after the housing bubble burst, a glut of towering condo buildings sat largely empty. Condo values plunged nearly 60% from peak to trough. Now nearly all the once-vacant units are filled up, and demand is outstripping supply. There are 118 condo towers proposed in the Miami area, including 35 under construction. Said Peter Zalewski, principal at Condo Vultures, a real-estate consultancy, “This boom is very reminiscent of where we were a decade ago.”


The Free Money Truck

October 2013 Client Letter

Most investors now realize the powerful influence monetary policy has on U.S. financial markets. And the most important player in the conduct of monetary policy is the chairman of the Federal Reserve.

As we have witnessed, under the Bernanke Fed, an unprecedented amount of money has been electronically created for the purchase of bonds. As the Fed continues to buy bonds, interest rates are kept artificially low. Meanwhile, the extra cash created sloshes around the financial markets, and some is used to buy stocks, bonds, and real estate. In our view, the markets have not risen entirely due to increased economic activity and an improvement in efficiency but as a result of the additional cash in the system.

After President Obama’s first choice for Federal Reserve Chairman was shot down by the left wing of his own party, he appointed Janet Yellen. Ms. Yellen received her Ph.D. from Yale while studying under James Tobin, a pioneer in Keynesian economics. We have expressed concern regarding monetary policy under Ben Bernanke and believe it could get even worse under Ms. Yellen.  She will most likely take a dovish stance on monetary policy, which means the printing presses will keep on trucking.

A Bloomberg article from earlier this year highlighted some of Ms. Yellen’s economic viewpoints. To economists who favor free-market capitalism, it is not a good read. To wit:

In an April 1999 speech at Yale, Yellen argued for activist policies. “Will capitalist economies operate at full employment in the absence of routine intervention? Certainly not,” she said. “Are deviations from full employment a social problem? Obviously.”

As early as 1995, when she was a Fed governor, Yellen was discounting [the] notion of the primacy of the inflation goal, saying both objectives—maximum employment and low and stable inflation—needed to be pursued in a balanced way.

“When the goals conflict and it comes to calling for tough trade-offs, to me, a wise and humane policy is occasionally to let inflation rise even when inflation is running above target,” she said during a debate on inflation-targeting in 1995.

A Yellen Fed is likely to sound and act a lot like the Bernanke Fed, but with a bias toward pumping greater amounts of liquidity into the financial system.

We may have even seen shades of a Yellen Fed at the central bank’s September policy meeting. The Fed was widely expected to announce a reduction in their massive money-printing campaign. Many expected a reduction in monthly bond purchases of $10 billion. But instead of making what amounted to a tweak in policy, the Fed hesitated. The economic impact of the Fed’s decision isn’t all that significant. The Fed’s own economists admit that quantitative easing (QE) boosts growth by only 0.10%-0.20%. But the signal the Fed sent with its decision was indeed impactful, both on future monetary policy and investment markets.

From the Fed’s September meeting, we came away with three takeaways. The first is that despite an emerging consensus among academic economists that money printing is ineffective and may even harm economic welfare (something ordinary citizens recognized long ago), the Fed’s faith in money printing hasn’t wavered.

Second, the Fed stubbornly continues to insist—five years after the official start of the economic recovery, and despite glaring evidence to the contrary—that the high unemployment rate is not structural (not related to the business cycle).

Third, Bernanke reaffirmed that his Federal Reserve is overly focused on the short term when monetary policy is known to work with long and variable lags. The reasons the Fed cited for not making a marginal reduction in its money-printing campaign were: 1) short-term fiscal policy; 2) the near-term trend in economic data; and 3) the near-term trend in core inflation.

Okay then. We know the Federal Reserve is going to be run by an uber-dove for the first time in over three decades. We also know the Fed still believes in the power of money printing and continues to deny there is a large structural component to the high rate of unemployment. Ms. Yellen has also publicly admitted she would not hesitate to put the Fed’s employment mandate ahead of its inflation mandate. (We take the primacy of the employment mandate under Yellen as a given).

Moving forward the bar for ending the Fed’s money-printing campaign will be even higher than under the Bernanke Fed. A continuation of the Fed’s aggressive monetary interventions may have unsettling implications for future stock market volatility. As our Free Money Truck chart shows, the Fed’s activist policies have boosted stock prices to levels that are far above our estimate of fair value. And in the past when money printing was halted, stock prices quickly reverted back to fair value.

The problem with continuing QE is the potential for creating another bubble. We have seen this bubble situation before. In the early 2000s, high valuations were justified as a result of new efficiencies from technology and the internet. Leading up to 2008, then Fed chairman Alan Greenspan pointed to new credit derivatives as one reason why risks could be controlled by financial institutions. Today, the justification for excessive stock market valuations is the TINA (there is no alternative) factor. The Fed’s policy of holding short-term interest rates at zero and putting pressure on long-term interest rates has convinced many investors to bid up stocks to prices that imply dismal medium-term returns. As in 2000 and 2007, the Fed appears  unmoved by the financial excesses that its policies are creating.

Our concern with Fed policy is one reason we favor a balanced portfolio. As our Power of Counterbalancing chart shows, a balanced portfolio can significantly reduce the magnitude of losses in down years for the stock market. Over the last six decades, the largest down year for a hypothetical portfolio invested 50% in bonds and 50% in stocks (rebalanced annually) was less than 9%. When the dotcom bubble collapsed and the NASDAQ fell 39%, 21%, and 32% in 2000, 2001, and 2002, our  hypothetical balanced portfolio earned 6%, -1%, and 0%.

And when the real estate market plunged in 2008 and the S&P 500 cratered 37%, our hypothetical balanced portfolio was down only 3%. Retired investors and those soon to be retired cannot put a price on the comfort that a balanced portfolio offers when bubble-like conditions are prevalent in financial markets.

With U.S. stocks entering what we would describe as a speculative blow-off phase we are finding that international markets such as Europe offer investors more reasonable values. Our chart on the STOXX Europe 600 shows that 1) European stocks still haven’t surpassed their prior bull-market highs; 2) profit margins in Europe are depressed; and 3) European stocks trade at a 33% discount to U.S. shares on a price-to-sales basis.

European stocks likely trade at discounted valuations to U.S. stocks because investors are still concerned about the risk of a euro-area financial crisis. For the better part of the last year, the euro area has experienced relative calm, but that has more to do with Germany having elections in September than with any lasting solution to the crisis. With German elections now over, the risk of a flare-up in Europe has increased.

Angela Merkel (the sitting chancellor of Germany) won a resounding victory in recent German elections, but a surge by an anti-euro party in Germany helped push her junior coalition partner out of parliament. As a result, Merkel will have to form a new left-leaning coalition with the Social Democrats, who finished second in the German elections. The Social Democrats are strong backers of European integration, and are hostile toward the harsh austerity measures Merkel has required in order to support bailouts.

What does a left-leaning coalition between Merkel and the Social Democrats mean for the euro experiment and for financial stability in the region? Though the Social Democrats are pro-euro, the strong showing of the anti-euro startup party, Alternative for Germany, is likely to act as a check on more generous bailout packages for the euro area’s troubled governments. A banking union, which many non-German, euro-area policymakers view as a solution, is also likely out of the question, as both Merkel and the Social Democrats oppose it.

A probable scenario in the euro area is more of the same. Germany will agree to continue bailing out the euro area’s troubled governments, so long as painful austerity and structural reforms are conditions of the bailout money. This suggests that if the euro is going to break apart in the medium term, it will come as a result of political opposition in one of the PIIGS (Portugal, Ireland, Italy, Greece, Spain) countries.

Portugal, Greece, and Ireland may all require further assistance over the coming year, which could result in escalating tensions. But the elephants in the room are still Italy and Spain. Economic conditions in both countries are dismal. The Spanish economy is a disaster. Home prices are still plunging, loan delinquencies are over 10%, unemployment is astronomical, and wages are falling.

The root of the problem is that neither Italy nor Spain is competitive. And the only way for a country to regain competitiveness when they can’t print their own currency is to devalue internally. That means falling wages and prices.

The $64,000 question is whether the populations of both countries will sit idly by and endure these miserable economic conditions for the sake of staying in the euro-zone. That isn’t a question that we (or anybody else) can answer with any degree of confidence today. Because of this uncertainty, our advised strategy to profit from the more favorable valuations in Europe is to pursue a targeted approach. We currently favor mostly non-euro European country shares and select issues within the euro-area. Sweden remains one of our favored markets. We invest in Sweden via the iShares MSCI Sweden fund and via individual companies in our Retirement Compounders equity portfolios.

Some of our other favored plays in Europe include global blue-chip dividend payers such as British American Tobacco (UK), Vodafone (UK), and Philips Electronics (Netherlands).

At Richard C. Young & Co., Ltd., the balanced portfolios we craft for clients include more than just U.S. stocks and bonds. We invest in precious metals and foreign currencies to hedge against currency and inflation risk and we include international stocks to participate in global growth. Under most normal investing scenarios, investors benefit from a diverse asset mix without relying too heavily on one asset class.

Have a good month, and as always, please call us at (888) 456-5444 if your financial situation has changed or if you have questions about your investment portfolio.

Sincerely,

Matthew A. Young

President and Chief Executive Officer

P.S. In our August letter we wrote to you about the tailwind we expected Koniklijke Philips NV shares to receive from the company’s Accelerate! restructuring program. In the third quarter that tailwind began to propel Philips’ results. During the last quarter, Accelerate! helped produce a 33% increase in operational results. CEO Frans van Houten said of the successful program, “We continued to make good progress on the Accelerate! journey. Our overhead-cost-reduction program has resulted in EUR856 million in total gross savings to date, including EUR183 million realized in Q3 2013.” Philips isn’t done with its Accelerate! program, nor is that the only driver of growth at the company.

Another efficiency program called End2End is streamlining logistics and inventory management at Philips. And scientists and engineers at Philips are pioneering new tools to lead the way in image-guided medical procedures and therapies. In consumer electronics, Philips is innovating products for air purification, monitoring, and personal care.

The strong results encouraged a sharp rally in Philips shares on the day they were announced (Oct 21). And, in an effort to return more value to shareholders, Philips is beginning a share buyback program worth EUR1.5 billion.

P.P.S. We expect the Janet Yellen appointment to eventually be bullish for gold. It is our belief Yellen will be less focused on price stability and inflation and more interested in employment. The Yellen mandate will require more QE, leading to higher inflation down the road.

P.P.P.S. According to an October 21 opinion article in The Wall Street Journal by Fred Barnes, “Democrats, especially Senate Majority Leader Harry Reid, are fit to be tied as they watch cherished social programs gradually shrink. The sequester, enacted during the struggle over the debt limit in 2011, was the brainchild of the White House. It requires $1 trillion in cuts over 10 years in non-entitlement spending, $84 billion in 2013 and $109 billion in 2014.

To say the sequester has backfired for Democrats is putting it mildly. The specter of automatic cuts was supposed to scare members of a Senate-House panel assigned to forge a bipartisan budget accord. If they failed, the sequester would become law. Democrats believed this would never occur. But it did.

Now across-the-board cuts go into effect annually without the need for a fresh vote in Congress or the president’s signature. Nor are Republicans forced to offer Democrats the sweetener of tax increases. The sequester is cuts and only cuts. As a result, Senate Minority Leader Mitch McConnell noted proudly last week when announcing the end of the shutdown that “government spending has declined for two years in a row [for] the first time in 50 years.”


Utility Stocks and Interest Rates

September 2013 Client Letter

Today’s financial markets and most of society’s everyday operations are linked top to bottom by electricity. Electricity is a key component of the Internet, heating systems, medical equipment, transportation, and light. The list of items required day in and day out that rank ahead of electricity is rather short.

For years, we have favored utility companies. Investing in utility companies has a built-in layer of protection not found in most other businesses. By example, utilities are usually monopolies, and unlike almost every other business in America, when a utility makes a capital investment, it earns a guaranteed return on that investment set by local regulators (assuming proper operational execution).

Utilities’ regulated monopoly status creates a barrier to entry that prevents most forms of competition. Utility rates are set to provide enough money to run the businesses safely and efficiently, and to provide enough return to attract capital at competitive rates in order to finance new investments.

Additionally, if the cost of delivering electricity rises because of inflation, utilities pass on higher costs by applying for a rate increase. These layers of protection can make utilities a more stable investment than companies competing in markets with easy entry, low start-up costs, and super-thin profit margins, including technology and retail.

For the conservative investor, utilities offer attractive benefits, including the potential for income and capital appreciation, lower volatility than the broad equity market, and protection against inflation.

After beginning the year with a stunning 19% rally, the S&P 500 Utilities index has fallen out of favor. As explained in last month’s letter, investors seeking yield, bid up the shares of some of our favored utilities to aggressive valuations. We reduced exposure to utilities stocks as a result. But since the spring, the selling in utilities has become relentless. The S&P 500 Utilities index has fallen over 10% while the broader market has gained more than 6%—a 16% difference.

The catalyst for the sell-off in utilities was rising long-term interest rates. When interest rates rise, investors tend to sell utilities stocks first and ask questions later. But in our view, the selling has become overdone. To provide some perspective, the chart below compares the S&P 500 Utilities dividend yield to the 10-year Treasury yield. The horizontal lines in the chart show the average S&P 500 Utilities yield and the 10-year Treasury yield during the 2003–2007 economic expansion. During the prior economic expansion, investors regularly bought utilities at dividend yields that were a full 1.20 percentage points less than the yield on Treasuries. But today, with Treasury yields at less than 3%, investors don’t want anything to do with utilities stocks even though they yield more than 4%. That’s just as well in our book. We will gladly take utilities stocks with 4–5% yields off the hands of investors who would rather press their luck in more speculative sectors of the stock market.

But just because the selling in utilities stocks looks overdone doesn’t mean they can’t fall further. As most investors who have been around during the last 15 years can surely attest, the combination of bullish sentiment and misguided monetary activism can drive prices and fundamentals further apart than most expect. Nevertheless, with dividend yields of 4%–5% on many of our favored utilities, and historical dividend growth of 3%, it is reasonable to anticipate returns of 7%–8% over a full stock-market cycle.

The rise in interest rates that brought about more favorable valuations in the utilities sector has also taken the wind out of the sails of the bond market. Our fixed-income strategy keeps maturities short, and we reinvest maturing bonds into higher-yielding bonds when interest rates inevitably rise. Late last year and again in April, we even boosted our cash allocation in many portfolios—first to 7.5% and then to 10%. The higher cash allocation was an extension of our short-maturity bond strategy; minimize interest-rate risk and position portfolios to earn higher yields once rates rise.

As interest rates have risen over recent months, we have been able to deploy cash and reinvest maturing bonds into higher-yielding fixed-income securities. As you can see in the chart below, the yield on five-year Treasury securities is at levels we haven’t seen in over two years. For many clients, we were able to purchase a recent bond from Southern Company—one of the largest utilities in the United States. The Southern Company bond had a five-year maturity and was rated Baa1/A- by Moody’s and S&P. We purchased the bond at a yield to maturity of nearly 2.50%. We also purchased similar-maturity bonds from Home Depot and Unilever in select corporate bond portfolios at comparable yields.

GNMA securities, like utilities, have been hurt by rising interest rates. The Vanguard GNMA fund, a large position of ours, is down a couple of percentage points on the year. GNMA securities are more interest-rate sensitive than the short-term corporate bonds also included in our fixed-income portfolios. But in return for that greater interest-rate risk, GNMA has provided an above-average yield during an agonizingly long period of ultralow interest rates. If we hadn’t owned GNMA over the last few years, our fixed-income portfolios would have earned lower yields. After a sharp sell-off that has driven GNMA yields back above 3%, the case for GNMA is as strong today as it was in 2007—on the precipice of the financial crisis.

During the previous real-estate bubble, many investors abandoned GNMAs as the stock market was pushed skyward by a fed funds rate that was well below where it should have been. Sound familiar? Then in 2008, stocks were slaughtered. But 2008 wasn’t a bloodbath for everyone. The average GNMA fund tracked by Morningstar was up 6.6%. A terrific year for government mortgage-backed securities.

Take a look at the chart below. You’ll see the annual total return performances of Vanguard GNMA and the S&P 500. Right out of the gate, the S&P has an advantage in this example because the index has no expense ratio. But take a look at the consistency of GNMA. In each of the four down years for the S&P 500 this century, GNMA has been up. Right through the bursting of both the dot-com bubble and the housing bubble, GNMA rewarded investors.

It’s easy to forget the tough times when the stock market is soaring. But you’ll be glad you held your GNMA position the next time the stock market takes a tumble.

A central theme of our investment strategy is durability. Our goal is to invest in securities that have a strong likelihood of remaining in business. While we certainly could own a loser or two, we believe we reduce our odds of failure by focusing on sectors like utilities and owning a GNMA fund whose portfolio has the full-faith-and-credit pledge of the U.S. government. The focus on durability should limit unpleasant developments like the one we just saw with BlackBerry.

In the summer of 2008, BlackBerry had a market capitalization of almost $82 billion and ruled business mobile computing. You may recall candidate Obama on the campaign trail with BlackBerry close at hand. But BlackBerry faced stiff competition from the likes of Apple. On Friday, September 20, 2013, Blackberry saw its shares plunge by 17% as it announced what at least one analyst called a “disastrous” quarterly operating loss of almost $1 billion, along with plans to lay off about 40% of its staff.

Unfortunately, BlackBerry fell victim to a common occurrence within the technology sector: an established franchise or product being displaced by a newcomer. For BlackBerry, the disruption was caused by the iPhone, with its full touchscreens, cameras, and countless apps. BlackBerry, meanwhile, stayed mostly the same, with a half screen and a physical keyboard.

As is often the case in technology, once a franchise or technology is displaced by a newcomer, it can find it almost impossible to rebound. “The biggest problem (for BlackBerry) is that they won’t have money for R&D, and that’s death for a tech company,” said Neeraj Monga, an analyst at Veritas Investment Research in Toronto. “It’s not like Coca-Cola, which has been able to bottle the same formula for over 100 years.”

Have a good month, and as always, please call us at (888) 456-5444 if your financial situation has changed or if you have questions about your investment portfolio.

Sincerely,


Matthew A. Young

President and Chief Executive Officer

P.S. The market consensus for the Federal Reserve’s September meeting was an announcement that it will begin tapering its monthly bond purchases by $10 billion. Instead, the Fed went dovish, stating that QE would remain in place. Perhaps Janet Yellen has already taken over the Fed. In our view, QE3 is not boosting economic growth. What QE3 is doing is piling up the excess reserves in the banking system. There appears to be little evidence that all this money creation is contributing to economic growth. Growth is slow because the government is too big. Spending, regulation, and taxes are clogging the system and preventing our economy from reaching its full potential.

P.P.S. The current Fed appears to be a short-term-oriented central bank. Reasons the Fed cited for not tapering were that fiscal policy over the next month could be scary, that the Fed wants to see more evidence of economic strength in coincident data that is often revised and is a poor predictor of future economic growth, and that it wants to see the monthly prints of measured inflation reaccelerate.

Additionally, the Fed’s focus on low core-inflation readings indicates a narrow and limited view of inflation that may further destabilize the U.S. financial system. Just because the Fed’s 0% interest-rate policy and perpetual money-printing campaign haven’t yet resulted in higher measured consumer goods inflation doesn’t mean we have low inflation. The Fed can print money and increase liquidity, but it can’t control where money goes. Prices of homes—a good that two-third of Americans buy—are up 12% over the last year. If instead of using owners’ equivalent rent—a fictional measure of home price inflation—in the Consumer Price Index, the Fed used actual home prices, it would recognize inflation is running near 4.5%.

P.P.P.S. For the second year in a row, Barron’s has recognized Richard C. Young & Co., Ltd., as one of the top independent advisors in the country. For nearly 25 years, we have operated as an independent firm, meaning we do not underwrite securities, execute trades, or custody assets. Our advice and investment decisions are free of the conflicts of interest that plague commission-based brokers and large Wall Street firms with securities to distribute.


Four New Buys

August 2013 Client Letter

It is our view that the U.S. economy is far from being on sound footing, with potential bubble conditions existing in the stock and bond markets. Considerable blame lies at the feet of the U.S. government and the Federal Reserve. As time passes, economic conditions as measured by GDP continue to look weak, and yet the government continues to borrow from abroad a big portion of what it spends. The debt burden on Americans increases as the Fed continues to debase the currency with its money-printing excess. In July, writing in The Wall Street Journal, Mort Zuckerman wrote that a jobless recovery is a phony recovery:

In recent months, Americans have heard reports out of Washington and in the media that the economy is looking up—that recovery from the Great Recession is gathering steam. If only it were true. The longest and worst recession since the end of World War II has been marked by the weakest recovery from any U.S. recession in that same period.

The jobless nature of the recovery is particularly unsettling. In June, the government’s Household Survey reported that since the start of the year, the number of people with jobs increased by 753,000—but there are jobs and then there are “jobs.” No fewer than 557,000 of these positions were only part-time. The survey also reported that in June full-time jobs declined by 240,000, while part-time jobs soared by 360,000 and have now reached an all-time high of 28,059,000—three million more part-time positions than when the recession began at the end of 2007.

That’s just for starters. The survey includes part-time workers who want full-time work but can’t get it, as well as those who want to work but have stopped looking. That puts the real unemployment rate for June at 14.3%, up from 13.8% in May.

We have long questioned the impact of the Fed’s quantitative easing on economic growth, but have not doubted its impact on financial markets. Any time the Fed or another global central bank threatened to print money, asset prices rose. It didn’t matter if it was the Fed, the ECB, or the Bank of England. When the monetary spigots were opened, asset prices in those countries moved higher.

The Bank of Japan (BOJ) has its own money-printing campaign that makes Ben Bernanke look like an inflation hawk. The BOJ is printing about $75 billion per month, or $900 billion per year. That is a massive money-printing campaign relative to the size of Japan’s $4.2-trillion stock market. If the Fed were to print as much money as the Bank of Japan relative to the size of its stock market, Bernanke would have to pump over $4 trillion per year into the U.S. financial system.

Investors unconcerned with the rich valuations of the U.S. stock market should be wary. After a double-digit rally in the S&P 500 over the last 12 months and declining earnings per share over the same time period, the broader market looks vulnerable.

We aren’t making a prediction of impending doom, and we can’t predict when or even if stock prices will fall. What we can do, and what we always do, is evaluate risk ahead of potential return. And as we survey today’s global investment landscape, we see many areas of the financial markets where investors are not being adequately compensated for the risk they are bearing.

This unfavorable risk-reward ratio has even crept into some of our long-favored holdings. As a result, over recent months we’ve reduced and eliminated some of these stocks.

Some sales were made based strictly on valuation. Several of our utility positions, by example, became aggressively valued. Other positions were sold for stock-specific reasons. Stocks in this group include Statoil, Encana, Innergex Renewable, Peyto Energy, Bank of Nova Scotia, and Heinz, which was acquired. We sold Statoil because we see greater opportunity and yield with less risk in some of our other oil names. We sold Encana and Innergex due to concerns about the sustainability of the dividends. We sold Peyto because we believe the stock has gotten far ahead of its underlying fundamentals. And we sold Bank of Nova Scotia because of the bubble-like conditions in the Canadian real-estate market and elevated levels of household debt in Canada. While Canadian banks are still among the soundest banks in the world, even in a best-case scenario, a deflating Canadian real-estate market is likely to act as a fierce headwind to Bank of Nova Scotia’s prospects.

Profiled below are a few of the stocks purchased with the proceeds from recent sales.

Potash Corp.

Potash Corp. is the world’s largest fertilizer company by capacity, producing the three primary crop nutrients: potash, phosphate, and nitrogen. POT is the leading producer in its namesake, with a 20% share of global capacity; the world’s third-largest producer of phosphate, with a 5% market share; and the third-largest producer of nitrogen, with a 2% market share. POT also owns stakes in four global fertilizer companies: SQM, based in Chile; Israel Chemicals, based in Israel; APC in Jordan; and Sinofert in China.

POT’s Canadian potash mines are the company’s crown jewel. POT owns six mines in Canada—five in Saskatchewan and one in New Brunswick. Potash production accounts for the lion’s share of gross profit at POT (~60%). The firm’s mines are some of the lowest-cost potash mines in the world, and they have an average reserve life of more than 60 years.

Potash is a compound of potassium and other elements. There are no substitutes, and all living matter requires potassium. It cannot be made. It is the seventh most abundant element on earth, but not in the high concentrations needed to produce potash. The majority of potassium reserves lie in ancient inland ocean beds. When the oceans evaporated, the potassium, along with other elements, crystallized into potash. The seabeds were eventually covered by new layers of sediment and are now minable seams that consist of potassium chloride—potash—and sodium chloride, better known as table salt.

Today, the addition of potash to commercial food-crop operations is essential. Potash can be applied to a variety of crops, including grains, fruit, vegetables, and even cotton. The benefits of the fertilizer are many and include increased water retention, higher yields, and improved resistance to disease. Crops grown with potash are also more aesthetically pleasing, with better color, texture, and taste.

If there is one product that is likely to remain in demand in the coming decades, it is potash. Over the next four decades, global population is expected to increase to nine billion from seven billion today. And as the developing world grows richer, its people want more meat in their diets. It can take as much as seven kilograms of grain to produce a single kilogram of beef, so there is a multiplier effect. In order to meet the increased demand for a more protein-rich diet, global food production must increase by 60%–100% over the next four decades. This is going to require a lot more grain. And with the amount of arable land relatively fixed, crop yields must increase. The increased use of fertilizer in countries where it is underutilized today will play a big role in maximizing global crop yields.

Potash shares have lagged the market over the last couple of years, with the price recently dipping below the price BHP Billiton offered for the company in a failed takeover bid in 2010. Meanwhile, the company has significantly increased its dividend. Over the last two years, the quarterly dividend has soared to $0.35 per share from just over $0.03—a more than tenfold increase. Today the shares yield a respectable 3.5%, with the prospect of additional significant dividend hikes.

Rogers Communications

Rogers Communications is a diversified Canadian communications and media company. It owns Rogers Wireless, Canada’s largest wireless voice and data provider; Rogers Cable, one of Canada’s leading cable services; and Rogers Media, a leading radio and television broadcaster in Canada.

Rogers Wireless provides wireless voice and data communications services to more than nine million customers, or about 35% of Canada’s wireless subscribers. The wireless division is Canada’s only national carrier operating under the global standard 3G HSPA+ and 4G LTE platforms. The wireless division accounts for almost 60% of revenue and 65% of operating profit.

Rogers Cable provides services to approximately 3.7 million homes in Ontario, New Brunswick, Newfoundland, and Labrador, with 61% penetration of the homes that it passes. Rogers Cable accounts for 27% of revenue and 34.5% of operating profit.

Rogers Media is Canada’s premier combination of category-leading radio and television broadcasting, televised shopping, sports entertainment, publishing, and digital media properties. Rogers Media accounts for 13% of revenue and makes a minor contribution to operating profit.

With Rogers Communications, you get the upside of the wireless business that an AT&T or a Verizon offers, without the legacy wireline telecom assets. Plus, Rogers offers more opportunity for growth. Wireless market penetration in Canada is only 78%, compared to 103% in the U.S. and 122% in the U.K. Rogers also has opportunities for growth with smartphones. Only about 65% of Canada’s wireless customers own smartphones. Smartphone subscribers generate roughly twice as much revenue as voice-only subscribers. Rogers doesn’t offer as big a yield as an AT&T or Verizon, because it retains more of its earnings. This lower payout ratio provides opportunity for strong dividend growth down the road.

Royal Dutch Shell

Royal Dutch Shell is one of the world’s largest integrated oil and gas companies. It operates in 80-plus countries and owns 14 billion barrels of proved oil reserves and more than 30 refineries and chemical plants. Shell’s proved reserves are tilted almost 60% toward natural gas. Shell is also a leader in the growing market for liquefied natural gas, and it owns the world’s largest gas-to-liquids (GTL) plant in Qatar.

Shell’s GTL plant in Qatar is known as Pearl. Each day the Pearl plant can turn 1.6 billion cubic feet of natural gas into 140,000 barrels of GTL fuels like gasoil, kerosene, naphtha, and lubricants, as well as 120,000 barrels of natural gas liquids and ethane. Gasoil is the focus of the production as it can be added easily to diesel fuel for transportation. One of the upsides of gasoil is that it burns cleaner than traditional diesel fuel, and is therefore more attractive for high-traffic areas and dense urban centers. Income from Pearl allowed Shell to increase its dividend this year, and the company is considering building a similar plant in the United States. Shell offers investors better than a 5% yield.

Koninklijke Philips NV

Philips may be best known in the U.S. for lighting and consumer electronics, but over 60% of the company’s operating cash flow comes from its healthcare business.

Philips Healthcare is a world leader in cardiovascular treatment, and it has a strong presence in the cardiopulmonary, oncology, and women’s health fields. Its business is organized across four business groups: Imaging Systems, Patient Care and Clinical Informatics, Home Healthcare Solutions, and Customer Services.

Imaging systems account for about 40% of sales in Philips Healthcare. The Philips Imaging Systems group includes interventional X-ray, diagnostic X-ray, computed tomography (CT), magnetic resonance imaging (MRI), nuclear medicine, and ultrasound imaging equipment. The next-largest group by sales is Customer Services. The Customer Services group includes consulting, site planning, project management, clinical services, equipment financing, and equipment maintenance and repair.

The U.S. is the largest market for Philips Healthcare, accounting for over 40% of sales. Japan and China are the healthcare business’s second- and third-largest markets.

We view Philips as an under-the-radar defensive stock. It may not be as defensive as a Johnson & Johnson, but healthcare and lighting—the vast majority of Philips’ business—aren’t products most consumers would willingly do without.

What’s more, Philips is in the midst of a restructuring plan to cut over €1 billion in expenses, boost profitable growth, and drive productivity. The plan is dubbed Accelerate. Accelerate is designed to strengthen customer-facing teams to help increase market share and enhance innovation and performance.

The Accelerate program should act as an added tailwind to Philips’ results over coming years regardless of how the global economy performs. Philips pays a dividend and has a strong commitment to continued dividend payments. At the current price, the shares yield 3.5%.

*          *          *

Five years after the initiation of the largest money-printing campaign the world has ever seen, the Fed may finally be coming to the same conclusion that many Americans reached years ago—pumping trillions of dollars of freshly printed money into the financial system does not create lasting economic growth. Instead, excessive money printing unduly inflates stock prices and encourages manipulation, mispricing, and misallocation of capital.

According to the latest research on quantitative easing from the Fed’s San Francisco branch, the $600-billion QE2 money-printing campaign added 0.13% to economic growth in late 2010. In a $16-trillion economy, that is the equivalent of $20 billion of economic activity. Doesn’t sound like much bang for the buck. It gets worse, though. When the authors adjust for the stimulative impact of the Fed’s promise to keep short-term interest rates at zero well into the future, quantitative easing is found to add only 0.04 percentage points to growth—we are talking rounding errors here.

One can only hope this recent research will influence future Fed policy before perpetual money printing further impairs the structural integrity of the U.S. economy.

Have a good month, and as always, please call us at (888) 456-5444 if your financial situation has changed or if you have questions about your investment portfolio.

Sincerely,                                                       

Matthew A. Young

President and Chief Executive Officer

P.S. Two industries that dominate the dividend-paying landscape are energy and telecom, and both are included in our stock portfolios. These industries tend to feature blue-chip companies with powerful cash-flow trends and the financial resources to pay out a high level of current dividends. These companies also have the ability to increase dividends regularly and to maintain enormous multibillion-dollar share buyback programs.

P.P.S. It turns out that among China’s 1.3 billion people, there are enough gold bugs to move the market. The newly affluent Chinese are driving a demand increase for the yellow metal. According to the South China Morning Post, China will overtake India this year as the world’s largest gold bullion consumer. The SCMP quotes Zhang Yongtao, vice-chairman of the China Gold Association, as saying, “We saw some frenzied buying following gold’s rout in April, and our preliminary estimate confirms that consumption reached about 137 tonnes, more than double a typical month. Chinese demand for gold will remain robust because people are getting wealthier and investment choices are limited.”

P.P.P.S. We recently purchased Vanguard Health Care ETF (VHT) to gain exposure to the long-term demographic tailwind of the healthcare sector. The U.S. and the world are aging, and populations in the emerging world are growing richer, which should all lead to greater demand for healthcare goods and services. We decided to go with the fund approach rather than the individual stock approach in order to gain broad exposure to the healthcare sector. According to Vanguard, VHT’s annual expense ratio of 0.14% is 90% lower than the average expense ratio of funds with similar holdings.


The Risk of Reaching for Dividend Yield

May 2013 Client Letter

It’s not easy finding a company whose share price is down 55% on the year. And you most likely would not expect such a collapse to come from a boring utility company. But such is the case for Atlantic Power, a utility company that owns a diversified portfolio of power generation assets in Canada and the U.S.

Why did the shares of a supposed staid utility, a utility that began the year with a dividend yield of over 10%, no less, crater 55%? Has the Federal Reserve’s endless money printing campaign finally caused investors to go mad? Well, yes, but in the case of Atlantic Power, the stock did a face-plant for a more basic reason: the dividend was slashed. In late February, Atlantic Power announced a 66% reduction in its monthly dividend. Shareholders were crushed. It turns out that Atlantic was shelling out much more in dividends than it was generating in cash flow—an obviously unsustainable arrangement.

I bring up Atlantic Power to highlight the potential perils of reaching for income and buying stocks solely on the basis of yield. With interest rates currently in the tank, income investors and conservative investors alike are reaching for yield in every nook and cranny of the financial system. Some probably saw the 10% yield on Atlantic Power and thought, “why not?” Those investors might have said to themselves, “What’s wrong with a 10% yield on a safe utility stock?” In hindsight, that would have been a costly mistake.

Companies operating in generally safe industries are not always a safe investment. Enron, after all, was classified as a boring pipeline company. Fannie Mae carried the implicit backing of the full faith and credit of the United States. Both companies cost many investors their fortunes.

At Richard C. Young and Company Ltd., we have made our share of mistakes (and will make more in the future), but our goal is to side-step the types of blunders that investors in Atlantic Power, Enron, and Fannie Mae made.

Dividend Stocks with High Barriers to Entry

We favor high-dividend-yielding stocks, but we don’t reach for yield. We favor companies with high barriers to entry that appear to have clean balance sheets or readily available access to capital markets. And we need to be confident in the long-term business outlook for a company. We don’t mind riding through temporary price volatility as long as we believe the company’s business prospects have not been permanently impaired. And, where we may be wrong? Well, that is why we craft diversified portfolios.

No matter how durable a business is or how high its barriers to entry are, there is always the risk of the unknown. New regulations, new innovations, and unforeseen liabilities, among other things, all have the potential to vastly change the value of a company. By example, you wouldn’t want your entire net worth tied up in a wireless telecom company even though the industry’s long-term prospects look promising. What if a new satellite technology comes along, making today’s wireless providers obsolete? Or what if a new cellular phone operating on wi-fi networks comes along and drastically reduces the demand for wireless bandwidth?

We will never be able to avoid unknown risks entirely. What we can do is reduce the potential for risk. One of our favored strategies to reduce risk is to favor companies owning a strong record of dividend increases. Annual dividend hikes do not just boost shareholders’ returns and help investors keep pace with inflation, they are a powerful signal. A higher dividend is a strong indication that management and the board are confident in the future prospects of their business. Rarely does a company hike a dividend if it is not confident it can generate the additional cash flow to fund that dividend.

Many companies we own have recently raised their annual dividend, including Johnson & Johnson (J&J), Procter & Gamble (P&G), Phillip Morris, and AT&T.

Johnson & Johnson

It may not be surprising, but one of the highest-profile companies in the world is also one of the stock market’s longest-serving Dividend Aristocrats. J&J recently said it would raise its quarterly dividend by 8%, extending a streak that has run for half a century.

The history of J&J is replete with innovation. Firsts they’ve developed include mass-produced dental floss, first-aid kits, maternity kits, feminine sanitary products, adhesive bandages, tearless baby shampoo, acetaminophen, and more.

But the real value for J&J lies in its branded consumer products business. Band-Aid, Neutrogena, Johnson & Johnson baby products, Listerine, Tylenol, Carefree, Visine, and others fill out a portfolio of famous brands J&J can rely on to generate mountains of cash for dividends.

Procter & Gamble

No company works harder than P&G to know its customers. Management at P&G has invested more in market research than any other company. P&G reaches out to millions of customers each year, spending more than $400 million on over 20,000 customer research studies. A measure of P&G’s success is its top placement on the SymphonyIRI Group New Product Pacesetters report, where it has placed 132 products in the top 25 over the last 16 years. That’s more than P&G’s six largest competitors combined. P&G has paid a dividend since 1891 and increased that dividend for 59 consecutive years. In April, P&G raised its dividend by 7%, bringing the five-year compound annual growth rate in dividends per share to 8.5%.

Philip Morris

Philip Morris International is the world’s largest publicly traded manufacturer and marketer of tobacco products. Excluding China, the company’s estimated market share exceeds 27%. Philip Morris owns seven of the world’s top 15 international brands, including the world’s top brand, Marlboro. Marlboro outsells its next two closest global competitor brands combined. Geographically, 41% of the company’s revenues are generated in the European Union, 24% in Eastern Europe, the Mideast and Africa, 22% from Asia, and the balance from Latin America and Canada.

Although global cigarette demand is not expected to increase over coming decades, Philip Morris International is forecasting long-term revenue growth of 4%–6% and earnings growth of 10%–12%. The company expects to generate growth through a combination of market share gains, productivity improvements, and price increases.

 Morris generates loads of free cash flow (cash flow from operations minus capital spending). Over the last 12 months, the company generated free cash flow of $8 billion—all of which was returned to shareholders in the form of dividends and share buybacks. In the five years since Philip Morris International has been an independent company, the dividend has been increased by 85%.

AT&T

The inventor of the telephone, Alexander Graham Bell founded Bell Telephone in 1877. Through a series of mergers and divestitures, eventually Bell Telephone would become part of its former subsidiary, AT&T. For decades AT&T would grow and eventually become a monopoly that would be dismantled in 1984. In 2005, one of the company’s progeny, SBC Communications, would buy AT&T Corp. and form the new AT&T that exists today.

Currently, AT&T owns the nation’s largest 4G network, which covers 275 million people and 105.2 million wireless subscribers. AT&T also has the best worldwide coverage of any U.S. carrier with voice service in 225 countries and data roaming services in 205 countries.

AT&T is a dividend stalwart. It doesn’t have as long of a record of consecutive dividend increases as P&G or J&J, but the record is an impressive 28 consecutive annual increases. What AT&T lacks in dividend increases it makes up for in yield. AT&T shares yield nearly 5% today.

On the U.S. economic front, we are still seeing relatively weak GDP numbers. The initial estimate for first-quarter GDP was 2.5%. Economists had expected 3% growth. GDP numbers in general appear to be trending down. When people used to talk about trend GDP, it was at 3.5%, then 3%, and now it’s looking like something else altogether.

By example, from 1950 to 1969 the annualized rate of quarterly real GDP growth averaged 4.4%. In the post-gold-standard/pre-internet years from 1970 to 1999, the average was about 3.3%. But since 2000, the average has dropped significantly, to 1.73%.

The question is, is this the new normal, and, if not, what will get this economy moving at previous speeds? There isn’t a lot of growth in the various sectors of the economy. Overall spending accounted for 2.24% of the 2.5% increase in GDP. Personal consumption rose at a 3.2% annual rate, the fastest growth since the first quarter of 2011. Given the increase in payroll taxes and very low savings levels, consumption may be at risk.

If growth slows from here, which the most recent data suggests, we may be approaching stall speed in the next quarter or two. But then again, that may all get revised away as the Bureau of Economic Analysis (BEA) is doing a comprehensive revision to GDP with the July release. The BEA will be adding new and subjective categories to GDP that haven’t been present in the past. Odds are that the revisions will make growth look better than has been reported. The bottom line on GDP? Trend growth ain’t what it once was.

Have a good month. As always, please call us at (888) 456-5444 if your financial situation has changed or if you have questions about your investment portfolio.

Sincerely,

Matthew A. Young
President and Chief Executive Officer

P.S. A little known fact about many 401(k) plans is that employees may be able to rollover plan assets into an IRA outside of their company while still employed. These in-service distributions can enable you to increase your investment options and diversify your portfolio. If you are interested in having Richard C. Young & Co., Ltd. manage your retirement assets, check with your plan administrator to see if you are eligible for an in-service, non-hardship withdrawal.

P.P.S. Lately, investors have been selling gold—citing tame inflation, a bull stock market, and a reduced need for safe-harbor investments. When we initiated our position in gold, it was for a hedge, and gold still fills that role today. At some point, interest rates will rise and inflation could significantly increase, which would most likely be bad for stocks and positive for gold.

P.P.P.S. Predicting when interest rates will rise from their historical lows is an increasingly difficult task. In a Wall Street Journal Survey conducted in May, 98% of economists predicted that the yield on the 10-year Treasury note would be higher in December. But consider: In May 2011, 98% of economists forecasted rising rates. Rates fell. In May 2012, 98% said rates would rise. They fell again. The Journal noted that betting on interest rates could lead investors into dangerous waters. Instead the Journal offered the following advice: “Investors need to make sure they’re not forgetting the primary role of bonds in a portfolio—to protect against a significant drop in stocks.”


Problems with Capitalization Weighted Indexes

April 2013 Client Letter

One of the simplest economics lessons I received came decades ago from my dad. He would tell me to look at copper to gauge the economy. When copper prices are rising, the economy is probably expanding. Falling prices could signal trouble ahead. Dr. Copper is what he called the metal because it has a PhD in economics.

Another economic indicator is the stock market. Generally speaking, one would expect a rising stock market to occur during favorable times. Today, with the market near all-time highs, it would be reasonable to assume we have an economy supporting the stock market’s rise.

To check in on the U.S. economy, we can take a look at Dr Copper. Certainly, a stock market nearing all-time highs will be confirmed by a decent trend in copper prices.

As can be seen from the chart, the stock market’s upward path does not correlate with the path of copper, whose prices peaked in February 2011. The price is in a two-year decline from its all-time high. Copper’s 28.5% decline since early 2011 puts the metal in an official bear market. So what’s the story? Why are stocks soaring while copper is signaling problems?

As I have indicated in previous letters, I believe the stock market is being propped up by the Fed and its current monetary policies. My March 26 letter included a chart showing how well stocks performed after various QE measures.

Copper, on the other hand, is not a buyer of Bernanke’s medicine. And copper surely is suspect of the five consecutive quarters of GDP decline among euro-area countries. The current recession in the euro area has gone on as long now as the so-called Great Recession did. Unlike the Great Recession, however, Europe’s recession may get worse before it gets better. The OECD doesn’t believe Greece’s economy will grow until the end of 2014.

Combine Europe’s woes with slowing economic growth in China, lower economic growth forecasts for India, a Russian economy many expect is already in recession, and a slowing Brazilian economy, and it’s hard to have faith in today’s bull market.

Our concerns with the stock market contribute to our current equity strategy, which emphasizes higher-dividend-paying stocks from the more defensive sectors of the economy.

At our family-run boutique investment company, “simple is sophisticated” has long been one of our basic business tenets. We apply it both to managing our firm and to our investment management process.

The Price-Weighted Dow Jones Industrial Average

A compelling example of simple is sophisticated in the stock market is the Dow Jones Industrial Average. Among the general public, the Dow is the most widely recognized stock market index; but in the institutional investment community, it is widely considered a clunky, flawed, and antiquated index. Those are all fair criticisms. After all, the Dow was created in 1896 by Charles Dow, cofounder of the Wall Street Journal. Lacking any high-powered computing power, Mr. Dow decided to take a simple approach to index construction. He calculated an average of the prices of 12 stocks from leading American industries. The calculation could have been done on the back of an envelope.

The Dow Jones Industrial Average is a price-weighted index. Companies with higher stock prices are more heavily weighted in a price-weighted index. By example, IBM, with a share price of $208, gets more than twice the weight of Exxon ($87 per share), even though Exxon is the world’s most valuable publicly traded company. Exxon has a market value of $385 billion to IBM’s $232 billion.

Most modern stock market indices are weighted by market value. The S&P 500 is a market value or market-capitalization-weighted index. Since Exxon is the most valuable company in the S&P 500, it has the highest weighting in the index.

Dow & S&P Have Similar Results

While it may be true that the Dow’s index methodology is clunky and antiquated, it has achieved similar results to the more complex market-capitalization-weighted S&P 500. For the 10-year period ending in March, the Dow has compounded at 8.93% versus 8.52% for the S&P 500. Over the last two decades, the Dow has generated a 10% return compared to 8.5% for the S&P—a substantial advantage of over 35% when compounded over 20 years. And despite holding only 30 stocks, the Dow did it with less volatility.

Quite a shocker, is it not? A simple average of 30 stocks, almost arbitrarily weighted by price and selected by a small index committee for reputation and popularity, has delivered better risk-adjusted results than a rigorously weighted portfolio of 500 stocks.

Our takeaway is a properly diversified portfolio does not require hundreds of stocks, nor does it require market-value weighting. This basic insight is a major reason the first common stock program we offered to clients at Richard C. Young & Co., Ltd. selected exclusively from Dow companies. As our desire to generate higher-dividend yields and broader diversification grew, we merged the Dow program into our current global common stock program—The Retirement Compounders.

The Drawbacks of a Capitalization Weighted Index

Unfortunately, this basic insight has been lost on many investors. There is no denying that for tracking or replicating the market return, a capitalization-weighted index is the way to go. But if you are investing real money, it is vital to understand the drawbacks of a cap-weighted portfolio.

Over-Weighting Overvalued Stocks

Capitalization is a function of price. When prices rise, capitalization rises, and vice versa. Since capitalization-weighted indices are weighted based on the market value of the companies in the index, they necessarily overweight overvalued stocks and underweight undervalued stocks.

As a stock’s market value rises, its weight in a cap-weighted index becomes larger. If you go back to the dotcom bubble, the information technology sector grew to account for 35% of the S&P 500 (see chart). In 1999, the top-10 holdings in the SPDR S&P 500 ETF included Microsoft, Intel, Cisco, Lucent Technologies, and America Online. Investors who thought they were investing in a broad-based market index had over a third of their money in tech stocks.

This overweighting of overvalued stocks is also apparent at the individual company level. Consider Apple. In the first nine months of last year, Apple shares rose by 73% to $700 per share. As Apple’s stock price rose, so did its weight in the S&P 500. In September of last year, Apple’s weight in the S&P 500 was approximately 5%. A little less than seven months later, Apple shares are down almost 45% while the broader market is up about 7%—an almost 50% difference. Apple’s weight in the index has of course fallen with its share price, but that didn’t help the investors who bought an S&P 500 index fund in September of last year. According to Research Affiliates, the inefficiencies of market-capitalization-weighted indices can lead to a drag on returns of about 2% per year in developed markets.

A Lack of Diversification

Another potential drawback of capitalization-weighted funds can occur in certain markets where a handful of names can greatly affect performance. This is most common outside of the United States. Brazil offers a good example. The iShares MSCI Brazil ETF is a capitalization-weighted index fund of Brazilian stocks. iShares Brazil’s top-four holdings account for over 35% of its portfolio. Investors aren’t getting broad diversification by investing in iShares Brazil.

When we craft equity portfolios for clients, we don’t weight positions by market capitalization. Like Charles Dow, we favor a simpler approach. We just equal weight all common stock positions at the time of purchase. As the close correlation between the 30 stock Dow and the 500 stock S&P 500 described earlier shows, there isn’t much reason to fiddle around with capitalization weighting. That is unless your goal is to beat the benchmark.

Beating the benchmark is the sole purpose of many actively managed equity funds. As a result, many mutual fund managers pay close attention to sector, industry, and individual stock weightings. Their investment decisions are often made in relative terms. They are either overweight or underweight a sector or stock. Rarely are these portfolio managers entirely out of a sector or stock. Instead they hug the benchmark weightings.

Our goal isn’t to mimic or beat a benchmark. Our goal is to help clients meet their investment objectives. Most often those objectives include generating income, saving for retirement, passing assets to future generations, donating money, preserving capital, and appreciating capital. Rarely do investors come to us with the goal of outperforming a specific benchmark.

Since we don’t concern ourselves with beating a benchmark, we don’t focus obsessively on sector and industry weightings relative to an index. We of course pay attention to the sector and industry weightings in the portfolios we manage, but only to ensure proper diversification. We tend to favor certain sectors and industries in the stock market and avoid others altogether.

In your first-quarter holdings report, we have broken down common stocks and equity funds by sector. This enhancement provides a more intuitive presentation of which sectors of the market your portfolio is invested in. By example, your holdings report will reflect the higher concentration in consumer staples and utilities stocks compared to other sectors.

Astute observers will also notice that there isn’t a single stock from the technology sector. This is by design. As we’ve outlined in past letters, technology is not an industry we favor. The barriers to entry are often low, the risk of obsolescence is high, and many companies in the sector pay no dividends—a deal breaker for us.

The utility sector is more up our alley. Rather than spend energy forecasting the next product cycle in consumer electronics, we can be relatively sure electricity will remain in demand and be delivered in much the same way it is today for the foreseeable future. We are also relatively confident that consumers will continue to turn the lights on, regardless of the economic environment.

Unlike technology stocks, the barriers to entry in the utility industry are sky-high. Utilities are regulated monopolies. And, as regulated monopolies, their returns on investment are set by a local regulator. If a utility makes a capital investment, it is guaranteed a return by the regulator, as long as it executes properly. In many cases, the guaranteed returns are in the double digits—sometimes upwards of 12%. A 12% guaranteed return on investment isn’t bad in the land of zero-percent interest rates. And it is much more certain than the pie-in-the-sky return estimates we see for many companies in the technology industry.

Have a good month. As always, please call us at (888) 456-5444 if your financial situation has changed or if you have questions about your investment portfolio.

Sincerely,

Matthew A. Young

President and Chief Executive Officer

P.S. In mid-April, gold bugs got squashed with a nasty two-day blast of selling. In fact, a 9.4% decline on April 15 was the metal’s worst one-day drop in 30 years. Gold’s rout appeared to have been triggered by a combination of worries over Cypress and other banks becoming sellers of gold, an earlier sale recommendation by Goldman Sachs, and a growing view that stocks are currently a better investment than gold.

P.P.S. Contributing to gold’s volatility included forced selling, where investors who borrowed to buy gold needed to sell in order to raise cash to meet margin calls on those loans. Additionally, gold exchange-traded funds, including the SPDR Gold Trust, saw lots of activity. More than $1 billion alone flowed out of the SPDR fund on April 12—the third-highest withdrawal on record, according to research firm IndexUniverse.

P.P.P.S. Gold’s decline was of little concern to us. We include gold as part of our currency component and a hedge against a declining dollar. In today’s world, the largest central banks are on a money-printing binge to debase their respective currencies. By example, the U.S. is printing at the rate of $85 billion per month. Japan is a close second, printing $70 billion per month. If we were to have sold our currency hedge—gold—what would we have bought with the proceeds? More U.S. dollars? Some euros? I don’t think so. Investing in hard assets, including gold, is our insurance policy in a world of global money printing.