How Central Banks Power the Stock Market

March 2013 Client Letter

The anxiety-ridden days of the financial crisis get pushed further back in the minds of investors as the Dow and S&P 500 hover around all-time highs. Fear is no longer the dominant theme on Wall Street. Greed is back in favor. Investors appear convinced the next major move in the stock market will be up rather than down.

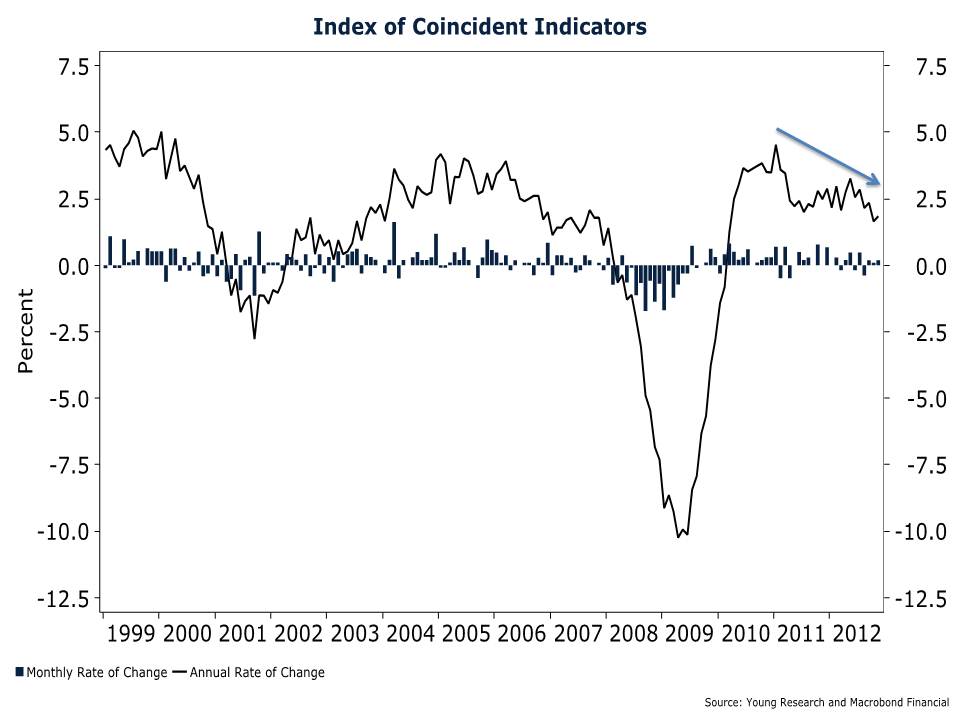
The strong performance from stocks over the recent years can seem puzzling. Economic growth is weak, unemployment is still nearly 8%, and private-sector real incomes remain below pre-crisis levels. How have stocks managed such an impressive recovery in the face of a slow economy?

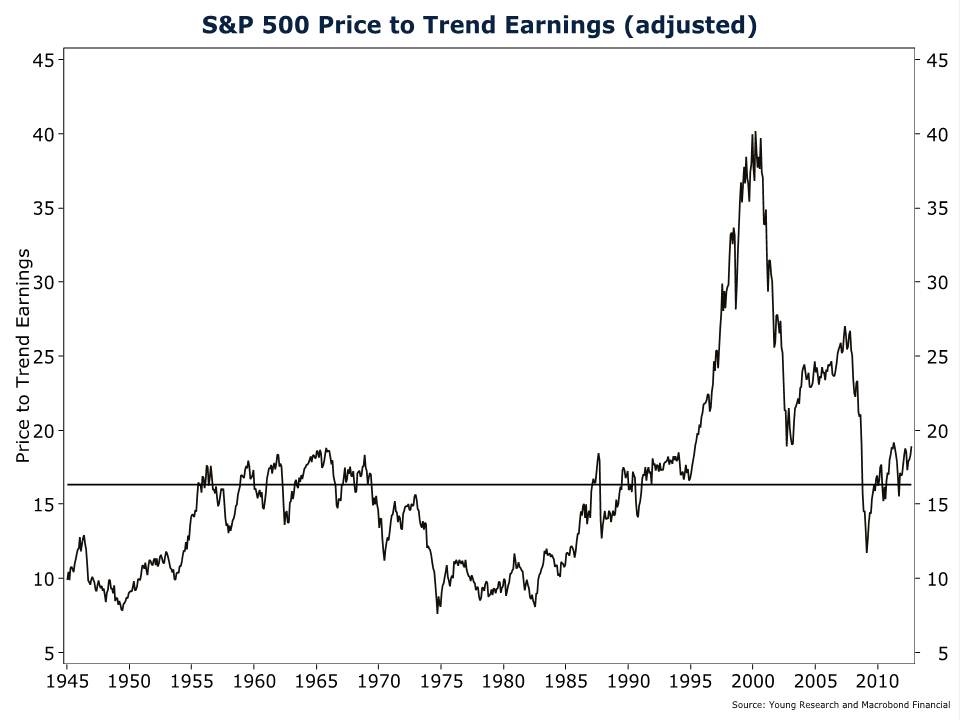
Our S&P chart goes a long way to explaining the last four-year bull market run. The black-line on the chart is the S&P 500. The blue line on the chart is an approximation of the fair market value of the S&P 500. Our measure of fair value is simply the level of normalized earnings (we use trend earnings) multiplied by the historical median price-to-earnings ratio.                  

As you can see in the following chart, the blue line trends upward from the lower left-hand to the upper right-hand side of the chart as trend earnings increase. In contrast, the S&P 500 fluctuates far above and below our fair-value line.

If you study the chart carefully, the drivers of stock market performance become apparent. During the height of the crisis, the S&P 500 plunged far below fair value as investors anticipated the coming of the second Great Depression. As the financial system stabilized and the Fed flooded the system with liquidity, stocks quickly rose back to fair value.

But since mid-2009 when stocks passed through fair value, the story of the stock market has been one of monetary profligacy. From mid-2009 until mid-2010, stocks rode the Fed’s free money truck (QE1) to a level far detached from underlying fundamentals. The market cratered back to fair value as soon as Dr. Bernanke decided it was time to pull the free-money truck back into the garage.

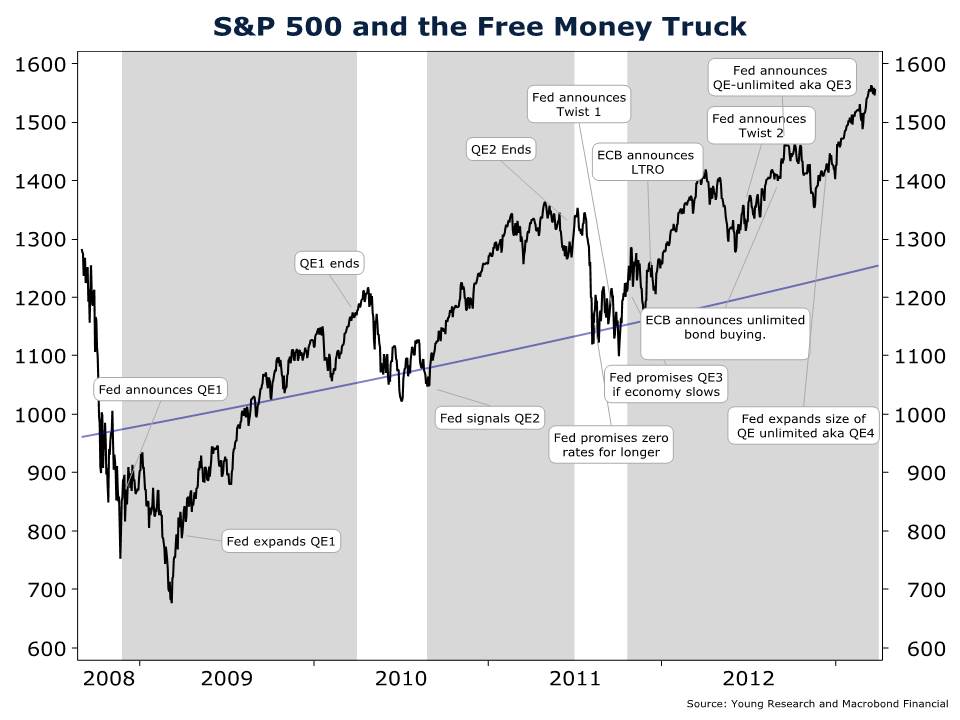
But a plummeting stock market didn’t sit well with Dr. Bernanke, so he released the free money truck for another spin around Wall Street. On this second joy ride (aka QE2) Dr. Bernanke drove stocks even further away from fair value. And once again when the ride was over, the market sank back toward fair value.

A sinking market upset the apple cart at the Fed. After all, the stated purpose of the first two trips in the free money truck (QE1 & QE2) was to inflate stock prices. So what did the Fed do? First they tried to prop up the market by promising to keep rates at zero for two years. Then they announced “operation twist,” which called for extending the maturity of the Fed’s Treasury portfolio. Apparently those policy actions didn’t have the immediate impact on stock prices that the Fed was hoping for. So, in the fall of 2011, the Fed signaled that a third round of money printing would be initiated as soon as U.S. economic growth slowed.

In December 2011, the European Central Bank (ECB) made its own contribution to raising stock prices with two massive money-printing campaigns of its own. Once investors were convinced that the Fed and the ECB would initiate more money printing should economic growth slow, it was off to the races for stock prices. Since the Fed promised QE3 in late 2011, stock market corrections have been shallower and the deviations from fair value have grown larger. Central bank intervention has also become more frequent. In mid-2012, after only a mini stock market correction, the Fed announced Twist 2. Then the ECB announced unlimited bond buying. Not to be outdone by the ECB, the Fed followed up with its own unlimited money-printing announcement only weeks later. And just to be sure it wasn’t outdone by the ECB, the Fed expanded the size of its unlimited money-printing campaign at its December 2012 meeting.

Perpetual money-printing campaigns by the Fed and its foreign counterparts have resulted in a widening disconnect between stock prices and fundamental values. At current levels, the S&P 500 is trading almost 20% above our fair-value estimate. Additionally, the Fed’s actions could significantly devalue the U.S. dollar, which is why we favor adopting a hedge against the risk of currency debasement.

Since 2006, we have been buying gold as our first line of defense against currency debasement. Gold is the world’s only true hard currency. Gold is not only a currency hedge, it is also an inflation hedge and a hedge against geo-political risk. Over long periods of time, gold retains its purchasing power.

Our philosophy towards gold is different than most other investments. In general, we view gold as a permanent holding in an investment portfolio. (At times, however, there may be a need to rebalance.) We are not looking to buy gold to sell it to a higher bidder in the next month or year or two years. If everything goes according to plan, the gold we buy will fall in price because, as should be evident from the last few months, when gold prices fall other positions in your portfolio will likely rise.

In addition to gold, we have begun to take a position in platinum. Gold is mainly used as an investment, and it has little industrial demand. Platinum has a very important role in industry, and it can be argued that its investment case is even stronger than gold’s. Platinum is rare. The Earth contains 265 times more gold reserves than platinum reserves.

Not only is there less platinum than gold, but mining for the platinum that does exist is not always an easy exercise. Most platinum is found in geopolitically risky countries. South Africa supplies 70% of the world’s platinum and Russia supplies another 11%. Earth’s largest-known deposits of platinum were found in South Africa in 1924 by Hans Merensky. The find is now part of what is known as the Bushveld Complex. The mines along the Bushveld have become a center for deadly riots and strikes that have crippled production of the scarce metal from time to time. Russia, which holds the second largest reserves of platinum, is no stranger to political unrest.

Other favorable attributes of platinum are global demand and less attention from central banks. Emerging market demand for platinum increased 30% over the last four years. Chinese demand rose 63% from 2008 to 2012. As the standard of living rises in developing countries, their populations are demanding more transportation. More cars on the roads lead to smog and new laws requiring catalytic converters to clean it up. Platinum is the premier metal for use in automotive catalytic converters.

Central banks around the world tend to own gold as a part of their reserves. Gold investors face the risk that the banks will sell their stockpiles if prices climb too high. Platinum isn’t owned in large quantities by any central bank or government, so the risk of government interference in the market that drives down the price is considerably lower.

A complement to our metals holdings (gold, silver, and platinum) includes hard paper currencies. Hard is a relative term when talking about paper money; nonetheless a hard currency component complements a portfolio of assets denominated by inflationary currencies such as the U.S. dollar. Tops on our list here is usually the Swiss franc. The Swiss are known for running a tight monetary ship. The franc is one of a few developed market currencies with a decided long-term uptrend versus the U.S. dollar.

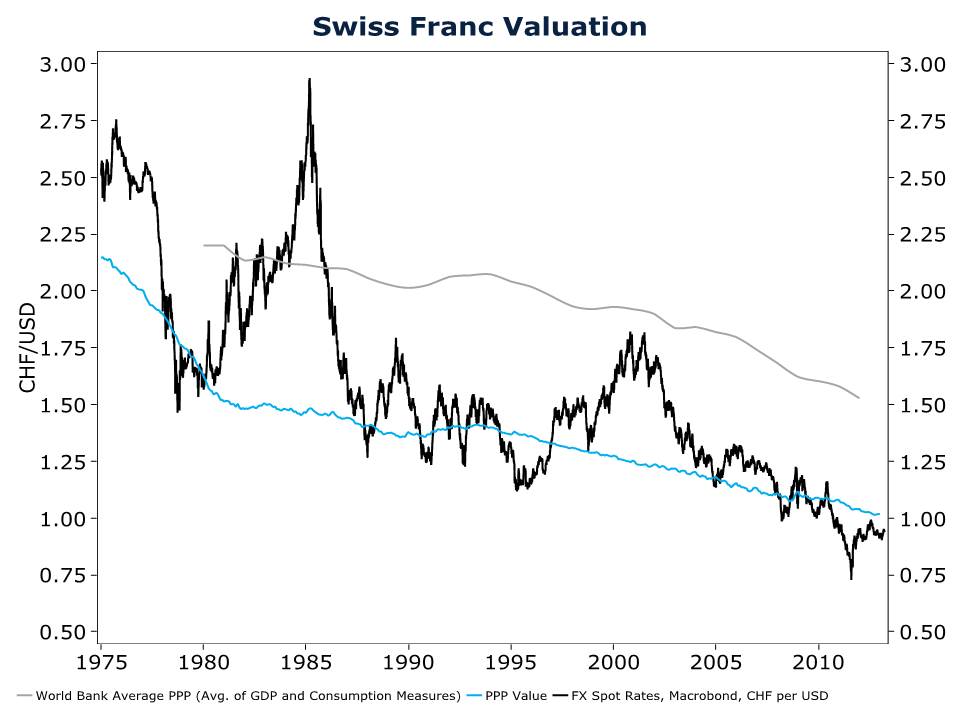
Unfortunately, with a dwindling number of truly prudent central banks, the Swiss franc is an overcrowded port in the storm. Our currency valuation work shows that safe-haven seekers have pushed the franc into considerable overvaluation territory. For new money, the franc offers limited medium-term upside. Swiss stocks are a different story, and we continue to gain exposure to Switzerland through the country’s individual, dividend-paying equities.

As an alternative to the Swiss franc, Nordic currencies have appeal. Our favored Nordic currency today is the Swedish krona. Sweden has been down the road of big government and soaring debt and is now well on its way back from that journey. Today, Sweden’s economic blueprint isn’t the socialist model that many associate with the country.

Over the last 20 years, Sweden has reduced public spending as a percentage of GDP by more than 25%. The U.S. has done the opposite. Since year-end 1999, U.S. federal spending as a percentage of GDP has risen by 28%. Sweden has also cut its marginal tax rate by 27 percentage points and eliminated a whole host of other taxes on property, gifts, wealth, and inheritance. The U.S. just raised rates on personal income and junked up the tax code with more Obamacare taxes and complicated exemption phase-outs. This year Sweden plans to reduce its corporate-tax rate to 22%. In the U.S., we can’t even manage to put together a corporate tax-reform bill to reduce the world’s highest corporate-tax rate.

Structurally, Sweden’s economy is much sounder than many of the world’s other major economic powers including the U.S., China, Japan, the United Kingdom, and the euro zone. Sweden runs a budget surplus and, according to the IMF, Sweden has a gross public debt to GDP ratio of only 37% compared to over 100% in the U.S. Looking at net debt to GDP figures, Sweden is one of the only countries in the world with a net asset position, compared to a net debt-to-GDP ratio of over 70% in the U.S. There aren’t many real AAA-rated countries in the world, but Sweden truly deserves its AAA rating.

According to INSEAD, Sweden is the world’s second-most innovative country. Sweden is also a leader in education, which bodes well for the country’s long-run structural growth. Sweden has introduced a universal system of school vouchers and the country has allowed private schools to compete with public schools. How long has the U.S. been talking about education reform and school choice?

Most important of all, the Riksbank, Sweden’s central bank, is not engaged in profligate monetary policy. Despite recent strength in the krona, the Riksbank still expects to begin raising interest rates in early 2014. On a purchasing power parity basis (a valuation measure for currencies), our work shows that the krona is one of the few rich-world country currencies still undervalued vis a vis the U.S. dollar. With the krona, investors get the one-two punch of a widening interest-rate differential and an undervalued currency. Today we gain exposure to kronor by investing in Swedish government bonds or the CurrencyShares Swedish Krona Trust.

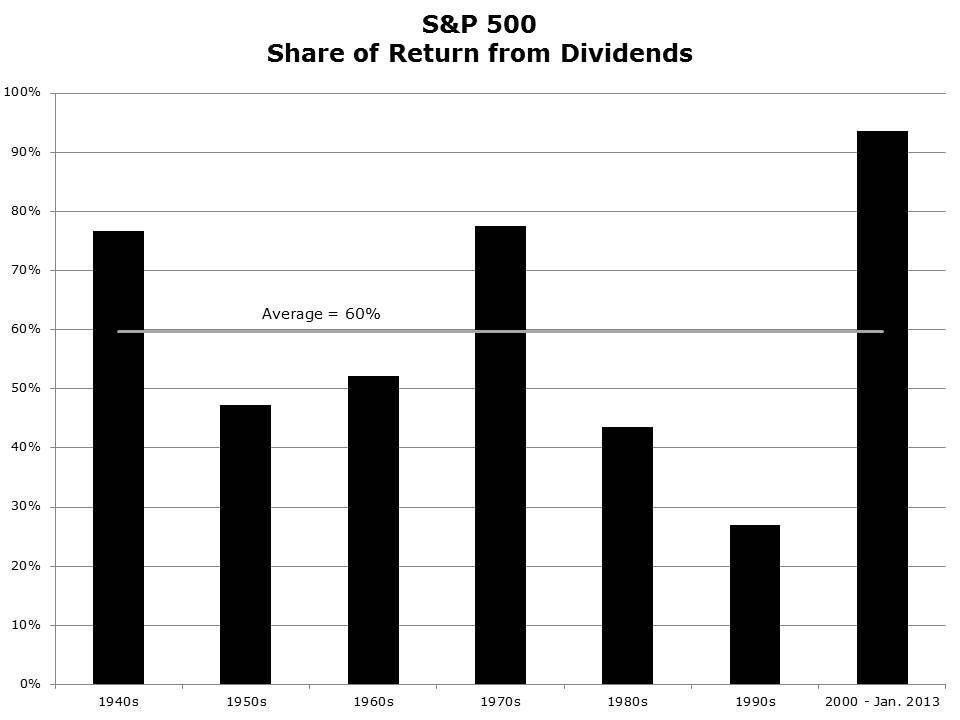
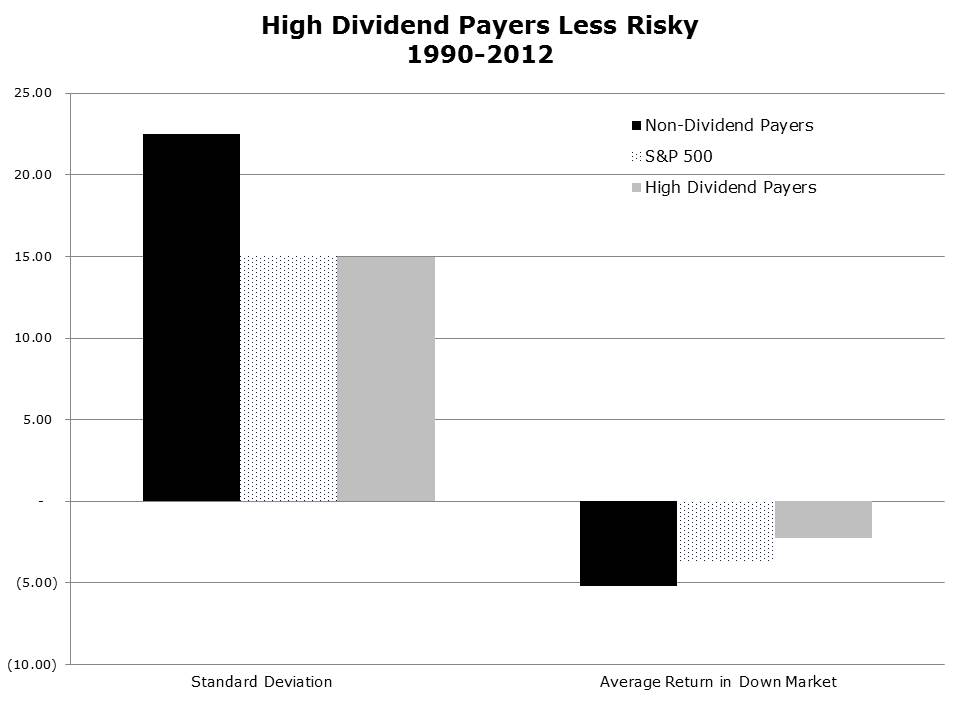
To help hedge against currency debasement and long-term inflation, we have taken positions in various metals including gold, silver, and platinum. When we believe valuation measures are in our favor, we will also take positions in foreign currencies. Today we favor the Swedish krona. To help reduce portfolio volatility, we favor short-term corporate bonds. Short-term bonds will be less susceptible to price swings once interest rates begin to rise. As I outlined in detail last month, our equity focus remains on big companies with a high barrier to entry. Industries we currently favor include consumer staples, energy, industrials, materials, and utilities and telecommunications services. From our stocks, we seek a solid record of paying a dividend and, preferably, annual dividend increases.

Have a good month. As always, please call us at (888) 456-5444 if your financial situation has changed or if you have questions about your investment portfolio.

Sincerely,

Matthew A. Young
President and Chief Executive Officer

P.S. In April you will receive your quarterly Portfolio Holdings report from our office. We have made a slight enhancement to the common stock portion; rather than list the equities in a single group, we now group the equities by industry sector and the percentage weighting the sector represents within the entire portfolio. The new format makes it easier to identify how your equities are diversified across our favored industries.

P.P.S. Sweden’s Svenska Cellulosa (SCA) is a powerhouse in Europe for developing, producing, and marketing personal care products, tissue, packaging, and forest products. SCA, the Kimberly-Clark of Europe, is the continent’s second-largest producer of corrugated board and containerboard and one of the largest producers of corrugated board in China. Additionally, SCA is Europe’s largest private forest landowner, with 6.4 million acres of forest. The rally in SCA shares has made the stock somewhat expensive in our view. For some portfolios, SCA has been reduced and replaced with two other Swedish stocks, Swedish Match and Atlas Copco.

P.P.P.S. We sold all shares in Market Vectors Brazil Small-Cap and First Trust ISE-Revere Natural Gas. With government activism on the rise in Brazil, we now believe the best way to gain exposure to the Brazilian economy is through the fixed income markets or select individual companies. With respect to the natural gas ETF, we think the prospect of abundant natural gas for years to come is likely to keep a lid on natural gas prices. As a result, a good number of players in the natural gas industry are likely to struggle with profitability. We no longer believe that an equally weighted portfolio of natural gas producers is the ideal strategy for investing in the industry.


Why You Shouldn’t Rely on Capital Gains from Stocks

February 2013 Client Letter

It’s hard to believe the S&P 500 has not kept pace with inflation during the past 15 years. Since year-end 1999, the index had an average annual return of just 2%. Even with an impressive rally since 2009, the broad-based index has been unable to recover significantly from two vicious bear markets during this period. And looking ahead does not inspire total confidence among investors, who see a lack of fiscal discipline from politicians and a Fed willing to continue with a monetary policy punitive to savers and potentially inflating another asset bubble.

Such an outlook could cause investors to throw in the towel on the stock market. While yields on CDs, money markets, and most bonds are at historical lows, at least these investments are unlikely to be subject to stock market volatility. However, an all-cash or all-bond portfolio is not without risk. Portfolios excluding equities are likely to suffer from inflation risk and income risk. For investors expecting to live for 10, 20, and 30 years or to pass assets on to heirs, these risks can be significant.

Today, the highest-yielding money market funds pay about 0.10% per year. With inflation running near 2%, a cash portfolio is not generating sufficient income to maintain its purchasing power. This is especially problematic for retired investors. Assuming a standard 4% withdrawal rate, the purchasing power of an all-cash portfolio yielding 10 basis points would fall about 6% per year (3.9% from taking more income than the portfolio generates and another 2% from inflation). It doesn’t take long to decimate a portfolio at a 6% depletion rate.

To maintain a portfolio’s purchasing power, an equity component is a must for most investors. Once the decision to buy equities is made, the question becomes what kind of equities should be bought? At Richard C. Young & Co., Ltd., dividends have always been the cornerstone of our common-stock-investment strategy. But investing in a stock just because it pays a dividend does not tell the complete story of our favored strategy. Dividend-payers offer many benefits that can provide comfort and the opportunity for long-term investment success.

A Vital Component of Stock Market Returns

A lesson learned during the past 15 years is to not rely solely on capital appreciation for stock market gains. Investors who overloaded on non-dividend-paying speculative shares before the dot-com and credit-crisis busts were not only left with decimated portfolios, but also with portfolios that produced little annual income.

Consider this: An investment in the ultra-low-yielding NASDAQ Composite Index at year-end 1999 through February 2013 is down 15%. That is more than 13 years without a positive return! Compare that to the S&P 500, which pays a higher, if still scant, yield. The S&P 500 is up 30% since year-end 1999, with almost 90% of that return coming from dividends.

Dividends are a vital component of long-term-investment returns. This isn’t a recent phenomenon. Contrary to what many investors believe, dividends and the reinvestment of dividends have always played a leading role in common-stock returns. During bull markets, including that of 2012, dividends may seem like an afterthought, but, as Chart 1 shows, over the last seven decades, dividends have accounted for an average of 60% of each decade’s stock market returns.

A Steady Stream of Income

Dividends, and especially high-dividend-yielding stocks, appeal to conservative investors and those in or nearing retirement. A continuous stream of dividends can be used for living expenses or can be reinvested at a lower share price, resulting in higher future-dividend payments. During down markets, a steady stream of cash makes it easier for investors to stay patient and wait for the next stock market rebound.

The stability of dividend returns is an added comfort to investors. Chart 2 compares the capital-gains component of returns to the dividend component of returns for high-yielding stocks. Note the stability of dividend returns compared to capital gains over the last five decades.

Higher Dividends = Lower Risk

Not only does a steady stream of dividend income provide investors with peace of mind, but dividends also translate into tangible benefits. It is no secret that investors purchase high-yielding stocks for the dividend. It is also true that investors purchasing non-dividend-paying stocks tend to focus on earnings. This isn’t exactly a revelation, but it is important because, as Chart 3 shows, dividends are less volatile than earnings. Since dividend investors buy stocks for the dividend, the stability of dividend payments translates into lower stock-price volatility.

Chart 4 shows that high-yielding stocks have been less volatile than non-dividend-paying stocks. And high-yielders have also held up better in down markets than non-dividend-payers and even broad-based indices including the S&P 500.

Dividends Not Just for Widows and Orphans

Investing in high-yielding stocks isn’t just a defensive strategy, though. Over the long run, high-yielding stocks have outperformed the broader market. Not every year of course, but, as chart 5 clearly shows, over the long run the highest-yielding quintile (top 20%) of stocks beat the market. As always, it is wise to remember that past performance is no guarantee of future results.

Dividend Payers as an Inflation Hedge

With the Federal Reserve and other global central banks pumping trillions of dollars into the global financial system while holding interest rates at zero, the risk of accelerating inflation is high. To help guard against the threat of rising inflation, we invest in gold and other hard assets, but we also buy stocks. While stocks aren’t the first asset that most turn to as an inflation hedge, over the long run, stocks do indeed maintain their purchasing power.

Stocks maintain their purchasing power during inflationary episodes because they are real assets. When inflation rises, the revenues, earnings, and dividends of companies also rise—not always immediately, but usually over time (Chart 6). As corporate fundamentals strengthen, so too do corporate values.

But you don’t just want to own any stocks during an inflationary episode. Historically, the high-yielding stocks have been the ones more resistant to the corrosive effects of inflation. Chart 7 shows that, during the inflationary 1970s, high-yielding stocks earned a higher inflation-adjusted return than did large-capitalization stocks.

Durable Businesses

Dividend-paying companies are often more durable businesses than are non-dividend-payers. Payers often have higher barriers to entry and stronger balance sheets than do non-dividend payers. And because there is a stigma associated with cutting dividend payments, the consistent payment of dividends is a signal of management confidence in the future prospects of a company. This is especially true of companies that raise dividends. Management teams rarely commit to higher dividend payments unless they are confident the dividend can be maintained through thick and thin.

Earnings Quality

Cold hard cash in the form of quarterly dividend payments gives investors confidence in a company’s earnings quality. Companies can manipulate and fake earnings through creative accounting techniques, whereas regular dividend payments can’t be faked.

Dividends Discipline Management

And contrary to conventional wisdom (and basic finance theory), empirical research shows that companies returning more earnings to shareholders in the form of dividend payments often have greater earnings growth. Why? Isn’t it true that the fastest-growing companies often pay no dividends at all? Indeed it is and, while the research isn’t settled on this, one of the more plausible theories as to why higher dividends result in higher earnings growth is that high dividend payments create a scarcity of capital. The management teams of companies paying higher dividends might be forced to allocate capital more efficiently. At non-dividend-paying companies, where retained earnings are abundant, management teams may be more likely to make questionable acquisitions or invest in marginally profitable expansion projects that hurt profitability. With a scarce supply of capital, management teams at companies paying higher dividends must choose only the best opportunities.

Richard C. Young & Co., Ltd.’s Dividend Strategy

When investing in dividend-paying securities, our goal is not simply to choose the highest-yielding stocks. Yield alone is not the best indicator of future stock performance. A high-dividend yield can be a warning sign that the dividend may be unsustainable or that the dividend-paying company is not growing. Data show that an investment strategy that buys the highest-yielding 10% of the stock market and rebalances annually delivers investment returns that trail stocks with high, but not the highest, yields. Chart 8 shows the compound annual return from 1970–2012 of five portfolios based on dividend yield alone. As you can see in the chart, the portfolio including stocks from the highest-yielding portfolio actually earned less than did the other four.

At Richard C. Young & Co., Ltd., an important feature of our investment strategy is to find companies with a strong record of regular dividend increases. As outlined earlier, companies with annual dividend increases are most often confident about their future earnings, tend to be stable businesses well positioned in their markets, and are able to perform through various business cycles.

Have a good month and, as always, please call us at (888) 456-5444 if your financial situation has changed or if you have questions about your investment portfolio.                                                                                                           

Sincerely,

Matthew A. Young

President and Chief Executive Officer


Your Questions, Our Answers

January 2013 Client Letter

Are you familiar with the U-6 unemployment rate? The “U-6” rate is one of many different unemployment numbers released by The Bureau of Labor Statistics each month. However, the unemployment number referenced by the government and the media is known as “U-3”. The differences between the two numbers are significant.

U-6 Unemployment Rate vs. U-3 Unemployment Rate

The U-6 includes two groups of people not found in the U-3: 1. “Marginally attached workers” or people who are not actively looking for work, but who have indicated they want a job and have searched for work in the past 12 months. Also included in this group are “discouraged workers” who have given up looking for a job. 2. People looking for full-time work but have settled for part-time work due to economic reasons.

Both groups are fairly important when attempting to gauge the U.S. unemployment situation. In December 2012, the U-6 rate remained at historically high levels—14.4%—while the U-3 came in at 7.8%.

Without factoring in possible upward revisions, 2012 created fewer jobs than 2011 despite help from fiscal and monetary stimulus. And much of the stimulus is expected to expire or be wound down in 2013, making prospects for this year challenging. The payroll tax cut responsible for putting more money in 77% of Americans’ pockets each week expired, as have tax breaks for the most productive Americans (those earning more than $400,000).

On the following chart, you can see the Conference Board’s Index of Coincident Indicators is developing a downward year-over-year trend. The index comprises indicators similar to those used by the National Bureau of Economic Research to determine the beginning and end of a recession. Unless the index improves, the U.S. economy could be in for tough times ahead.

As we begin a new year, investors will be paying close attention to the employment rate and various other economic indicators to gauge the health of the U.S. economy. Additionally, the actions of the Fed and the outcome of the fiscal negotiations will play a role in how the economy fairs. Combined, these issues generate questions from investors on how best to react to a still uncertain environment. Following are many of the questions I have been asked about our current investment strategy and what we advise.

Are there any changes to your Retirement Compounders program as a result of the tax increase on dividends for some individuals?

Our dividend-focused investment strategy will not change as a result of the higher tax rate. Until 2002, dividends were taxed as ordinary income and dividend payers still delivered some of the market’s strongest risk-adjusted returns.

WisdomTree looked at the after-tax return of the highest-yielding 30% of stocks in the market during various dividend tax regimes. From 1943 to 1963, the highest dividend tax rate averaged about 91%. During this period the highest-yielding stocks (again top 30%) returned 9.84% after tax compared to a return of 9.74% on the market and 9.19% on the lowest-yielding (bottom 30%) stocks. From 1963 to 1981, the highest dividend tax rate averaged 70% and the highest-yielding stocks earned an after-tax return of 4.63% compared to 4.79% for the broader market. From 1981 to 2002, the highest dividend tax rate averaged 39.5% and high-yielding stocks earned 13.4% after tax compared to 10.88% for the broader market.

According to WisdomTree, U.S. retirement accounts hold about $8 trillion worth of equities. That is equal to about half of the market capitalization of U.S. stocks. Retirement accounts are obviously exempt from taxes, so a higher dividend tax rate doesn’t impact their return on dividend stocks. If taxable investors decide to sell their dividend payers because of the higher tax rate, investors in tax-deferred accounts would likely step in to support the values of dividend-paying securities.  

 With taxes going up, will you be investing in municipal bonds?

We have no plans to invest in municipal bonds. While tax rates are one consideration when investing in municipal bonds, there are others factors to take into account. First and foremost is credit risk. State and municipal budgets have improved since the depths of the financial crisis, but they remain strained. In our view, the risk of default in the municipal bond sector is still greater today than it has been in decades past.

We continue to favor corporate bonds over municipals. Company profit margins are near record highs and corporate balance sheets are the strongest we have seen in years. On a tax-equivalent basis (assuming a 39.5% highest marginal rate) 5- to 10-year municipals yield only 2.61% vs. 2.88% for similar maturity corporates. And with corporates, you aren’t faced with the risk of sharp losses if Washington decides to tax municipal bond interest as part of a tax code overhaul.

 What market index do you use to benchmark performance?

We don’t use indices to benchmark the performance of our clients’ portfolios. We benchmark portfolios based on our clients’ investment goals and tolerance for risk. We find that investors and investment managers who obsess over beating the market year in and year out often lose sight of the purpose of investing.

The goal of investing is not to boast to your friends and family that you beat the market.  Beating the market by 2% isn’t such an impressive feat if the market has cratered 35%. The purpose of most investing is to fund a future liability—to generate retirement income, to buy a vacation home, to pass money on to heirs, or to fund the grandkids’ college tuition.

An index such as the S&P 500 is used to track the performance of large-capitalization stocks, not to plan for a comfortable retirement. The benchmarks we use to manage portfolios are more closely related to our clients’ investment objectives. By example, the point of the benchmark for many of the portfolios we manage is to provide a stream of current income with reduced risk while maintaining the purchasing power of future income and capital.

If you are meeting your objective to generate income and maintain purchasing power, does it really matter how the S&P 500 performs? If your goal is income, the S&P 500 and other indices like it are probably the least useful. Investors interested in income are probably going to buy more high-dividend-paying stocks than are included in the S&P 500. And investors looking to reduce risk will most likely include a significant allocation to fixed income. Finally, investors looking to maintain purchasing power might want to include gold and other hard-currency-denominated assets in their portfolio. You won’t find any of these asset classes in the S&P 500.

I have funds to invest but feel I should wait. When should I get into the market?

I suggest investors look at their total assets in various groups. Groups could include your house, real estate investments, investment portfolio, cash, and life insurance, etc. Each group serves a different purpose and varies in risk. If you have cash that is intended for the investment portfolio, then add it to the portfolio. If nothing else, you’ll be in a position to collect dividends.

Bond yields are near historic lows and bond prices will decline when interest rates eventually rise. Yet you continue to favor a bond component for most portfolios. It seems there are better places to invest than in bonds.

 Long bond prices could decline dramatically when interest rates rise, but short-term bonds should not be impacted much by higher rates. Consider, by example, a portfolio of bonds with a duration of two. A one percentage point rise in interest rates translates into a manageable two-percentage-point drop in price. And that two-percentage-point drop in price is offset by interest collected on the portfolio of bonds.

Our strategy with bonds is to keep maturities short and roll maturing bonds into higher coupon bonds as rates rise. While bond yields are in the basement today, they will not remain near zero forever. Long before the Fed begins to raise the federal funds rate (current target date is mid-2015) bond yields will begin to rise.

And while it is true that bonds don’t offer much in the way of income today, they add stability to a portfolio and reduce risk.  

With the problems in the U.S., doesn’t it make sense to invest more in foreign markets?

We craft globally diversified portfolios that include a substantial foreign component and will continue to do so in the future. But even with all the problems facing the U.S., in our view a significant allocation to domestic securities remains a prudent approach. Why? Most U.S. investors are also U.S. residents, and so the vast majority of their expenses are denominated in U.S. dollars. If a retired U.S. investor puts all of his money in non-dollar-denominated assets and all of his expenses are denominated in dollars, he is at the mercy of foreign-exchange markets. What happens to this investor if the dollar soars versus foreign currencies? Will he be able to fund his expenses with his now depreciated non-dollar-denominated assets? There are benefits to international diversification, but too much in any sector or country is not advisable.

What mistakes are investors making today?

Some of the more common mistakes we are seeing today include reaching for yield and getting too aggressive. With today’s ultra-low yield environment, some income-oriented investors are reaching for yield in long maturity bonds or in the lowest-quality sectors of the bond market. It is indeed possible to boost yield with such a strategy, but the extra yield adds an extraordinary amount of risk. By example, if interest rates rise by only 50 basis points on a 30-year Treasury bond (a level we saw in April 2012), the drop in price on the bond would wipe out more than three years’ worth of interest. And a one-percentage-point rise in rates would wipe out over six years’ worth of interest.

We are also seeing early signs of investors taking on more risk in equities than they can most likely afford. This tends to happen during periods of extended stock market appreciation. During bull markets, investors’ beer muscles come out; but as soon as the next bear market hits, the buzz wears off and nausea sets in. Getting more aggressive in the midst of an extended bull market can lead to undesired and unpleasant results.

How do we fight against inflation?

Inflation has the potential to become an enormous issue for investors. We employ a multi-pronged strategy to guard against a potential wealth-destroying assault from inflation. On the fixed income side of portfolios, we keep bond maturities short. Shorter maturities dampen the impact of higher inflation on bonds. As inflation begins to rise, bond investors will demand higher interest rates to compensate for greater inflation. As short-term bonds mature, they are reinvested at higher interest rates.

On the equities side of portfolios, we invest in industries with pricing power. Inflation does not have to be a problem for companies with the ability to pass on higher costs to their customers. Branded consumer products companies tend to have reliable pricing power. As do utilities and pipeline companies. We also invest in natural resource companies, which are often the first to benefit from higher inflation.

To further guard against inflation, we invest in precious metals and foreign currencies. Precious metals are hard assets that retain their purchasing power over long periods of time. Foreign currencies serve a similar role. All else being equal, a relative increase in U.S. prices will result in a depreciation of the U.S. dollar, thereby benefiting foreign currencies.

Have a good month, and, as always, please call us at (888) 456-5444 if your financial situation has changed or if you have questions about your investment portfolio.

Sincerely,

Matthew A. Young

President and Chief Executive Officer

P.S. We believe proper industry selection is an important component to long-term investment success. While we certainly favor a diversified portfolio, we are not looking to invite everyone to the table. Industries currently of interest include consumer staples, pipeline companies, rails, regulated utilities, and timber. On the other hand, technology, airlines, restaurants, and clothing manufacturers lack appeal.

P.P.S. Investing internationally comes with several risks, including currency risk. Recently, some investment professionals point to Japan as a good short-term play, in part because of the Nikkei 225 stock index’s depreciated value compared to the Dow Jones Industrial Average. However, it’s also important to factor in the outlook for Japan’s currency, the yen. Since its recent trough in early October, the Nikkei has risen 24%. But the yen has depreciated by 12% against the dollar during the same period, wiping out half the gain for U.S. investors. If Japan’s central bank continues to print money, the yen could have a further decline versus the dollar. It is also worth noting that Japan’s gross government debt is 240% of the country’s economic output.

P.P.P.S. Most of the stocks in our Retirement Compounders equity portfolio raise their dividends annually. Annual increases in dividend payments is an automatic inflation fighter and a feature that does not exist with bonds whose interest payments are fixed.


Dining with Former BB&T Chairman John Allison

November 2012 Client Letter

This month I had lunch with retired BB&T Chairman and CEO, John Allison. Speaking with John was a special privilege given his unique background in the financial industry. John was the longest-serving CEO of a top-25 financial institution, serving BB&T from 1989 through 2008. During his 20-year term, BB&T grew from $4.5 billion to $152 billion in assets, becoming the 10th-largest financial services holding company headquartered in the United States.

In his book, The Financial Crisis and the Free Market Cure, John explains his bank’s relative success during various crises over the years:

BB&T has maneuvered through the financial storm extraordinarily effectively without experiencing a single quarterly loss. We avoided all the major excesses and irrationalities of the industry. Of course, BB&T has been negatively affected by the economic environment, as banks reflect the financial health of their clients and BB&T’s core business is real estate related. However, we have nothing for which we need to apologize. I was in charge of BB&T’s lending business during the significant recession of the early 1980s and CEO during the last major real estate correction in the early 1990s. BB&T weathered both of these storms extremely successfully.

With the elections now over, investors face the potential for a variety of policies that will make investing a challenge and could further regress Americans’ standard of living.

John said he used to believe the Federal Reserve was second only to Congress in destroying wealth and well-being. Now he believes the Fed has moved into first place. However, one need not be a former banker or an investment advisor to realize today’s harmful Fed policies.

Most would agree that low interest rates are one way to jumpstart a stalled economy. The Fed, though, has implemented a strategy where, if lower rates are good, then zero rates must be better. While a brief stint at zero rates may be necessary during emergencies, such as during the peak of a crisis, the Fed has now kept rates at zero for four years!

For retired and soon-to-be retired investors, the Fed’s policy has been a disaster. A zero-rate policy makes traditional low-risk investments—including CDs, money markets and short-term Treasuries—unattractive to savers. Federal Reserve Chairman Ben Bernanke appears to view the zero-rate environment as a benefit, hoping investors will abandon the idea of pursuing safer returns and instead put their savings into equities. If more funds are allocated to the stock market, then stock prices should rise. This strategy has the potential to destroy personal wealth if investors over-allocate to the stock market and the market experiences a correction.

Of course, not all investors will play the Fed’s game. Witnessing markets losing half their value twice in the last dozen years will prevent some from speculating. Instead, these investors will opt to save more and spend less. Their reduced spending will be a drag on economic growth. Growth in the economy is further slowed by Bernanke’s flooding the market with dollars. The strategy is to flood money into the system and hope the cash will find its way to stocks, increasing their value. The problem here is that investors become concerned about dollar debasement and invest heavily into commodities. Heavy commodity investment results in a rise in food and energy prices. I can’t think of too many events that can slow an economy more than rising energy prices.

On November 9, Barack Obama said, “We can’t just cut our way to prosperity. If we are serious about reducing the deficit, we have to combine spending cuts with revenue—and that means asking the wealthiest Americans to pay a little more in taxes.”

As congressional leaders and the White House negotiate on the fiscal cliff, we are hearing a lot about raising taxes on the “rich.” The debate has morphed from whether or not to tax the rich into how to tax the rich. Apparently a majority of Americans bought into the president’s dubious campaign pitch about taxing millionaires and billionaires to solve the budget crisis. And, based on the media’s coverage of the fiscal cliff, they did too. That’s a shame, because America doesn’t have a revenue problem. It has a spending problem.

You don’t have to be a budget gnome to recognize our problem is profligate government spending, not low taxes. As the president is fond of saying, it is just arithmetic.

Pre-Obama, federal spending averaged 19.9% of GDP and federal revenue averaged 17.6% of GDP. That still leaves a modest deficit, but a deficit equal to about 2.3% of GDP is sustainable. To get back to a sustainable budget, a fiscal-cliff deal should target federal spending of about 20% and federal revenues of 17.5% to 18%, both relative to GDP.

Today, federal spending amounts to 23% of GDP and federal revenue, 15.5%. So spending is three percentage points above its long-run average, and revenue is two percentage points below its long-run average. But if you add back revenue from the payroll tax holiday that both parties agree should expire at year-end, federal revenue is actually 16.2% of GDP. Still below the historical average we should be shooting for, but don’t forget the economy is still floundering.

Unemployment is nearly 8% and GDP growth is limping along at less than 2%. In a more robust economy, the Bush tax code could easily generate 18% of revenue. In fact, with today’s very same tax code, federal revenue was 17% of GDP in 2005, 18% in 2006, and 18.2% in 2007. The structure of tax rates is not the problem. The problem is economic growth—or lack thereof, to be more specific. Even the Congressional Budget Office (CBO) recognizes that the Bush tax rates would generate plenty of revenue if the economy was stronger.

The CBO forecasts that if the Bush tax rates were made permanent and economic growth picked up, federal revenue would rise to 17.2% of GDP in 2014, 17.8% in 2015, and 18.1% in 2016.

So why are the president and his allies in Congress so resolute on tax hikes? Beyond extracting a pound of flesh from the “rich” to satisfy their base, they want to expand the size and scope of government. Look no further than the president’s own budget (chart below). If the president had his druthers, by 2022, federal revenue would rise to more than 20% of GDP, and federal spending would rise to a permanently higher plateau of 23% of GDP.

Richard Rahn, Chairman of the Institute for Global Economic Growth recently wrote the following. “When the president says, ‘We can’t just cut our way to prosperity,” he is ignoring the fact that much, if not most, of government spending does not meet the test of the highest and best use for the money. It does not even meet a much lower standard of spending benefits exceeding their costs. For example, Congress has extended the number of weeks that a person can receive unemployment benefits. It sounds like the humane thing to do, but many economic studies show that a high percentage of unemployed people do not really get serious about taking a job until near the end of the benefit period. The longer the period people can receive unemployed benefits, the longer people tend to stay out of work. The longer people are unemployed, the more apt they are to drop out of the work force. At first glance, extending unemployment benefits seems compassionate, but it is actually both destructive for the economy and the individual—like so many other government programs.”

As has been true through most of America’s modern political history, higher tax revenues are a ruse to expand the size and scope of government. Unfortunately, as best we can tell, a majority of Americans are still in the dark.

Those who are not in the dark understand that the fastest way to raise revenue is with faster economic growth. Growth would be achieved with lower taxes and a simplified tax code, less costly regulation, and monetary stability. The Federal Reserve should not focus on multiple monetary policy goals, but should instead concentrate solely on maintaining the stability of the dollar.

Based on the current monetary policy as well as the current tax and regulatory environment, we continue to favor an investment strategy that includes short-term corporate bonds, gold and foreign currencies, and a significant portion of equities focused on higher-quality, dividend-paying companies.

Have a good month and, as always, please call us at (888) 456-5444 if your financial situation has changed or if you have questions about your investment portfolio.

Sincerely,

Matthew A. Young

President and Chief Executive Officer

P.S. I write this after having just seen Florida Governor Rick Scott at breakfast at organic market and café Food and Thought here in Naples. Normally, I would have approached the governor, but I am aware of his mother’s recent passing and did not want to bother him. Obviously Governor Scott is in the center of attention right now as he deals with ObamaCare and whether Florida will create a health-insurance exchange. States will also have to decide whether to implement the law’s massive expansion of Medicaid. State-created exchanges mean higher taxes, fewer jobs, and less protection of religious freedom. States are better off punting the exchange creation back to the federal government.

P.P.S. The Wall Street Journal op-ed carried a piece call Saudi America. In its annual world energy outlook, the Paris-based International Energy Agency (IEA) says the global energy map “is being redrawn by the resurgence in oil and gas production in the United States.” According to the WSJ, the U.S. will increase its production to about 23 million barrels a day in 10 years from about 18 million barrels a day now. That’s more optimistic than current U.S. government estimates and a change from a year ago when the IEA said Russia and the Saudis would vie for number one.

P.P.P.S. A central investment theme for us is high-barrier-to-entry businesses of companies that pay dividends. Two examples include Norfolk Southern and Kimberly-Clark. Norfolk Southern operates approximately 20,000 route miles in 22 states and the District of Columbia, and serves every major container port in the eastern United States.

A new competitor for Norfolk would need thousands of miles of rail beds and right-of-ways. This would be nearly impossible for a competitor to replicate. Kimberly-Clark increased its dividend by 6% in 2012, the company’s 40th consecutive annual-dividend increase.


Why We Favor Stocks over Mutual Funds

October 2012 Client Letter

For some time, we have been disillusioned with much of the mutual fund industry. Aggressive sales tactics, front-end sales loads, 12b-1 marketing fees, and high expense ratios practiced by many fund groups seem far from investor friendly. The sad reality is most mutual funds are not bought by investors, they are sold to investors. And the most popular funds are too often those that offer the greatest payout to brokers.

It should come as no surprise, then, that the nation’s largest actively managed equity mutual fund is Growth Fund of America—a $116-billion behemoth with a 5.75% front-end sales load and a 25-basis-point 12b-1 fee. With $116 billion under management, the fund can only take a meaningful stake in about 100 U.S. stocks (without buying more than 5% of that company’s shares). Any objective assessment of the Growth Fund of America would recognize that it could be nothing more than a closet index fund. It is just too big. Unfortunately, the promoters selling the fund aren’t objective. The fund gets jammed into millions of accounts, requiring investors to fork over 5.75% of their assets up front, and then to pay an annual expense ratio for a fund that for all practical purposes is no different from the ultra-low-cost Vanguard 500 Index Fund.

To help our clients avoid the pitfalls of mutual fund investing, we buy only funds with no loads, no 12b-1 fees, and low expense ratios. But as our longtime clients can attest, our reliance on mutual funds has waned over the years. The problem is that successful no-load, low-expense-ratio funds often become too large and suffer from the same limitations as the Growth Fund of America. We would put the Dodge & Cox group, a family of funds we have used in the past, into this category.

Other low-fee, no-load fund groups have caved to the pressure to deliver strong short-term results and have decided to take a benchmark-centric approach to portfolio management. The raison d’être of this crowd is to beat the benchmark—at all costs. This is a perilous strategy. Consider the example of the Legg Mason Value Trust—a fund we’ve never liked. The Legg Mason Value Trust became popular after beating the S&P 500 for a record 15 consecutive years. But since the streak ended in 2005, the fund has trailed the S&P 500 by a cumulative 60 percentage points. That has turned its 20-year performance record from hero to has-been.

Our growing dissatisfaction with the mutual fund industry is one of the reasons we have decided to decrease the allocation to equity funds and increase the allocation to common stocks. We have recently begun shifting assets from equity funds and ETFs into our Retirement Compounders (RCs) equity portfolio. Funds and ETFs will continue to remain a component of equity portfolios, but now they will play only a supporting role.

A greater allocation to the RCs will enhance our dividend-focused strategy without sacrificing sector and geographical diversification. In many cases, the yield on the RCs is greater than the yield on the funds and ETFs we are selling. By example, one of the funds we have been selling is iShares Switzerland. iShares Switzerland pays a 2.6% dividend yield. The Swiss stocks we are buying in RCs portfolios have an average yield of 4.26%.

In conjunction with the increased allocation to the RCs, we are also expanding the number of stocks in RCs portfolios. We’ve long advised 32-stock portfolios. With a 32-stock portfolio, you achieve 90% of the diversification of owning all NYSE-listed stocks—or at least you used to. Our favored 32-stock portfolio target was based on studies of the U.S. stock market in a period when high-frequency trading and ETFs didn’t play a dominant role in equity markets (that was only a few years ago). Over recent years, market structure has changed considerably.

High-frequency trading (HFT) now accounts for 70% of volume, and ETFs account for as much as two-thirds of all trading volume. The proliferation of HFT and ETFs has led to a near tripling in the average correlation among S&P 500 stocks. Increased correlation means that a 32-stock portfolio no longer provides as much diversification as it once did. To achieve maximum diversification today, a larger portfolio is necessary.

A larger stock portfolio also provides more opportunity for global diversification. Not long ago, an equity portfolio made up of strictly U.S. stocks provided ample diversification. Today, a properly diversified portfolio means a globally diversified portfolio. There are about 40,000 publicly traded companies of size in the world. Over 85% of those companies are domiciled outside of the United States. In the context of an investment universe that includes 40,000 stocks, a 32-stock portfolio can be limiting.

To improve diversification and better cover the global equity landscape, we are expanding the number of stocks in RCs portfolios. Since the correlation among stocks continues to fluctuate, we have decided to move away from a fixed number of positions and instead buy no fewer than 40 stocks.

Why We Are Buying Swisscom Stock

Some of the new names that we have been adding to portfolios recently include, among others, Swisscom, Bank of New York Mellon, UPS, and Norfolk Southern.

Tracing its roots back to 1852, when the state-owned PTT (post, telegraph, and telephone) was founded, Swisscom is Switzerland’s leading telecommunications provider. The company provides a full range of telecommunications products and services, including fixed-line telephone, mobile communications, broadband, and digital television. Swisscom became a publicly traded company in 1998, when the Swiss Confederation (the Swiss federal government) floated shares of the company. The Swiss Confederation remains Swisscom’s largest shareholder, with a 57% stake in the company.

Today, Swisscom provides service to 6.1 million mobile customers and 1.7 million broadband customers. Swisscom boasts a 62% market share in mobile, 55% in broadband, and it is Switzerland’s largest provider of digital television, with a market share of 25%.

Unlike many of the leading European telecommunications companies, Swisscom generates 80% of its revenue and all of its cash flow domestically. The focus on Switzerland helps insulate Swisscom from the recessionary conditions in much of Europe. The company does own Fastweb, an Italian broadband provider, but Fastweb accounts for only 20% of revenue, and a minor portion of Swisscom’s value.

Swisscom is a shareholder-friendly company with a generous payout policy. The company aims to distribute half of its operating free cash flow to shareholders, with the goal of not paying a dividend that is lower than it was in the previous year. Its secondary goal is to return capital to shareholders through share buybacks. Swisscom shares offer an attractive dividend yield of 5.75%.

Why We Are Buying Bank of New York Stock

Bank of New York Mellon was founded in 1784 by Alexander Hamilton. Today, it is a leading global financial services company focused on helping clients manage and service financial assets. The bank operates in 36 countries and serves more than 100 markets. At year-end 2011, BNY Mellon had $25.8 trillion in assets under custody and administration, and $1.26 trillion in assets under management. The company also serviced nearly $12 trillion in outstanding debt and processed global payments averaging $1.5 trillion per day.

BNY Mellon isn’t like your typical bank, but it has been painted with the same brush by investors. Most banks generate the bulk of their earnings from interest income. Banks take in low-interest-rate deposits and lend at higher interest rates, pocketing the difference. But at BNY Mellon, almost 80% of revenue comes from fee-based businesses that are vital to the global financial system. BNY Mellon and its chief competitor, State Street, serve as the plumbing of the global financial system. It is instructive to note that BNY Mellon and State Street were two of the nine banks included in the first tranche of Troubled Asset Relief Program (TARP) investments, even though both banks were well capitalized at the time. The Treasury department clearly recognized the vital role that BNY Mellon and State Street play in the global financial system.

BNY Mellon is a dominant global financial services powerhouse with a solid balance sheet (the best-capitalized bank in the Fed’s last round of stress tests) that generates almost 80% of revenue from fee-based businesses, but it doesn’t get much respect from investors. The shares change hands at less than 11 times the value of BNY’s depressed earnings. And unlike many companies in America today, BNY Mellon’s profit margins aren’t bordering on cyclical highs. Just the opposite, in fact. When the economy improves and interest rates eventually rise, BNY Mellon’s margins should expand.

The stock also offers investors the potential for a big dividend hike. Currently, the bank is returning less than 25% of earnings to shareholders in the form of dividends. Prior to the financial crisis, a payout ratio of 40% was the norm. In a normalized economic environment, we look for a payout ratio near 40%. If BNY Mellon distributed 40% of earnings to shareholders today, the stock would yield 3.6%.

What We Like About UPS Stock

The predecessor to UPS was founded in 1907 by Jim Casey, who borrowed $100 from a friend to start his American Messenger Company in Seattle. In those days, most deliveries were made on foot, and the company would deliver just about anything, including trays of food from restaurants. Even in the face of stiff competition, the company took off by basing its business on the slogan “best service and lowest rates.”

Today, UPS is the world’s largest package delivery company and a leader in supply chain management. UPS provides air and ground services to customers in more than 220 countries. It has 2,773 operating facilities worldwide and 62,000 retail access points. The company’s fleet of almost 99,000 vehicles delivered 4 billion packages and documents in 2011. On an average day, UPS completes 1.1 million pickups, and 7.7 million deliveries. UPS is currently in talks to acquire TNT Express. TNT operates 30,000 road vehicles, 46 freight airplanes, and 2,300 depots around the world. The deal would give UPS the largest market share in the EU among logistics and transportation companies.

Investing in Norfolk Southern

The history of Norfolk Southern railroad began in 1826 in Quincy, Massachusetts, where the Granite Railway Co. built the country’s first commercial railroad. The Granite Railway was built to move granite blocks to the Bunker Hill monument in Boston. A year later, Southern Railway, another future component of Norfolk Southern, was chartered. On Christmas Day in 1830, Southern ran the nation’s first scheduled passenger train. In 1838, a nine-mile link between Petersburg and City Point, Virginia, would become the foundation of the third major component of Norfolk and Western Railroad. Hundreds of mergers later, these three railroads and all the others would become Norfolk Southern.

Today Norfolk Southern crisscrosses the entire Eastern half of the United States, with rails travelling through the metropolises of the Mid-Atlantic States, the industrial heartlands of the Great Lakes region, and the agricultural hubs of the Deep South. Norfolk Southern operates 36,302 track miles and owns or leases 4,134 locomotives. Those engines pull the 87,715 freight cars owned or leased by Norfolk. Norfolk is the highest-yielding railroad in America with a current yield of 3.20%.

The goal of our RCs program is to provide clients with a professionally managed, globally diversified portfolio of high-dividend-paying stocks that have a history of dividend increases. Investing in companies with high dividends today and dividend growth tomorrow is a strategy that appeals to retired and soon-to-be-retired investors. High-dividend payers tend to reduce downside volatility in bear markets, and dividend growth helps keep pace with inflation.

We further bolster the RCs program by selecting companies with strong balance sheets, durable businesses, and sustainable competitive advantages (think businesses with high barriers to entry and strong brands).

Have a good month, and as always, please call us at (888) 456-5444 if your financial situation has changed or if you have questions about your investment portfolio.

Sincerely,

Matthew A. Young

President and Chief Executive Officer

P.S. The Cato Institute’s Chris Edwards has reported in the Fiscal Policy Report Card on America’s Governors 2012 that four governors earned an A grade for their efforts to reform their states’ taxes and spending. Those governors are Sam Brownback of Kansas, Rick Scott of Florida, Paul LePage of Maine, and Tom Corbett of Pennsylvania. These governors have all pursued and achieved tax cuts and relief measures, making their states more competitive for business and raising the standard of living for residents. Brownback told the Associated Press that he had lots of taxes to choose from when he came into office as governor. But he focused on corporate income taxes because he wanted to generate growth in the most efficient way by cutting taxes for small businesses. The Brownback plan lowered the state’s income tax rate from 6.45% to 4.9% and eliminated taxes on 190,000 small businesses.

P.P.S. Due to an issue with our telephone service provider, Cox Communications, our Rhode Island office recently experienced several hours of interrupted telephone service. Please note that our Naples office uses a different service provider and should be available in this type of situation. The telephone numbers for both offices are (800) 843-7273 (Newport) and (888) 456-5444 (Naples). Also, when one of our offices is unavailable, we will update our website, www.younginvestments, with instructions for contacting us.

P.P.P.S. Enclosed in this month’s letter is a reprint from Barron’s magazine listing Richard C. Young & Co., Ltd., among the top independent financial advisors in the nation for 2012. We thought you would find this of interest.


The Sweden Solution to Weak Growth

September 2012 Client Letter

Few would accuse Sweden of being a free-market utopia. Not with a top marginal rate of 57% for personal income tax and government spending equal to 56% of GDP. However, during the last two decades, Sweden cut its public debt to 33% of GDP from a high of nearly 80%. Last year, Sweden eliminated its deficit. And for good measure, the Prime Minister, Fredrik Reinfeldt, recently announced his intention to cut the corporate tax rate from 26.3% to 22% (The U.S. corporate tax rate is 35%).

When announcing the proposed cuts, Mr. Reinfeldt labeled the corporate income tax as “probably the most harmful tax of all,” because of its negative impact on job creation and business investment. Corporate taxes can lead to double taxation when profits are taxed at the corporate level and taxed again when they are distributed as dividends.

Today, Sweden is in a strong fiscal position in part because the country side stepped the worst of the 2008 financial panic and avoided the Keynesian policies practiced by many other countries. Sweden’s conservative finance minister, Anders Borg, responded to the 2008 financial crisis with a permanent tax cut to speed recovery. In general, Borg aims to reward work by cutting income-tax rates, pushing retired people back into the labor market by reducing some government benefits, and promoting productivity by increasing competition.

The U.S. could certainly use a dose of Borg economics. Weeks of unemployment is a solid measure of the health of the economy and structural employment. Our chart gives you a bird’s-eye look all the way back to 1948—that’s a lot of history.

Today, shockingly, you can see Americans are unemployed at twice the historical norm in terms of number of weeks unemployed. We have never witnessed as ugly an employment scene as we have today. The current administration favors a strategy of income redistribution through higher taxes. Such a strategy should concern everyone, especially those who are retired and soon to be retired.

Another concerning strategy, and one most likely not in the Borg playbook, is the one currently being implemented by Ben S. Bernanke. At its last policy meeting, the Fed announced it would restart the printing press at a rate of $40 billion per month. The newly printed money will be invested in mortgage-backed securities (since the Fed has already nationalized most of the Treasury market). Including the extension of Operation Twist, the Fed will buy $85 billion per month in long-term securities. The Fed also announced it will hold interest rates at zero until at least mid-2015.

So even though QE II, 0% interest rates, a commitment to hold rates at 0% for what seems like forever, Operation Twist I, and Operation Twist II have had almost no discernible impact on the real economy, Bernanke is doing more—in fact, he is going all in. This time, there is no end in sight to the money printing. The Fed is going to keep the printing presses rolling until the labor market improves “substantially.” And if it doesn’t, guess what? Bernanke promises to print even more money.

What is the justification for more monetary activism? The stock market is bordering on a post-crisis high, short- and long-term interest rates are at record lows, the housing market is improving, inflation is at the Fed’s target, and economic growth, while it should be better, isn’t cratering. Those don’t sound like conditions that warrant emergency monetary policy. How is more liquidity going to help the labor market?

Evidently, Mr. Bernanke hasn’t given up on the Fed’s asset-bubble approach to monetary policy. At the press conference following the Fed’s last meeting, when Bernanke was asked how an unbounded money-printing campaign would actually help economic growth, he answered:

To the extent that home prices begin to rise, consumers will feel wealthier, they’ll feel more disposed to spend. If house prices are rising, people may be more willing to buy homes because they think that they’ll, you know, make a better return on that purchase. So house prices is one vehicle. Stock prices, many people own stocks directly or indirectly. The issue here is whether or not improving asset prices generally will make people more willing to spend. One of the main concerns that firms have is there is not enough demand, there’s not enough people coming and demanding their products. And if people feel that their financial situation is better because their 401(k) looks better for whatever reason, their house is worth more, they are more willing to go out and spend and that’s going to provide the demand that firms need in order to be willing to hire and to invest.

In other words, the Fed plans to artificially prop up asset prices to encourage consumers to spend money. Money they don’t have. Check out our chart on the personal savings rate. Consumers are only saving 4% of their income, compared to a long-run average of 7%. Using illusory gains in wealth to fool Americans into spending is the same strategy that resulted in two asset bubbles and the worst recession since the Great Depression.

What’s more is a third round of money printing may not even boost asset prices as the Fed desires. As I mentioned earlier, the stock market is already bordering on a post-crisis high. In relation to normalized profits, stocks are far from cheap (see chart on price-to-trend earnings). And with revenue and earnings growth slowing sharply, investors may be reluctant to bid up stock prices much further.

The Bernanke Fed long ago lost its bearings on the role and purpose of monetary policy. An unbounded money-printing campaign is going to push the economy deeper into the easy-money abyss. This isn’t just the opinion of Young; even the Bank of International Settlements (BIS), the central bank for central banks, has warned of the consequences of the continued use of emergency monetary accommodation. From the latest BIS annual report (emphasis is mine):

any positive effects of such central bank efforts may be shrinking, whereas the negative side effects may be growing. Both conventionally and unconventionally accommodative monetary policies are palliatives and have their limits. It would be a mistake to think that central bankers can use their balance sheets to solve every economic and financial problem: they cannot induce deleveraging, they cannot correct sectoral imbalances, and they cannot address solvency problems. In fact, near zero policy rates, combined with abundant and nearly unconditional liquidity support, weaken incentives for the private sector to repair balance sheets and for fiscal authorities to limit their borrowing requirements. They distort the financial system and in turn place added burdens on supervisors.

With nominal interest rates staying as low as they can go and central bank balance sheets continuing to expand, risks are surely building up. To a large extent they are the risks of unintended consequences, and they must be anticipated and managed. These consequences could include the wasteful support of effectively insolvent borrowers and banks—a phenomenon that haunted Japan in the 1990s—and artificially inflated asset prices that generate risks to financial stability down the road. One message of the crisis was that central banks could do much to avert a collapse. An even more important lesson is that underlying structural problems must be corrected during the recovery or we risk creating conditions that will lead rapidly to the next crisis.

In addition, central banks face the risk that, once the time comes to tighten monetary policy, the sheer size and scale of their unconventional measures will prevent a timely exit from monetary stimulus, thereby jeopardising price stability. The result would be a decisive loss of central bank credibility and possibly even independence.

The potential for a disorderly exit from the Fed’s inflated balance sheet is especially worrying. Never in its history has the Fed injected so much high-powered money into the financial system. Bernanke & Co. have zero experience exiting unconventional monetary policy. Will the Fed be able to successfully wind down its balance sheet without first letting the inflation genie out of the bottle or causing another recession? Mr. Bernanke assures us he is 100% confident the Fed can control inflation. But the Fed is always under immense political pressure to keep the easy-money party going. If inflation starts to accelerate while unemployment remains elevated, will Bernanke (or a future Fed chairman) actually tighten policy and risk higher unemployment? And even if he does tighten policy before inflation accelerates, will he go too far and push the economy back into recession?

The Fed doesn’t exactly have a stellar record in managing the economy. It often keeps rates too low for too long during easing cycles and raises rates too high during tightening cycles. The sobering reality is since January of 1971, there have been eight Fed tightening cycles and six recessions. All six recessions came on the heels of Fed tightening cycles. And that was with standard monetary policy. The odds may be worse when exiting unconventional policy. At the very least, the historical record points to a 75% chance the Fed will push the U.S. back into recession when it tightens monetary policy.

In our view the short-term stock-market gains from the Fed’s latest money-printing campaign are likely to prove illusory. The Fed is pulling demand and asset price returns forward. The cost is likely to come in the form of weaker future growth, lower investment returns, and higher future inflation and interest rates.

How do you preserve and protect capital in an unbounded money-printing world? We continue to advise a defensive approach. While monetary accommodation may temporarily unmoor prices and fundamentals, history shows such a divergence is usually resolved in favor of the fundamentals.

In fixed income, we continue to keep maturities short to guard against a rise in inflation and interest rates. We are adding yield to fixed-income portfolios by favoring credit risk as opposed to maturity risk. We own gold, silver, and foreign currencies to hedge against the heightened risk of currency debasement. And in equities, we favor a globally diversified portfolio of high-dividend-paying stocks with a history of dividend increases. We focus on companies with strong balance sheets and high barriers to entry—those companies we believe are most equipped to thrive in any economic climate.

Have a good month, and as always, please call us at (888) 456-5444 if your financial situation has changed or if you have questions about your investment portfolio.

Sincerely,

Matthew A. Young

President and Chief Executive Officer

P.S. Here is a common pitch you may have heard from the perma-bull crowd. Stocks are cheap relative to bonds. The earnings yield on stocks far exceeds the yield on Treasury bonds. Is this a reason to be bullish on stocks? There are many issues with this line of thinking, but just for starters, here are two problems. First, stocks and bonds are different assets. Stocks are risky; bonds are much less risky. Thus, stocks should always be priced to deliver higher returns than bonds. Second, this is a relative-valuation argument. What if bonds are overvalued as they are today? A good guide to a fair yield on Treasury bonds is the growth rate in nominal GDP. Nominal GDP is growing at about 4%. Ten-year Treasuries yield about 1.8%, so bonds are deeply overvalued. If bond yields rise to 4%, do stocks suddenly become overvalued? Justifying the purchase of stocks based on bond yields is lazy analysis. Stocks should be valued on their own merits.

P.P.S. The states are the nation’s laboratories of innovation. Some state governments have worked hard to address the problems facing their citizens. Others have created boneheaded programs that will do little to solve the problems facing their constituencies. One of the smarter reforms in state government during this year has been the education overhaul in Louisiana shepherded by Governor Bobby Jindal. The reforms give 400,000 low-income students the ability to escape the poorly performing public schools that have failed to educate them. At the same time, it frees high-performing charter school systems from the burdensome regulation now necessary to start up new schools. In Florida, Governor Rick Scott is also innovating to help the state. Scott talks often about competition among the states and has moved to make Florida more competitive. No state can ever “win” all the jobs, but when states compete, businesses and employees are the winners.

P.P.P.S. We are in the process of evaluating many of our equity ETF positions. For a variety of reasons, which I will outline next month, we are looking to further increase our exposure to individual dividend-paying securities and reduce the number of equity ETFs.


Why Investors Shouldn’t Rely on Capital Gains

July 2012 Client Letter

One lesson reaffirmed to us from the dot-com bust is this: Prudent investors do not rely solely on capital appreciation for stock market gains. During the latter part of the 1990s many investors overloaded on technology and growth-oriented shares. When the collapse hit, they were not only left with a decimated portfolio, but one that produced little annual income.

Without the benefit of decent dividends, investors were placed in a difficult position. Do they sell current positions at a loss and start over with a new strategy? Or wait it out and hope their shares would come back? Meanwhile, dividend-oriented investors at least had the comfort of knowing they would receive a meaningful check on a consistent basis. Receiving dividends makes it easier to be patient and wait for the next rebound. A continuous stream of dividends can be used for living expenses or can be reinvested at a lower share price, resulting in higher future dividend payments.

As a result of the dot-com era, we stepped up our efforts to offer a higher-yielding stock portfolio. Prior to 2003, we managed stock portfolios comprised of companies entirely from the Dow Jones Industrial Index. While the yield on the Dow was higher than the yield of the S&P 500 and the NASDAQ, the Dow’s yield was still lower than we desired.

In the spring of 2003, we launched a managed portfolio called the Retirement Compounders (RCs). The RCs is a globally diversified portfolio of 32 dividend-paying securities. Securities in the portfolio still include bellwether stocks from the Dow but also include other names we believe to be solid, blue-chip-type companies. With a yield today of 4.7%, the RCs pumps out a lot more cash than the Dow, the S&P 500 and, of course, the NASDAQ. Investing in the RCs still allows for the potential of capital appreciation. But during down or flat markets the RCs generate a predictable stream of cash that is especially important for retired and soon-to-be-retired investors.

At Richard C. Young & Co., Ltd., we have been bracing for what we expect to be a difficult period ahead. The slowing global economic momentum that hit Europe, Asia, and much of the rest of the world earlier in the year is now washing up on U.S. shores. The rate of growth in the leading economic indicators has fallen to its lowest level since the recovery began. And the ratio of coincident-to-lagging indicators, often a better leading indicator than the leading index itself, looks perilous.

Job growth has also slowed markedly in recent months. In the first quarter, the U.S. was adding an average of 225,000 jobs per month; but in the second quarter, payroll growth slowed to an average of 75,000. Slower payroll growth may be partly explained by give-back from an unusually warm winter; but initial claims for unemployment and survey data on the labor market are also worsening. After bottoming out in March, jobless claims have trended upward.

Copper and aluminum prices aren’t sending a bullish signal. Copper is known to have a PhD in economics for its ability to forecast economic growth. My chart shows copper prices rolling over and aluminum prices crashing through a nearly three-year low.

Consumers’ fundamentals also look shaky. Over the last two years, consumers have dipped into savings to help sustain spending. The savings rate has plunged from 5.8% in June 2010 to a bubble-era 3.4% recently (the long-term average is about 7%). When you consider that the entirety of first-quarter GDP growth can be attributed to consumer spending, a plunging savings rate becomes all the more concerning. What happens if weakening economic momentum and a softening jobs picture cause consumers to close their wallets?

The icing on the cake is small business sentiment. Small businesses are the lifeblood of the U.S. economy—creating over two-thirds of all new jobs. The NFIB Small Business Optimism Index plunged three points in June—its biggest drop in over two years. Nine out of the ten components in the index worsened last month. The only component that improved was credit conditions—no surprise given record-low interest rates. But easy money doesn’t do much to stimulate the economy when businesses aren’t interested in expanding. According to the NFIB small business survey, only 5% of businesses think now is a good time to expand—a level historically associated with recession. America’s job creators cite a weak economy and hostile political climate as the primary reasons not to expand.

Small businesses’ view of the political climate is especially troubling for the economy. The June NFIB survey numbers don’t include the effects of the Obamacare ruling. Since the NFIB was the lead plaintiff in the case, it is safe to assume that small business owners were disappointed with the decision. Obamacare will add unknown burdens to the small business community. The law includes 20 new taxes and mountains of regulations that haven’t even been written. In our view, without America’s small businesses on board, a bona fide expansion in the broader U.S. economy is likely to remain elusive.

Oddly, the slowing economic momentum hasn’t fazed the U.S. stock market much. Despite some choppiness over the last couple of months, the S&P 500 is still up more than 8% YTD and only a few percentage points below its early April high. Why the disconnect between economic momentum and stock market performance? We would point you to the Federal Reserve. Expectations that monetary authorities would act to support the markets at the first sign of economic weakness have helped prop up stock prices. Chairman Bernanke promised investors as far back as last fall that the Fed would come to their rescue as needed. And at the Fed’s June meeting, he delivered on that promise. The Fed announced it would extend Operation Twist (selling short-term Treasuries and buying long-term Treasuries) by $267 billion over six months. In the press conference following the meeting, Mr. Bernanke also strongly hinted that another round of money printing may be forthcoming.

We have long been critical of the Fed’s unconventional monetary policies—not without good reason. The last five rounds of monetary stimulus appear to have provided no enduring benefit to the U.S. economy. We’ve had QE1 and QE2 and Operation Twist 1 and 2, zero-percent interest rates, and the promise of zero-percent interest rates well into the future. Yet, as I’ve already outlined, economic momentum continues to slow.

In our view, the Fed’s unconventional and untested policies have become more harmful than helpful. The Fed is punishing savers with perpetually low interest rates, promoting a dangerous misallocation of capital, creating an unhealthy dependence on zero-percent interest rates, complicating the eventual exit policy, and laying the groundwork for a future government-debt crisis by financing profligate government spending.

All in the name of what—higher stock prices? The only tangible result of the Fed’s unconventional policy has been to temporarily boost equity prices. If the Fed moves forward with QE3, we anticipate a similar outcome: No enduring benefit to the real economy and a speculative rally in the stock market.

Although high-quality stocks (which we define as dividend-payers with high barriers to entry or durable competitive advantages) tend to lag during speculative rallies, we believe they offer long-term investors more favorable prospects. You won’t find us chasing performance in stocks like Netflix or Facebook to profit from a speculative rally.

Both companies operate in industries with almost no barriers to entry. Take Netflix by example. The company owns none of the content it sells, nor does it own the transmission lines required to deliver its content. It is a virtual movie store. Anybody with enough capital and motivation can easily replicate the business. And ventures such as Hulu, HBO GO, and Xfinity, among others, have done just that—and they are taking market share.

We much prefer businesses with durable competitive advantages. Companies such as AT&T and Nestlé.

Investing in AT&T

AT&T traces its roots back to 1876 when Alexander Graham Bell and his partners Gardiner Hubbard and Thomas Sanders succeeded in earning patents for Bell’s telephone inventions. Soon the company opened its first telephone exchange in New Haven, CT, and rapidly expanded through major cities across the country. The company had a monopoly on telephone technology until 1894 and used it wisely, growing its footprint across the U.S. Today AT&T owns one of the world’s most powerful and advanced global backbone networks for communications, capable of carrying 28.9 petabytes of data with 99.999% reliability. AT&T also owns the nation’s fastest 4G mobile broadband network and manages a wi-fi network with access to 190,000 hotspots worldwide. AT&T’s network also includes 916,000 miles of fiber worldwide, 43.6 million access lines, 16.5 million broadband connections, and MPLS services that reach 182 countries. It would be nearly impossible to recreate AT&T’s network from scratch today.

Investing in Nestle

Pharmacist Henri Nestlé made the first step toward what would become the world’s largest food company in 1867. Nestlé created a baby food using a mixture of milk, wheat flour, and sugar to save a neighbor’s dying child. Today Nestlé owns a world-class stable of brands, including household names Nescafe, Carnation, Stouffer’s, Gerber, Kit Kat, and Purina. Nestlé has a generations-old presence in most countries in the world, having expanded rapidly through its history. Long-term relationships with its local markets are vital to Nestlé’s competitive advantage. The strength of its brands and a massive distribution chain protect Nestlé from competing forces.

The most pressing investment issue for millions of Americans is how to generate income from their portfolio. With the global economy in crisis, stock market appreciation seems anything but a sure thing. And income standbys, such as Treasury bonds, municipal bonds, and CDs offer depressingly low yields.

To help combat an environment of uncertainty and low yields, we believe investors can benefit from a diversified portfolio that includes higher-yielding, higher-quality stocks. AT&T and Nestlé are two we believe fit this category. For fixed income, we favor an emphasis on short-term corporate bonds. Yes, the yields are historically low; but shorter-term bonds will fluctuate little when rates rise and will help reduce portfolio volatility if we have another stock market crash.

Have a good month and, as always, please call us at (888) 456-5444 if your financial situation has changed or if you have questions about your investment portfolio.


Matthew A. Young

President and Chief Executive Officer

P.S. In an environment of low returns from stocks and low yields from bonds, investors need to pay close attention to annual expenses. InvestmentNews recently reported on two classes of mutual fund shares from American Funds. The A shares of American Funds’ EuroPacific Growth fund has an 84-basis-point expense ratio and a maximum load fee of 5.75%. The F-2 shares of the fund have an expense ratio of just 58 basis points. According to InvestmentNews, an investment in the A shares, with the maximum front-end fee, would have a three-year annualized return of 2.79%. The same investment in the F-2 shares would have a return of just over 5%. At Richard C. Young & Co., Ltd., we have shifted most of our fund investing to exchange-traded funds, which have much lower expense ratios than most traditional mutual funds.

P.P.S. The protection of your personal and account information is important. Attached for your records is a copy of Privacy Policy. In addition, you should be receiving monthly account statements directly from the account custodian (i.e. Fidelity Investments). Please contact us immediately if you are not receiving your monthly statements. Also, we encourage you to review your statements carefully and contact us with any questions.


A Q&A on the Outlook

May 2012 Client Letter

As a trustee for the City of Naples Firefighter Pension Fund, I am particularly interested in observing how government retirement benefits are disrupting state and municipal finances. Across the country, state and local governments have accumulated trillions of dollars in unfunded retirement promises. To fund these costs, expect taxes to rise, services to be reduced, or a combination of both.

In the years ahead, government retiree costs are sure to play a dominant role in the competition among states to attract businesses and retain citizens. The race will be on to increase the tax base.

Not all states are in equally poor shape. Some states have already initiated reform or never made excessive promises to their workers in the first place. By example, Indiana’s debt for unfunded retiree health-care benefits amounts to about $80 per person. Neighboring Illinois benefits amount to $3,300 per person. Wow! In the current condition, what business or individual would make long-term plans to root in Illinois?

In Naples, the city pension funds are in relatively good shape. This month, our quarterly board meeting was extended over a full day and a half, allowing for extensive discussion with our pension fund consultant, investment managers, and a leading economist. Rather than having to fret about unfunded liabilities, the board devoted much time to the global economy and what could be expected from the equity and bond markets.

Following are several of the good questions and themes raised to our investment panel during the two-day meeting. The answers, however, are mine—reflecting how I would have responded.

Since 2008, it appears the U.S. economy is gradually getting better. And there appear to be small increases in hiring. Are things really improving?

Perhaps, but it is important to put the economic improvement in context. The Fed is still engaged in emergency monetary policy. Short-term interest rates are at zero—and the Fed has promised to keep rates low for another two years or more. There has also been an unprecedented expansion in the Fed’s balance sheet. Nobody knows for sure whether the Fed will be able to successfully unwind its balance sheet fast enough to prevent inflation and slowly enough to prevent another recession. We expect an exit from “emergency” monetary policy to be more complicated than Fed policy makers have suggested. And fiscal stimulus is still propping up the economy. 

The below chart of real personal income less transfer payments gives an overview of the situation. (“Transfer payments” is doublespeak for income redistribution, just as “quantitative easing” is doublespeak for money printing.) Note the stagnant income growth. And this doesn’t adjust for the temporary payroll tax holiday. Without the tax holiday, income growth would likely be negative. This suggests that much of the improvement we have seen in consumer spending over recent months is attributable to a drawdown in the savings rate. So unless one is confident that zero percent interest rates, trillions in excess reserves, and trillion-dollar budget deficits are sustainable, there is still cause for concern.

Doesn’t a gradually improving economy also gradually lift the stock market?

Yes, most often in a slowly improving economy, one would expect the stock market to improve or at least not tumble, but there are a couple of things to point out here. 1) Large-cap U.S. stocks are more a play on global growth than U.S. growth. Europe is in recession, and many emerging economies are slowing. 2) The Fed’s easy-money policies have likely pulled forward some of the returns that investors would typically earn in an economic expansion.

Could we see a correction in stocks if the president and Congress don’t do something with taxes by the end of the year?

A correction is possible. Some of this may be discounted, and we aren’t of the view that the president and Congress will allow all of the Bush tax rates to increase.

What can be expected for capital gains taxes and dividend taxes?

I’m not yet convinced capital gains rates are going up much. Even under Clinton they were treated favorably. I know Obama has been talking about the Buffett tax, but this could be viewed as his first offer in what will be a negotiation. Before Buffett came out with his tax proposal, Obama was in favor of 20% dividend and capital gains rates. That might be a more likely outcome.

Europe is still a disaster waiting to happen. It’s just not certain that Germany can save the rest of them.

Yes, the euro area faces significant obstacles. It appears as though Europe’s bailout attempts are losing traction. The ECB’s massive liquidity injection (LTROs) into the euro-area banking system in December and February only bought a few months of stability before the latest flare-up. The political blowback from harsh austerity programs in many euro-area countries, especially in Greece, has escalated to a tipping point. The Greek anti-austerity party Syriza is gaining in popularity and may win an upcoming election. Syriza promises to renegotiate Greece’s bailout terms with euro-area policy makers, but the currency-union’s solvent members aren’t interested in negotiating. If Greece doesn’t move forward with the agreed-to austerity measures, euro-area policy makers have signaled that Greece may be pushed out of the common currency. The prospect of a near-term Greek exit from the euro has stopped the global equity rally in its tracks. Most European stock markets are now down on the year, and U.S. stocks have given up over 60% of YTD gains.

If Greece is pushed out of the euro, expect more volatility. The magnitude of the damage from a Greek exit will depend on the policy response. If policy makers can build a credible firewall around Spain and Italy, the damage could be contained. It is also possible that policy makers will cave or that Greece will back off of its demands and a new agreement will be reached that avoids a Greek exit. We’ll know more after the Greek elections in June.

Currently, inflation does not seem to be a big threat. There appear to be downward pressures on prices that offset upward pressures. Is this a fair assessment?

Yes, in a weak economy there is typically downward pressure on prices, but with trillions in high-powered money sitting idle on bank balance sheets, one might argue that the risk of future inflation is greater than it has ever been. And under the Bernanke Fed there has been a subtle shift toward accepting greater inflation as long as unemployment remains high.

As a country, the U.S. should benefit hugely from the abundance of newly acquirable natural gas. Exploiting our natural gas reserves could help spur the economy and lower prices.

Yes, there is significant opportunity for the U.S. from cheap energy. Gas itself has export potential, lower energy costs should attract energy-intensive manufacturing, and demand for U.S. gas for industrial uses should also pick up.

What keeps you up at night?

Unfortunately, one could draw up a rather robust list of issues to worry about. During my 19 years working with individual investors, I have found many to be fairly resilient in the face of general stock-market and economic swings. What seems to bother most, as well as myself, is the unknown. The improbable and unpredictable event is what causes sleep disruption. 9/11 was one such event. The collapse of Lehman Brothers and the associated fallout was another. The unknown event carrying significant impact is what concerns me the most.

In today’s uncertain political and economic environment, what gives you confidence?

From an investing standpoint, I take confidence in the durability of both a balanced investment strategy and the types of companies we purchase. A balanced portfolio helps to reduce the probability of extreme outcomes by including assets that may perform differently in different market environments. My dad calls this “counterbalancing” or “the teeter-totter effect.” As basic examples, gold is a hedge against extreme outcomes, and bonds tend to perform better in a weak economy or a deflationary environment. Stocks perform best when economic growth is strong and over the long term help hedge against inflation. Natural resources are a good asset to own in an inflationary environment. A combination of all four assets makes for a more resilient portfolio. We also invest in durable businesses. We favor companies that sell essential goods and services. Two good examples are utilities and consumer staples. Whether there is hyperinflation or a deflationary depression, most Americans will still light and heat their homes, and pay their water bills. And we hope that most would still brush their teeth, use tissue paper, and of course eat.

Have a good month, and as always, please call us at (888) 456-5444 if your financial situation has changed or if you have questions about your investment portfolio.

Sincerely,

Matthew A. Young
President and Chief Executive Officer

P.S. The recent Facebook IPO did not register on my enthusiasm meter. Personally, I find much to dislike about social media. Besides, Facebook as a business is not in the ballpark of the type of companies we buy. My prediction is that from an investment standpoint, social media companies have peaked.

P.P.S. There was a time when Atari, Walkman, Myspace.com and others were seen as cutting-edge technologies and even game changers in their respective industries. A problem with cutting-edge technology is that it operates in industries with relatively low barriers to entry.

P.P.P.S. At Richard C. Young & Co., Ltd., we tend to focus on businesses with high barriers to entry. These industries include transportation, energy, energy and water delivery, electricity, and food production. They have a tendency not to become obsolete. And companies within these industries, unlike most tech stocks, offer the potential for the ever-important dividend.


Interventionist Fed Policy

April 2012 Client Letter

What should stock market investors expect for the rest of the year? While we cannot predict the future, we continue to see a generally pleasing environment for stocks in 2012. Ultra-low interest rates on treasury bonds offer little competition for stocks, which have the powerful tailwind of election-year fiscal and monetary stimulus working in their favor.

On the surface, a favorable near-term outlook for the stock market may give the impression that things are fine, but a look beneath the surface reveals serious risks.

The interventionist Fed has created a distorted illusion of prosperity. As the Federal Reserve authorities rap on about QE1, QE2, et al., investors intuitively know something isn’t right about perpetual money printing. But it’s hard to believe, as rampant speculation in the stock market continues to expand. The bad stuff in the stock market is going up, and the good stuff is going down, or simply wallowing. To get any type of yield today, investors are being forced into longer-term, more price-sensitive bonds or into the foulest sectors of the stock market. It is an environment we have seen before and one that rarely ends well.

And although employment appears to be in a strong groove, unseasonably warm weather may have fueled much of the recent momentum. This winter was the fourth warmest since records began in 1895. Construction crews were out early and consumers hit the malls more frequently this winter.

During the employment deflation of 2008 and 2009, non-farm payrolls were shrinking by as much as 0.3%, 0.4%, 0.5%, and 0.6% per month. In just late 2008 and the first three quarters of 2009, over seven million jobs went down the tubes. Since the so-called economic rebound began, there has not been a single monthly employment uptick of 0.5% or 0.6%. Not one! In fact, there hasn’t been a 0.3% monthly uptick.

The best monthly uptick in this pseudo economic rebound came back in May 2010 with one lonely 0.4% aberration, which was quickly neutralized with a downtick the very next month. The net-net here is a gain of 3.4 million jobs over the last two years versus a loss of 7.5 million jobs in the prior period outlined above. There have been only half as many job gains in today’s period of supposed economic strength as those lost at the end of the financial meltdown.

A bona fide sound economic recovery is underpinned by a non-interventionist Fed; a tax-cutting, budget-balancing administration; and associated strong gains in both the housing and employment sectors. Despite white-hot money creation, we have the most modest employment gains. And housing? Did you know that the gap between the median price for new homes and “old” homes is a whopping $76,000, and that difference is up a staggering 57% from 2010? The main culprit, of course, is a monster backlog of cheap, foreclosed old homes. Americans are simply packing up, putting the key in the door, and splitting, leaving banks around the country to choke on piles of upside-down mortgages. Check out the depressing downside momentum in our new home sales chart.

The end of the three-decade secular decline in interest rates also poses risk to investors. Our chart shows that, over the last five decades, there have been two secular swings in interest rates. Just two. Number three is likely on the way. Can you guess the direction? It’s a little hard to have a secular downswing off a zero base, is it not? The reality for interest rates may be a nasty stair-step run-up. A big increase in interest rates won’t have a positive impact on bond prices, home values, the economy, or the stock market. Investors not preparing for such an outcome could be making a costly mistake.

To navigate through the current environment successfully, we invest with a balanced approach. Our investment strategy is similar to the strategies used by two of our long-favored Vanguard Mutual Funds—Wellesley Income and Wellington. We don’t currently own the Wellington Fund; but it is the older of Vanguard’s two balanced funds, so it offers a greater perspective on the performance of a balanced strategy.

With a history that dates back to 1929, the Wellington Fund is one of the nation’s oldest and most successful mutual funds. Wellington has successfully navigated through eight decades of financial market turbulence, including the Great Depression, the stagflationary 1970s, and the more recent credit crisis. We attribute much of the fund’s investment success to its balanced portfolio. Wellington invests about 60% of its assets in mostly dividend-paying stocks and the remaining 40% in investment-grade bonds.

A balanced strategy reduces short-term volatility and tends to hold up better than a single asset-class portfolio in a wider variety of financial and economic climates. By example, since year-end 1999, the average annual return on the S&P 500 has been about 0.55% compared to 6.33% for Wellington. And from year-end 1972 through 1981, a tough period for bonds, Vanguard Wellington earned an average annual return of 4.61% compared to a 2.6% gain on Treasuries and a 5.2% gain on stocks.

Wellington will rarely be the best-performing fund in any given investment environment, but it will keep you in the game and allow the power of compound interest to work for you. From its 1929 inception, the Wellington fund has delivered a compound annual return of 8.18%—enough to turn a $5,000 initial investment into $3.4 million.

Though there are similarities between our investment strategy and the strategies pursued by the Vanguard Wellington and Wellesley funds, there are also important differences. Vanguard Wellesley and Wellington are both multi-billion-dollar mutual funds with strict investment mandates. On the stock side of the ledger, both funds are limited to large-capitalization U.S. stocks. And on the bond side of the portfolio, Wellesley and Wellington invest in intermediate-term investment-grade bonds.

We don’t limit our investment universe to U.S. stocks and medium-term investment-grade bonds. We invest where we see opportunities. We currently own both large-cap and small-cap stocks that are domiciled around the globe. We own shares in Brazilian utilities, Canadian oil companies, Swedish household products firms, and British tobacco companies. And if we find opportunities in other parts of the world, we are free to pursue them.

In bonds we place no restrictions on the maturity or credit ratings of the firms we can buy for you. We buy what we find most attractive for the current environment. Today we favor a mix of short-term corporate bonds, floating-rate loans, high-yield bonds, GNMA securities, and short-term Treasuries. But when the interest-rate cycle turns, and someday it will, we most likely will favor a different mix of fixed-income securities.

We also think it is crucial for investors to diversify beyond stocks and bonds. We invest in precious metals, foreign currencies, and natural resources. All three asset classes provide an additional layer of diversification to a portfolio of stocks and bonds. And in an inflationary environment, where both stocks and bonds tend to perform poorly, an allocation to hard assets and hard currencies helps offset the corrosive effect of inflation.  

Have a good month, and as always, please call us at (888) 456-5444 if your financial situation has changed or if you have questions about your investment portfolio.

Sincerely,

Matthew A. Young

President and Chief Executive Officer

P.S. We recently initiated a position in iShares Silver Trust. The iShares fund owns physical silver. Relative to gold, silver appears cheap. The higher the gold/silver ratio, the cheaper silver is. The historical gold/silver ratio has been about 15:1; today it is 53:1. Central banks do not own silver, which they could dump on the world market to depress prices. This is a big plus for silver. Silver trades at about $31/oz. We estimate that the structural low is about $10/oz. There conceivably is a significant downside risk. Our strategy is to slowly build a position in silver over the next few years, with the intention of buying at an average price well below $31/oz. We view silver and gold as insurance policies that we hope will never be needed.

P.P.S. “There’s now a healthy notion that people should be getting income from the stock market. Until the early 1980s, the U.S. stock market was an investment platform for which you were paid in cash. Over the past couple of decades it’s come off of that. But before that, older people remember buying stocks for their dividends. Now they’re doing that again, for the first time probably in three decades, and some ask if that’s a new paradigm. Well, it’s not a new paradigm. It’s actually a very old paradigm. It’s the original paradigm.” —Daniel Peris, Federated Investors.

P.P.P.S. Since 1989, Richard C. Young & Co., Ltd. has emphasized income-producing securities. In 2003, we developed our Retirement Compounders (RCs) program in response to an overall low-yield environment for both stocks and bonds. The RCs is a portfolio of 32 dividend- and income-paying equity securities. The globally diversified portfolio features familiar domestic names, including Kimberly Clark and Procter & Gamble, and lesser-known international companies, such as Canadian Oil Sands, Companhia Energetica de Minas Gerais (CEMIG), and Statoil. The yield on the RC portfolio is currently 4.8%.

P.P.P.P.S. Investors concerned with maximizing yield—or total return, for that matter—benefit by keeping an eye on expenses. Higher expenses eat into a portfolio’s cash flow.  We charge less than 1% annually to manage globally diversified custom portfolios. On the fund front, we do not invest in 12b-1 mutual funds, but we instead emphasize lower-expense Vanguard funds and exchange-traded funds.      


Unconventional Monetary Policy and Bond Investing

March 2012 Client Letter

Monetary policy has been one of the most influential forces in financial markets over recent years. The Fed has shifted policy from the conventional (changing the fed funds rate) to the unconventional (money printing and communications). Unconventional policy maneuvers have proven to be a potent force in financial markets. This is especially true for the bond market, where Fed action has the most immediate and direct impact.

The Fed’s latest was announced earlier this year. In January, it pledged to hold short-term interest rates at 0% until late 2014—more than a year longer than the market had anticipated.

The surprise extension of the 0%-interest-rate policy pushed Treasury rates down across the maturity spectrum. Five-year T-note yields dipped as low as 0.75% in the days following the announcement—more than two percentage points below the rate of inflation. Yields on our favored high-quality short-term corporate bonds fell in sympathy with falling Treasury yields. The more upbeat tone of recent U.S. economic data has also helped push down high-quality corporate bond yields as investors demand less compensation for taking on credit risk. The yield on the Merrill Lynch 1-2 year AA-AAA index has dropped below 1%.

With yields of less than 1%, high-grade short corporates have become less appealing. To offset the lower yield, we are seeking areas of the lower-rated (BBB and below) corporate bond market. We have an especially favorable view of high-yield bonds. With a shortage of yield in the bond market and rising risk appetite, a 6-7% yield from high-yield debt looks attractive.

To gain exposure to high-yield bonds, we recently began purchasing SPDR Barclays High Yield Bond ETF (JNK). JNK offers exposure to a diversified basket of high-yield bonds in a liquid exchange-traded vehicle. The yield on the SPDR Barclays High Yield Bond ETF is currently 7%.

Most often we favor traditional bond mutual funds over bond exchange-traded funds (ETFs). Why? Bond ETFs have a tendency to trade at prices above or below net asset value (NAV). With the purchase of JNK, we are looking past the NAV issue because many of the traditional bond mutual funds we favor have stiff redemption fees that can remain in effect for up to a year. In today’s fast-moving and volatile markets, it is our view most bond ETFs provide a greater opportunity to maximize return in high-yield bonds than traditional bond funds.

In conjunction with the purchase of the SDPR High Yield ETF, we also added bond positions in Frontier Communications and Arcelor Mittal. Frontier Communications is the nation’s largest provider of communications services focused on rural America. The Frontier bonds we purchased are due in April of 2017 and they are rated Ba2/BB by Moody’s and S&P. The bonds were acquired at a yield to maturity of 7.74% in most portfolios.

Arcelor Mittal Bonds

Arcelor Mittal isn’t a household name, but it should be. Arcelor is the world’s leading steel production and mining outfit, with annual production capacity of 100 million tons. The company has 260,000 employees spread across 60 different countries. Arcelor is the leader in all major steel markets, including automotive, construction, household appliance, and packaging. In 2011, the company produced around 6% of the world’s steel. The Arcelor bonds we bought are due in February of 2017, and they are rated Baa3/BBB- by Moody’s and S&P. We purchased the bonds at a yield to maturity of about 4.5%.

Another recent addition to fixed-income portfolios is two-year U.S. Treasury zero-coupon bonds. We purchased two-year zeros partly to offset the additional credit risk we are taking with high-yield bonds.

Zeros are Treasury bonds that do not pay income. Instead they are issued at a discount to face value. By example, if an investor purchased a one-year zero with a 5% interest rate, he would pay $952.30. In one year, the bond would mature and the investor would receive $1,000—a 5% return (($1,000 – $952.30) / $952.30 = 5%).

Our zeros strategy is to maximize capital gains over an entire interest rate cycle. With rates currently flat, we favor short-maturity zeros. As the rate cycle evolves and yields rise, we anticipate moving out on the yield curve to longer, higher-yielding zeros that offer greater potential for capital gains.

For retired investors and those nearing retirement, we have long advocated a balanced approach to investing. Balanced portfolios tend to hold up better than single-asset-class portfolios in a variety of market climates. When writing about balanced portfolios, we usually discuss the benefits of adding bonds to an equity portfolio. But the current prolonged period of zero interest rates and the prospect of two and a half more years of the same provide the opportunity to focus on the benefits of owning equities. 

While an all-bond portfolio may experience lower volatility than a balanced portfolio, it suffers from greater inflation and income risk. In the current environment, with intermediate-term Treasuries yielding 1% and inflation running near 3%, an all-Treasury portfolio generates inadequate income and sacrifices purchasing power. Assuming a standard 4% withdrawal rate, the purchasing power of a Treasury-only portfolio yielding 1% would fall 6% per year (3% from taking more income than the portfolio generates and 3% from inflation). It wouldn’t take long to decimate the purchasing power of a portfolio at a 6% depletion rate.

Stocks, and more specifically dividend-paying stocks, can help offset the elevated income and longevity risks that a bond-only portfolio faces.

Dividend-paying stocks are the focus of our Retirement Compounders portfolios (RCs). With the RCs, our goal is to generate a sustainable and steady stream of income that keeps pace with inflation. We make no attempt to “beat the market.” Our objective is to build and protect capital and provide a stream of income during retirement.

After two vicious bear markets and a prolonged period of ultralow interest rates, many investors seem to be rediscovering the merits of dividends. Asset flows into dividend-focused funds have increased markedly in recent years. But many of the popular dividend funds buy only U.S. stocks, and often pay scant attention to maximizing portfolio yield. The Fidelity Strategic Dividend and Income Fund and the Vanguard Equity Income Fund come to mind as two relevant examples. Both funds claim to focus on generating dividend income, but the Fidelity fund yields only 2.68% and the Vanguard fund yields 2.16%—not much more than the 2% yield on the S&P 500. There are of course some dividend funds that seek to maximize yield, but here we find that too much emphasis is placed on yield and not enough on dividend growth.

With the RCs, we take a different approach. We craft globally diversified portfolios of  businesses we view as stable that sell essential goods and services in industries with high barriers to entry. We purchase exactly 32 positions to ensure discipline. And we favor companies with strong balance sheets or readily available access to capital. Most importantly, we buy only dividend-paying companies and strongly favor those with a history of consistent dividend increases. Today our RCs yield about 4.5%—more than double the current market yield—and the average five-year dividend growth rate of our portfolio companies is 4.5%. The combination of a high yield today and dividend growth tomorrow should be compelling for investors in or nearing retirement.

Have a good month, and as always, please call us at (888) 456-5444 if your financial situation has changed or if you have questions about your investment portfolio.

Sincerely,

Matthew A. Young
President and Chief Executive Officer

P.S. The Cato Institute’s Chris Edwards effectively argues that House Budget Committee Chairman Paul Ryan’s annual budget blueprint is hardly a slash, burn, and pillage of the government’s safety net. As a share of GDP, the Ryan budget would trim outlays from 23.4% this year to 19.8% by 2022. That reduction would simply bring spending back to around the normal historical level. And note that spending would still be higher than the 18.2% achieved in the last two years under President Clinton.

P.P.S. Last year, our favored consumer staples and utilities were the two best-performing sectors in the S&P 500. YTD, staples and utilities are out of favor as the more speculative sectors of the market head higher. Regardless of the shift, we continue to favor the defensive characteristics of consumer staples and utilities in the current environment.

P.P.P.S. The Fed has flooded world markets with excessive liquidity. In our view, interest rates are at manipulated and artificially low levels. Eventually, rates should revert back to more normal levels. They could even overshoot dramatically, causing disruption for long-bond holders, speculative equity investors, and the U.S. dollar.