Investing in International Stocks

February 2012 Client Letter

Last year was an unpleasant year in global equity markets. Modest gains in the S&P 500 (+2%) masked steep declines in most equity markets throughout the world. Of the 23 developed equity markets, only two were up in 2011—the U.S. and New Zealand. Of the 21 markets that fell, 17 were down double digits, with a handful of those down more than 20%. Emerging equity markets fared even worse. Of the 25 emerging equity markets that Young Research tracks, only three finished the year in positive territory. Close to half of the world’s emerging stock markets fell more than 20% in 2011.

But the dismal performance of the world’s equity markets in 2011 has been relieved by a powerful global stock market rally to start 2012. As of this writing, the S&P 500 is up 9% with many international markets rising even more. In U.S. dollar terms, the German stock market is up more than 20%, and Brazil’s equity market—one of last year’s worst-performing markets—is up an impressive 25%.

The performance reversal in global equity markets is a testament to the virtues of taking a long-term approach to investing. Investors who abandoned losing positions during the worst of the market collapse last year most likely forfeited substantial gains this year. Of course, taking a long-term approach is easier said than done. This is especially true when volatility and uncertainty are elevated, as they have been over recent years. To remain confident and comfortable with a long-term approach, it is useful to know what you own and why you own it. This month’s letter takes a look at a few of our favorite investment themes and companies. Brazil has long been our favored emerging market economy. Our investment thesis on Brazil is focused on the country’s long-term potential. We believe Brazilian shares have strong secular tailwinds working in their favor. Brazil is a middle-income country moving rapidly toward developed market status. Economic growth in Brazil has outpaced growth in the developed world, and we see very little on the horizon that points to a change in this trend.After years of rapid inflation and economic instability, interest rates in Brazil are sky-high. But past mistakes have seemingly been taken to heart by Brazil’s policy makers.

Current leadership appears not to want a repeat of the hyper-inflation that plagued the country in decades past. As a result, we expect a long-term secular decline in Brazilian interest rates. Falling interest rates are often bullish for equities.  During the 20-year secular decline in U.S. interest rates, the S&P 500 rose at a compound annual rate of 18%. Looking at the year ahead, we believe a more accommodative monetary policy, a recent credit-rating upgrade from Standard & Poor’s, and the suspension of a tax on foreign equity investments point toward further gains in Brazil’s stock market.

CEMIG

To gain Brazilian equity market exposure, we purchase both Brazilian ETFs and common stocks. We are currently buying two small-cap Brazilian ETFs. We buy Brazilian small-cap ETFs because they provide more direct exposure to Brazil’s domestic economy than large-caps. Our largest Brazilian common stock position is Cia Energética de Minas Gerais (CEMIG). CEMIG is Brazil’s third-largest energy generation and transmission group and the largest energy distribution group in Brazil. CEMIG controls 65 generation plants, 59 of which generate electricity from the most economically viable renewable energy source—hydroelectric power. CEMIG has total generating capacity of 6,925 gigawatts. In our view, CEMIG also has strong growth prospects for a utility. Over the last five years, electricity consumption in Brazil has risen at a 5% compound annual rate. CEMIG shares currently yield 5% and offer the prospect of moderate long-term growth.

Like CEMIG, Canadian-based Brookfield Renewable Power is a big hydroelectric power producer. In our view, hydroelectric power producers have appeal to long-term investors. Hydroelectric power plants are a low-cost renewable source of energy. Hydro plants have long lives, low maintenance requirements, strong reliability, and no high-heat combustion to wear down equipment. Brookfield Renewable Energy recently completed a merger with Brookfield Renewable Inc.—a related company. The combined companies offer investors strong long-term dividend growth prospects. The new Brookfield is one of the world’s largest publicly traded, pure-play renewable power platforms. Its primarily hydroelectric-generation portfolio includes 170 hydropower facilities and five wind farms, and totals approximately 4,800 MW of installed capacity, including projects under construction. Its portfolio is diversified across 67 river systems and 10 power markets in Canada, the United States, and Brazil, and generates enough electricity from renewable resources on average to power two million homes annually. With a fully contracted portfolio of high-quality assets and a significant pipeline of projects and growth opportunities, the business is positioned to generate stable, long-term cash flows, supporting regular and growing cash distributions to investors. Brookfield Renewable shares currently yield 5%.

Statoil

We also favor Statoil (STO). Statoil was formed by Norway in 1972 to exploit the massive reserves of oil and gas on the Norwegian continental shelf. After going public in 2001, Statoil has grown to be one of the world’s largest energy companies, with a market capitalization of over $84 billion. Today, Statoil is the second-largest natural gas supplier in Europe and the world’s sixth-largest. Statoil is also a world leader in subsea technologies, with the largest number of subsea wells at ocean depths lower than 100 meters. Statoil shares yield 4.25%.

Statoil is one of a handful of European stocks that we own—none of which are based in the euro-area and all of which are multinational companies. While the European Central Bank has stabilized the euro-area debt crisis by dumping massive amounts of liquidity into the financial system, risks remain. As we have long maintained, liquidity is not the underlying
problem in the euro area. The liquidity crisis last year in Europe was a symptom of solvency concerns, which were in turn caused by the currency union’s flawed design. Varying levels of competitiveness between countries that share the euro are the underlying cause of the region’s problems. Competiveness is not something that can be easily improved. Consequently, we continue to view the euro area cautiously and, for now, we are still avoiding euro-area stocks.

We are, however, investing in non-euro-area Europe. Switzerland remains one of our largest European positions. We recently made some adjustments to our client’s Swiss holdings including the sale of our remaining position in the Swiss franc. Several months ago the Swiss National Bank (Switzerland’s central bank) made a decision to peg the franc to the euro. While the peg may be removed at some point in the future, until it is, a position in the franc is effectively a position in the euro.

Investing in ABB

We also initiated a position in Swiss-based ABB. Tracing its roots back to 1883, ABB provides power and automation technologies to utility and industry customers worldwide. ABB invented and pioneered many power and automation technologies. In 1952, ABB built the world’s first high-voltage direct current (HVDC) power connection to increase the efficiency of electricity transmission. In the 1990s, the company introduced HVDC for underground transmission. ABB’s portfolio of products ranges from light switches to robots for painting cars to electrical transformers and control systems that manage entire power networks and factories.

ABB’s end markets offer attractive long-term growth prospects. Growing emerging market demand for electricity, widespread government support for energy efficiency, and an aging electricity infrastructure in developed markets point toward consistent long-term demand for ABB’s products and services.

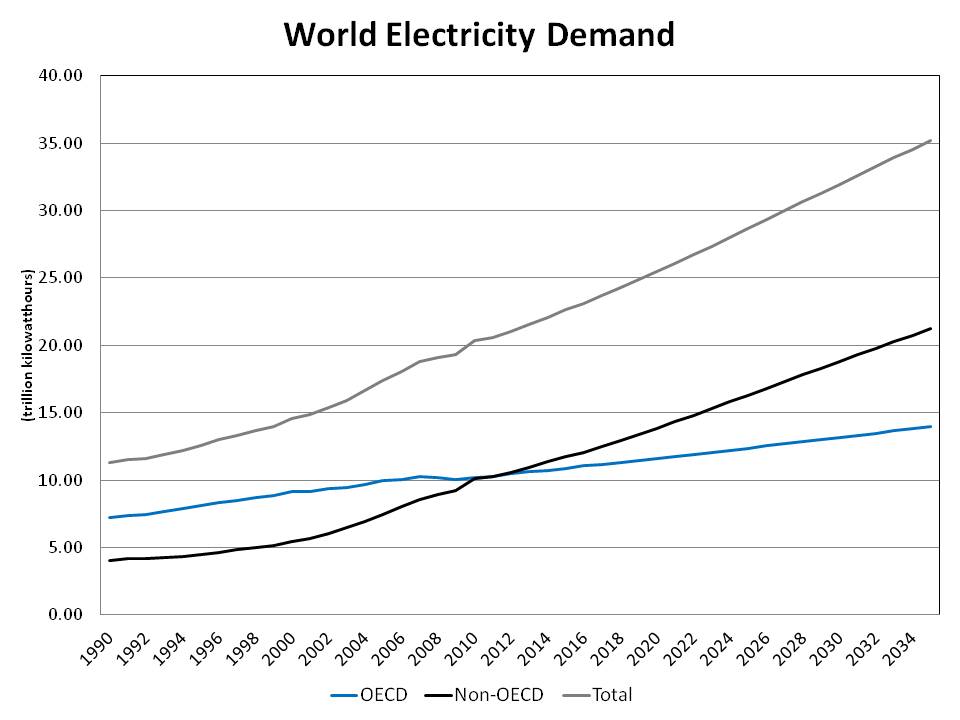
Emerging markets, the source of almost 50% of ABB’s orders, are projected to double electricity demand by 2030 and triple it by 2050. As incomes grow in emerging markets, more people move to cities and towns, driving up the demand for electricity. According to Goldman Sachs, a 1% increase in the number of people living in cities leads to a 1.8% increase in demand for electricity. And a 1% rise in income per head leads to a 0.5% increase in demand. Urbanization rates and per capita income in many of the largest emerging markets are only a fraction of what they are in the U.S. The potential here is enormous. Our chart, titled Electricity Demand, shows the projected demand for electricity in OECD (developed) markets versus non-OECD (emerging) markets. ABB shares pay an estimated yield of almost 4%.

Another European market we favor is Sweden. In many portfolios we recently purchased a position in iShares Sweden. What do we like about Sweden? Among other factors, Sweden is the world’s third most competitive nation, a neutral country, and a true AAA credit with a government debt to GDP ratio of about 30% compared to over 100% in the U.S. Some of the top holdings in iShares Sweden are Hennes & Maurtiz, Ericsson, Volvo, and Svenska Cellulosa (SCA).

Vodafone & British American Tobacco

Two other companies domiciled in non-euro Europe that we have added to portfolios are Vodafone and British American Tobacco. Vodafone is one of the world’s leading diversified telecommunications operators. The company is one of the largest carriers of mobile voice traffic in the world, serving more than 370 million customers in 60 different countries. Vodafone has a significant presence in Europe, the Middle East, Africa, Asia Pacific, and the United States through its 45% ownership interest in Verizon Wireless. Vodafone is positioned comparatively well among telecommunication companies (especially U.S. telecoms) to thrive, as the transition from fixed line to mobile voice and data continues. Did you know that mobile calls now account for 82% of all calls made globally? Vodafone’s fixed line business accounts for only 8% of revenue. The remainder of the firm’s revenue comes from mobile voice (64%), messaging (12%), data (12%), and other sources (4%). Industry-wide, about 40% of revenue comes from fixed-line services.

There are opportunities for Vodafone to increase revenue in developed markets. In Europe only 22% of Vodafone’s subscribers have smart phones compared to 40% in the U.S. The proliferation of tablets, and mobile broadband sticks, along with expanding 4G networks that offer download speeds comparable to cable, present compelling opportunities for Vodafone’s data business.

Mobile data is the fastest-growing part of the wireless industry. Industry-wide, data now accounts for 13% of revenue, up from 3% in 2006. By 2014, data is expected to account for 21% of revenue. In 2010 Vodafone’s mobile data revenue rose 26.4%. Based on dividend estimates for 2012, Vodafone shares yield a compelling 7.7%. What’s more, the board of directors has a medium-term dividend growth target of 7%. With a 7.7% yield and the prospect of meaningful dividend hikes in the future, what’s not to like?

The high level of regulation and taxation in the tobacco industry, as well as stagnant demand and litigation risk create high barriers to entry. The high barriers to entry give existing firms pricing power and allow them to remain unusually profitable. British American Tobacco is no exception. British American Tobacco, founded in 1902, today is one of the world’s largest tobacco companies. The company generates billions in free cash flow, with much of that cash flow coming back to shareholders in the form of dividends. British American targets a dividend payout ratio of 65%. The dividend has been increased every year since 1998 and over the last five years dividend growth has averaged 19.5%. Today, the shares yield 3.8%.

The performance of last year’s global equity markets offers investors at least two important reminders. Number one, it can pay to be patient. Many of the global equity markets that were down last year have enjoyed a nice rebound in 2012. Regardless of share price, investors can take comfort knowing they are receiving a consistent dividend payment when investing in the Vodafone and British American Tobaccos of the world. Number two is the continued degree of volatility in the global markets. We do not view this year’s stock market rally as anything but a respite from the many risks that continue to exist. We see problems ahead in terms of inflation, dramatically higher interest rates, dollar debasement, and market declines.

Our strategy with the purchase of equities continues to focus on what we believe to be big, durable, and lasting businesses. We invest in businesses with the potential to ride out economic downturns, distribute dividends, and raise those dividends annually. Ideally, these companies have strong balance sheets, pricing power, and operate in industries with high barriers to entry.

To complement the equities portfolio, we also favor bonds, gold, and foreign currencies. We appreciate the lack of enthusiasm investors have toward today’s bond yields. We are also frustrated with the Fed’s continued policy for a low-yield environment. But, bonds offer important diversification away from the stock market, helping to reduce portfolio volatility. Our bond portfolio tends to focus on shorter-term corporate bonds, which should limit volatility during a rising rate environment. We initiated our gold position in 2005 due to concerns about a declining U.S. dollar. As long we have dollar concerns, I expect us to maintain our gold and foreign currency positions.

Have a good month, and as always, please call us at (888) 456-5444 if your financial situation has changed or if you have questions about your investment portfolio.

Sincerely,

Matthew A. Young
President and Chief Executive Officer

P.S. Kimberly-Clark (KMB) has been in business for 140 years. Today nearly one-quarter of the world’s population buys KMB products each day including Kleenex, Scott, and Huggies. On February 28, KMB raised its dividend by 5.7%–the 40th consecutive increase. With a 4.1% yield and a consistent record of dividend increases, KMB is an ideal stock for our dividend-paying equity portfolio. Not as well known to most Americans is Sweden’s Svenska Cellulosa (SCA). We view SCA as the Kimberly-Clark of Europe. The company develops, produces, and markets personal care products, tissue, packaging, and forest products. SCA is the worldwide leader in incontinence care, the Nordic region’s leading diaper supplier (with 60% market share), Europe’s second-largest producer of corrugated board and containerboard, and one of the largest producers of corrugated board in China. SCA is also Europe’s largest private forest landowner with 6.4 million acres of forest. SCA is a basic consumer products company with valuable timber assets, and a strong balance sheet, trading at 12.5X earnings and paying an almost 4% dividend yield. What’s more, SCA has increased its dividend in 14 of the last 16 years. Over the last 10 years, dividends have compounded at an annual rate of 4.5%.

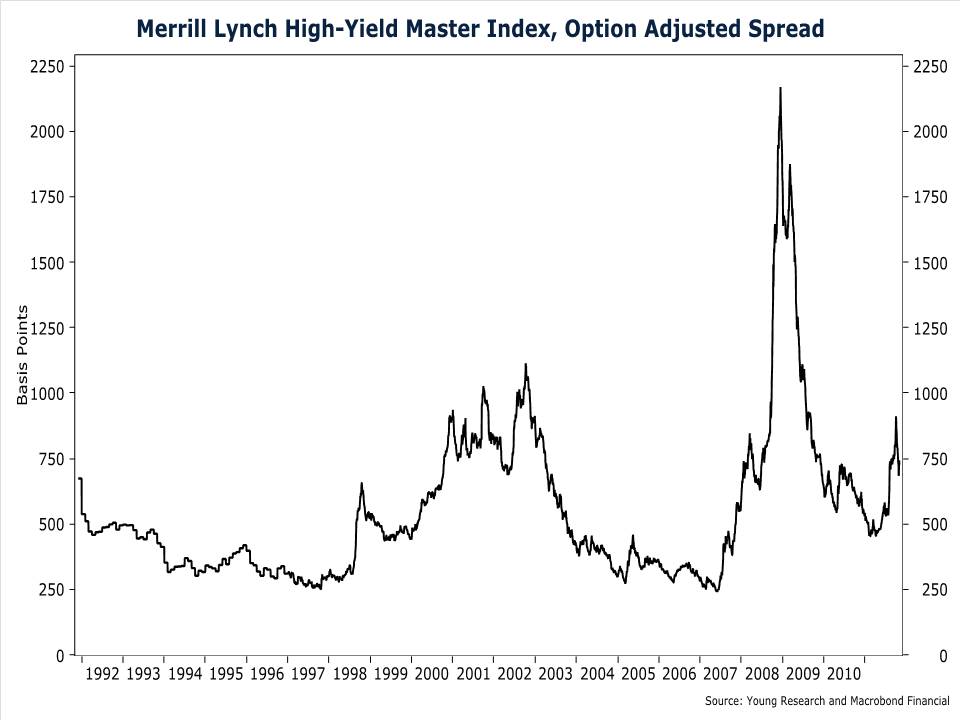
P.P.S. Next month I’ll preview some strategy adjustments we are making to fixed-income portfolios. In a yield-starved environment with economic data currently improving, the high-yield bond sector may offer areas of opportunity.

P.P.P.S. With the Federal Reserve pumping trillions of dollars into a global monetary system already soaked with liquidity, inflation is and will continue to be the result. For retired and soon-to-be-retired investors, the future inflation outlook should be alarming. Inflation is a destroyer of wealth—it’s compound interest in reverse. Owning commodities and hard assets that increase in value along with inflation may help. Owning stuff that’s in the ground can protect investors from a loss of purchasing power. As mentioned in this letter, Brazil and Canada are two countries we favor due to their wealth of natural resources.


Why Financial Market Have Been so Volatile

January 2012 Client Letter

One of the more common mistakes individual and even professional investors make is ignoring or underestimating future events. During the past three years, both the Dow and the S&P 500 posted positive returns. While 2012 could certainly be another favorable year, investors would be well advised to expect continued periods of high volatility.

During the last five months of 2011, wild gyrations became common in the equity markets. The S&P 500 plunged almost 13% in early August, and then rallied over 8% to close the month, only to fall another 10% in September. Then in October, stocks rose a remarkable 17% from trough to peak. The spectacular rallies and corrections continued in November with the S&P 500 falling 7.5% and then rising an equal amount in the span of four trading days.

While this period of heightened stock-market volatility has been particularly acute, elevated volatility has been with us since the financial crisis began. There are many ways to measure stock-market volatility. Some investors prefer to look at the VIX Index, which uses put options to measure the implied level of volatility in the market. A more intuitive measure is the percentage of trading days the S&P 500 moved by more than 2%. Since the financial crisis began in late 2007, the percentage of days when the S&P gained or lost more than 2% has been almost five times the post–World War II average. In 2011, approximately 14% of trading days resulted in a 2% or greater move in the index. And for the final three months of 2011, the figure was a Depression-era 32%.

Why have markets been so volatile? There are many possible explanations. But in our view, the primary driver is the ongoing tension between a global economy trying to cure structural imbalances and actions by policy makers intended to prevent or slow this corrective process.

In past letters, I have discussed the structural headwinds the world’s largest economies face over coming years. The sources of these headwinds are many and varied, but a common thread across the world’s largest economies is the misallocation of capital.

When capital is misallocated, either by force or by monetary persuasion, an unsustainable boom is created, which inevitably leads to a painful bust. The real-estate bubble is the most recent example of capital misallocation in the U.S. Years of easy money, low interest rates, and a central bank focused on levitating asset markets contributed to an atmosphere of excessive risk taking by lenders, borrowers, and investors. Lenders made no- and low-documentation loans to folk with no ability, or in some cases willingness, to repay those loans. Investors and borrowers essentially made leveraged bets on home prices, using leverage of as much as 33 to 1. The underlying assumption of all market participants was that the downside risk was limited. If home prices started to drop or the economy slowed, the Fed would flood the system with liquidity.

When the housing bubble finally burst, the Federal Reserve did indeed flood the system with liquidity, but the damage was too great for Fed Chairman Ben Bernanke to contain. Some of the nation’s largest lenders collapsed, speculators were crushed, and foreclosures surged. Home prices are down more than 30% from their peak. Home equity has evaporated for some and collapsed for many more. According to Core Logic, 22% of all properties with a mortgage are underwater, and an additional 5% have an equity cushion of less than 5%.

The market is still correcting the widespread misallocation of capital built up over a decade or more. Market participants are searching for a bottom in housing and consumption and the stock market, but policy makers are doing everything in their power to prevent or delay this inevitable result. Despite the failings and risks presented by the Federal Reserve’s unconventional monetary policy, Mr. Bernanke presses on.

In the 38 months that have passed since Lehman Brothers failed, the Fed has been on hold (not easing or threatening to ease) in only six of those months. The Fed’s liquidity injections haven’t helped the labor market or prevented housing prices from falling.                 

But they have distorted financial markets, increased volatility, decimated the income of many retired investors, and created a dangerous dependency on 0% interest rates.

In the aforementioned six months that the Fed has been on hold, the average stock-market return was -2.02%, with only two out of the six months resulting in gains. This is a policy-driven market. When the Fed stops supporting asset prices, risk falls out of favor. When the Fed injects liquidity, investors bid up the prices of risky assets. This risk-on, risk-off environment has created a great deal of volatility.

But the policy-driven market is not limited to the United States. Financial markets have reacted violently to every statement and rumor about a possible solution to the euro-area debt crisis. As in the U.S., economic forces in the euro area are trying to right years’ worth of capital misallocation, and policy makers are trying to prevent or slow the process.

The euro experiment created a common currency and monetary policy for a diverse group of countries, but left each country to run its own fiscal policy. Profligate spenders such as Greece and Italy were able to borrow at Germany’s much lower interest rates. The euro area’s peripheral countries temporarily “papered over” the deficit in their competitiveness with Germany by going on a borrowing binge. In Spain and Ireland, too much capital was invested in real estate, and bubbles resulted. In Greece and Italy, government largesse was the result. Historically, countries such as Italy and Greece could improve competitiveness via inflation and currency devaluation, but now they are tied to the euro, those channels are closed. In a fixed-currency regime, the only way to improve long-term competitiveness is through politically intolerable wage and price deflation. But with debt levels now at unsustainable levels, the jig is up for the euro area’s periphery. Debt defaults, fiscal union, and painful wage deflation are the remedy to create a sustainable currency union, but these solutions are easier said than done.

In financial markets, the euro-area policy makers’ attempts to prevent a collapse of the common currency have caused elevated volatility. When rumors that a lasting solution to the debt crisis emerge, risky assets rally, but when those rumors are squashed, risky assets tumble.

High Frequency Trading and Volatility

High-frequency trading has also heightened volatility in the stock market over recent years. U.S. equity markets have changed drastically over the last 5–10 years. Gone are the days when the NYSE and its specialists dominated stock-market trading. Today, as many as 50 different venues in the U.S. trade equities. Now, almost all stock trades are done electronically. The NYSE specialists who were once obligated to make an orderly market during periods of market stress have been effectively replaced by high-frequency trading firms (HFTs).

HFTs are opportunistic traders that operate with little capital, hold small inventory positions, and are under no obligation to make an orderly market during periods of stress. These firms use sophisticated ultrahigh-speed programs to predict stock prices milliseconds into the future. The most successful HFTs are not the firms with the best insights into a company but those with the fastest programs, located closest to the exchange’s servers. HFTs don’t use fundamental analysis to make trading decisions. Instead these firms use information in order books, past stock returns, cross-stock correlations, and cross-asset correlation to make decisions.

While some might believe HFTs are benign market participants, just the opposite is true. High-frequency trading now accounts for 70% of U.S. stock-market volume—an astonishing statistic, to be sure. The purpose of financial markets is to efficiently allocate capital to its highest and best use, yet a majority of the daily trading in stocks is conducted by investors with no interest in the value of the companies they buy and sell. HFTs are interested only in the price of a stock over the next second or two.

HFT proponents will tell you high-frequency trading poses no risk to the broader market, and in fact increases liquidity and keeps transaction costs low. The counterargument is that HFT liquidity is transitory and shallow (large orders are hard to fill), and while HFTs have helped drive down bid-ask spreads on stocks, they are extracting those profits from investors in other ways (some of the strategies are discussed later).

Because HFTs are not under the same obligation as NYSE specialists to provide liquidity, they often pull back from the market during periods of stress, creating a liquidity vacuum, which can result in cascading prices. The so-called “Flash Crash” in 2010 was partly caused by several major HFTs stepping away from the market in order to limit risk. Here is what a joint CFTC-SEC report on the Flash Crash said about the structure of today’s stock market.

The Committee believes that the September 30, 2010 Report of the CFTC and SEC Staffs to our Committee provides an excellent picture into the new dynamics of the electronic markets that now characterize trading in equity and related exchange traded derivatives. While these changes have increased competition and reduced transaction costs, they have also created market structure fragility in highly volatile periods. In the present environment, where high frequency and algorithmic trading predominate and where exchange competition has essentially eliminated rule-based market maker obligations, liquidity problems are an inherent difficulty that must be addressed. Indeed, even in the absence of extraordinary market events, limit order books can quickly empty and prices can crash simply due to the speed and numbers of orders flowing into the market and due to the ability to instantly cancel orders. Liquidity in a high-speed world is not a given: market design and market structure must ensure that liquidity provision arises continuously in a highly fragmented, highly interconnected trading environment.

More troubling than the transitory liquidity HFTs provide are some of the dubious strategies employed by these firms. Below are some examples of the strategies used by various HFTs—most are illegal but difficult for regulators to detect.

Front-running – Using computer algorithms to detect and trade ahead of institutional orders.

Quote stuffing – Submitting and then immediately cancelling trades in order to gain a few-millisecond speed advantage over the competition. The computers of the HFT who submits the erroneous orders don’t have to process that information, whereas the competitors’ computers do.

Layering – Using hidden orders on one side of a trade and visible orders on another side of the trade to manipulate prices. For example, if a trader wants to buy a stock at $5.01, but the current bid is $5.02 and the asking price is $5.03, the HFT may put in an order that is hidden to buy at $5.01. It will then flood the market with orders to sell at a price higher than the current asking price, let’s say $5.05. Others will see the selling pressure and adjust their bid and ask prices lower, likely hitting the HFTs intended bid price of $5.01.

Spoofing – A trader may initiate the rapid-fire submission and cancellation of many orders, along with the execution of some trades to “spoof” the algorithms of other traders into buying or selling more aggressively, which can exacerbate market moves.

My goal is not to suggest all high-frequency traders are unscrupulous or the practice should be banned (though I suspect few would actually miss it). But it seems to me high-frequency trading has become so vital to the proper functioning of today’s stock market that, at the very least, more oversight and disclosure should be required of these firms.

Even with the structural imbalances in the global economy and the potential for elevated volatility from high-frequency trading, we believe stocks could have a positive year in 2012. First, in the current low-interest-rate environment, many investors feel there is greater upside potential from stocks versus bonds. A bias toward stocks could help elevate share prices. Additionally, stocks tend to favor U.S. presidential election years. The election-year argument didn’t work out so well last time around, but in 2008 markets were in a bubble due to excessive leverage.

Even with the potential for a decent year in stocks, we do not favor abandoning our strategy for a globally diversified portfolio that includes corporate bonds. Short-term corporate bonds, which we currently favor, can greatly reduce volatility if misfortune or an unlikely event makes an appearance in 2012. Risks including the euro mess, the Middle East, and a less-than-robust U.S. economy are potential triggers for widespread market disruptions.

As most of us are all too aware, the stock market is an emotional and volatile place. Diversification is not about maximizing returns. Diversification is about reducing risk. A portfolio invested, by example, 50% in corporate bonds, 40% stocks, and 10% in gold and currencies should have much less downside volatility than a portfolio invested primarily in stocks.

Have a good month, and as always, please call us at (888) 456-5444 if your financial situation has changed or if you have questions about your investment portfolio.

Sincerely,

Matthew A. Young

President and Chief Executive Officer

P.S. The homepage of Younginvestments.com reads “Dividends and Interest. Cash Flow Is Our Focus.” For 2012, we continue to believe conservative retired and soon-to-be-retired investors are well advised to concentrate on the dividends and interest theme. A continuous stream of cash should provide comfort in an environment where stock volatility could remain high.

P.P.S. “Dividends are a bonus in up markets and provide comfort during slides. Over time, dividends have provided about 44% of the U.S. stock market’s annualized total return of 10%. And they are sure to remain an important component of returns if appreciation is hard to come by in coming years, as we expect. Thanks to dividends, you can make money even if the market essentially goes nowhere.” Kiplinger’s Personal Finance, January 2012

P.P.P.S. The fact that a company pays a dividend is only one criterion in our stock selection process. Beyond a cash payment, we seek high-quality companies, dominant in their industry, with high barriers to entry, strong balance sheets (in our opinion) and a manageable payout ratio. We believe that limiting our purchases to this type of company will allow our clients to sleep better at night and appreciate a continuous stream of cash payments during what should be an eventful 2012. The yield on our Retirement Compounders equity program is 5.1%.*

*Yield as of 1/23/2012


Tame Volatility with Balance not Market Timing

November 2011 Client Letter

Here is one problem facing investors: during August and September, the Dow Jones Industrial Average rose or fell by more than 1% on 29 days. By third quarter’s end, the Dow was down 12%, the largest quarterly percentage decline since the first quarter of 2009. This degree of volatility, which of course is great fodder for the media, can lead to knee-jerk decisions that send investment strategies off course.

One reaction to the volatility is selling and going to cash. Hitting the mattresses and living to fight another day worked pretty well in the 1980s, when yields on one-year T-bills were often higher than 7%. And for much of the 1990s, one-year T-bills hovered around 5%. Today, nervous investors have unappealing options, including money markets essentially offering no yield or a 2% yield on 10-year U.S. Treasury notes. At these low rates and with overall inflation running at 3.9%, investors who move to cash are pretty much throwing in the towel and accepting a loss.

Spooked investors who sold in September witnessed an October U-turn as the Dow quickly barreled ahead 6.6% in the first two weeks of October. The month finished at one of the biggest one-month gains since the early 1990s. Studies have been done illustrating how missing the best months of market returns can dampen investment returns. Investors who attempt to time the market run the risk of missing periods of exceptional returns just like we had in October.

Now, investors who sold out in September must decide whether to sit in cash and accept inflation risk or get back into the market and accept the potential for continued volatility.

It’s important for investors to understand their tolerance for risk. Risk varies for each investor. By example, volatility may not be the primary risk for the long-term investor. Instead, the long-term investor may be more concerned with the portfolio’s future purchasing power—in other words, keeping pace with inflation. This is definitely an issue for those who expect to be living for several decades.

Over longer periods, stocks have historically outperformed both cash and bonds. Additionally, the longer-term stock investor has reduced risk of loss compared to a shorter-term investor. Historically, over a one year holding period, the chance of losing money in the stock market has been about 33%, over 5 years, 22% and over 10 years, 13% (based on historical S&P 500 returns excluding dividends from year-end 1930-2010). But when you go out over longer periods, especially over 20 years, the risk of loss is minimal.  

Investors are living longer than before, and the rise in longevity means that retirees often face decades of investment decisions. More than likely, their main decision will be how to reduce portfolio volatility while having enough portfolio growth to keep pace with inflation. Most investors recognize the importance of an equity component to achieving their long-term investment goals.

Balanced portfolios often are less volatile than all-stock portfolios. Balanced portfolios feature a mix of both bonds and stocks. Historically, when stocks do poorly, bonds perform relatively well. And when bonds do poorly, stocks can help pick up the slack. This teeter-totter effect can help smooth out the volatility and reduce dramatic swings in portfolio values.

We currently suggest a portfolio featuring a mix of bonds, dividend-paying stocks, gold, and foreign currencies. Many clients at Richard C. Young & Co., Ltd., have at least 50% dedicated to bonds with approximately 40% in dividend-paying stocks and ETFs and 10% in gold and currencies (50-40-10).

A 50-40-10 mix can offer at least two benefits. The first is that a balanced portfolio with 40% invested in stocks should experience much less volatility than an all-stock index. During dramatic stock-market declines, a balanced portfolio should not take as wild a ride. (The flip side is that when the stock market soars, a balanced portfolio will often lag by comparison.)

The second benefit is that approximately 90% of the portfolio invests in securities paying interest or dividends. This regular stream of cash can help offset the negative impact of inflation. Such a portfolio has appeal to the longer-term investor concerned with inflation risk.

As I wrote in last month’s letter, the Federal Reserve’s August decision to hold short-term interest rates near zero for another two years pushed already low interest rates down even further. Yields on short- to intermediate-term Treasury securities are now under 1%. Investors looking for a 2% return in Treasury securities must now buy 10-year maturities. And those income seekers hoping to maintain the purchasing power of their money in full-faith-and-credit-pledge U.S. Treasuries are out of luck. The highest-yielding Treasury security, the 30-year T-bond, yields only 3.17%, compared to an inflation rate of 3.9%.

The Federal Reserve’s confiscatory monetary policy has greatly complicated the task of clipping bond coupons. Federal Reserve Chairman Ben Bernanke is seemingly unconcerned with the potentially devastating consequences of his repressive interest-rate policy.

The Fed is forcing investors who are the least equipped to shoulder risk into speculative investments. You either take the Fed’s bait by risking portfolio-decimating losses or sit in cash and lose purchasing power. We of course are resisting the Fed’s misguided push to invest speculatively, but we aren’t sitting idle. To navigate the current low-interest-rate environment, we are investing selectively in high-yield bonds and taking a more active approach by using a roll-down strategy.

Concern about a recession in the U.S., a hard landing in China, and most notably, a sovereign-debt-induced financial crisis in the euro area has pushed high-yield bond prices down, and yields up. In early October, the yield on the Merrill Lynch High-Yield Master II Index rose to 10% and today sits at nearly 9%. Of course, high-yield bonds offer such juicy yields because they are issued by borrowers who are less creditworthy than those in the investment-grade bond market. But in our view, at current levels, investors are being compensated for the added risk.

One of the data points we use to assess the value in high-yield bonds is the default rate embedded in prices. A simple back-of-the-envelope calculation can show the default rate that is priced into high-yield bonds. To make the calculation, you need only two variables: the spread on high-yield bonds (yield advantage relative to Treasuries), and the loss rate on defaulted bonds. The spread on the Merrill Lynch High-Yield Master II Index is 7.5%. Historically, the loss rate on defaulted high-yield bonds has averaged about 60%. To find the market’s expectation of the default rate, we simply divide the spread, 7.5%, by the loss rate of 60%. The result of 12.5% is the default rate that would set the return of high-yield bonds equal to the return on comparable-maturity Treasury securities. In other words, if 12.5% of the bonds in the Merrill Lynch High-Yield Master II Index were to default, the return on high-yield bonds would equal the return on comparable-maturity Treasuries (assuming a 60% loss rate on defaulted bonds).

How does a 12.5% default rate compare with history? According to Moody’s, the speculative-grade default rate has exceeded 12.5% only twice in the last 90 years—once during the Great Depression and a second time during the 2008 financial crisis. At current spreads, high-yield bonds are priced for calamity. Yet corporate fundamentals appear to be solid. Nonfinancial corporate debt to pretax income is at the low end of a three-decade range. Corporate profits and profit margins are at a record, and liquidity in the banking sector remains near record highs. We see limited downside risk and the opportunity for considerable upside.

For some clients, we recently purchased a high-yield bond from Sunoco Inc. Sunoco is a leading oil-refining and marketing company. Sunoco sells fuel through more than 4,900 retail gas stations in 24 states that are supplied by Sunoco-owned refineries. Sunoco is also the general partner and has a 34% stake in Sunoco Logistics, a pipeline company. As of June 30, Sunoco had $1.4 billion in cash on hand, compared to $2.5 billion in debt. We purchased Sunoco’s 4.875% bonds due in October of 2014 at a yield of nearly 5%.

A second adjustment we are making to portfolios to enhance yield is a roll-down strategy. A roll-down strategy seeks to profit from a steep and positively sloped yield curve (when long-term rates are higher than short-term rates). As a bond approaches maturity, its yield falls (assuming a positively sloped yield curve), potentially pushing up its price. With a roll-down strategy, an investor sells the bond after it rises in price and reinvests the proceeds in a longer-maturity bond.

Let’s look at an example. Today, five-year Treasury securities yield 1.038% and four-year Treasury securities yield 0.73%. If an investor buys a five-year Treasury security today for $1,000, in one year the bond’s price will rise to $1,012 (assuming no change in interest rates) so that the bond’s yield falls to 0.73%—the yield on four-year Treasuries.

Adding the $10.38 in annual interest the investor will collect,the value of the bond will be $1,022 ($10 in interest plus $1,012 in principal). That’s a 2.23% return—more than double the bond’s yield at purchase. Now, if the investor holds the bond to maturity, its price will eventually fall back to $1,000 and his return will equal the bond’s yield to maturity when purchased. But if the investor instead sells the bond at the end of year one, he can capture a capital gain and reinvest the proceeds in another five-year bond yielding 1.038%.

A roll-down strategy works best when the yield curve is positively sloped and interest rates are likely to remain stable. Today the yield curve is steeply positive, and the Fed’s commitment to maintain its zero interest rate policy until mid-2013 is likely to keep a lid on short- to intermediate-term interest rates.

As part of our roll-down strategy, we recently sold an AT&T bond due in 2013 at a price of $111.04 and yield of 1.29% and purchased an AT&T bond due in 2016 that was yielding 2.10% at a price of $103.67. We picked up 81 basis points in yield and for many portfolios captured a gain (above amortized cost).

During the past decade ending September 2011, the S&P 500 generated a not-so-great annual return of 2.81%. For many investors, this experience highlights the unpredictable nature of the stock market, even over a 10-year period. It’s important to remember that stock markets do not run on a schedule. They are random and unpredictable.

To cope with today’s speculative markets, we favor a defensive approach featuring a globally diversified portfolio of stocks and bonds. We emphasize companies that have strong balance sheets and operate in industries with high barriers to entry. And most importantly, we prefer securities that pay a steady stream of dividends or interest. Cash payments today and the promise of higher payments tomorrow are a comfort during periods of high volatility.

Have a good month, and as always, please call us at (888) 456-5444 if your financial situation has changed or if you have questions about your investment portfolio.

Sincerely,

Matthew A. Young

President and Chief Executive Officer

P.S. An important feature of our equity strategy is to focus on companies we believe possess the ability and desire to raise dividends annually. Companies with annual dividend increases are usually confident about their future earnings. These companies tend to be stable businesses well positioned in their markets and able to perform throughout market cycles, making them good candidates for long-term growth.

P.P.S. In October, the Conference Board Consumer Confidence Index plunged deep into recessionary territory. The index has only been lower twice in its more than four-decade history. Both episodes were associated with deep recessions. Why are consumers forecasting recession? Wasn’t October the best month in stocks in almost two decades? Maybe low consumer confidence has something to do with income. In the third quarter, real personal income excluding transfer payments fell for the first time since the recovery began. So we have millions who are scraping by with unemployment benefits, and those who are working are seeing their incomes fall. That doesn’t bode well for future economic growth.


Problems with the World’s 4 Biggest Economies

September 2011 Client Letter

Over recent years, we have advocated and pursued what we consider to be a defensive investment strategy. Our caution has centered on the troubling condition of the global economy. Today, the world’s largest economic players face powerful structural headwinds likely to constrain economic growth. Yet many economists, policymakers, and investors have operated with an optimistic outlook. We contend that problems exist and that many financial assets are not reflecting this reality.

According to the International Monetary Fund, the world’s four largest economies, in order of size, are the United States, the euro area, China, and Japan. In aggregate, these four countries generate almost 60% of the $69 trillion in global GDP. Most agree that without strong fundamentals in the “Big 4,” global economic growth will remain slow. Unfortunately, the fundamentals of the Big 4 are on shaky ground. I want to briefly describe some of the headwinds facing the world’s four largest economies.

The U.S. is riddled with problems, but debt is the nation’s biggest challenge. Over the last three decades, American households, businesses, and government borrowed too much. Debt growth outpaced economic growth by more than 100 percentage points. But debt can only grow faster than income for so long. There are limits to the amount of leverage a business, an individual, or a nation can service. In our view, the American economy has reached that limit. Deleveraging is now necessary.

Though you wouldn’t know it from looking at our debt-to-GDP chart above, the private sector has already started to deleverage. Household debt has fallen to .88X GDP from .98X GDP in 2009—the largest decline since records began over 50 years ago.

But if the private sector is deleveraging, why hasn’t total debt-to-GDP ratio fallen? Enter Washington.

Take a look at our next chart. Here we show the total amount of household and federal government debt. The drop in household debt has been more than offset by an increase in government debt. Policymakers have been reluctant to allow the economy to deleverage. But supplementing private-sector spending and borrowing with government debt and deficits only delays the inevitable. The status quo isn’t sustainable. The U.S. is borrowing almost 40 cents of every dollar it spends. On a $3.8 trillion budget, that adds about $1.5 trillion to the debt each year.

To prevent a debt crisis in coming decades, the federal government needs to reduce the national debt. However, if large reductions occur, it is important to understand that austerity is bearish for growth (and the stock market) in the short run. Government spending and borrowing are artificially keeping the economy stronger than it otherwise would be. If the U.S. balanced its budget tomorrow, more than $1 trillion in spending would be taken out of a $15-trillion economy.

So the global economy’s lead horse is on the verge of a deleveraging process that is likely to hold back economic growth in the medium term. The world’s second-largest economy is the euro area. As you may know, the euro area is neck deep in a sovereign debt crisis. Greece has been given lifeline after lifeline because, like policymakers in the U.S., euro-area policymakers are reluctant to accept the inevitable.

Even after a modest restructuring plan that was recently approved by euro-area policymakers, Greece has too much debt. A default appears to be the only long-term solution in sight today. The same may be true of the euro area’s other peripheral economies. The E.U. is advising austerity for overly indebted euro-area nations, but austerity isn’t working.

In 2011, the Greek and Portuguese economies are expected to contract by 3% and 1.5%, respectively, while economic growth in Ireland and Spain won’t break 1%. Lower economic growth raises the debt burden.

The euro area’s problem is not so much overly indebted members as it is a structural flaw in the currency union’s design. Euro-area economies are a diverse bunch. There are mature economies such as Germany that average growth of less than 2% and emerging economies such as Estonia that average growth in excess of 5%. When policymakers apply the same monetary policy to vastly different economies, imbalances result.

If the euro is to avoid a breakup, we see only one option that would permanently resolve the instability that is plaguing the region—tighter integration. A fiscal union or political union in conjunction with labor-market reforms and greater labor mobility would increase the stability of the euro area and the viability of the common currency. The problem with greater integration is that the polls show the public set against it. Citizens don’t want to give up their sovereignty. The frugal Finns don’t want to bail out the profligate Greeks, and more importantly, the Germans want no part of a fiscal union or anything like it. In Germany, a majority of the public thinks the original rescue of Greece was a mistake. And 60% reject offering further assistance.

That doesn’t bode well for the future of the euro, or economic growth in the region. The threat of sovereign default or a euro breakup is likely to weigh on euro-area growth until the matter is permanently resolved.

If the U.S. and the euro area aren’t going to lead the global economy, can China save us? China is, after all, the world’s fastest-growing large nation. We don’t have high hopes for such a scenario. It is true that China’s economy may contribute to global growth, but if you’re looking for a structurally sound economy, China is not it. China’s economy has serious structural flaws—which we believe are more severe than those in the U.S. or the euro area.

Though it is not often mentioned by China bulls, it is important to remember that China is still a command-style economy. Command economies have a long history of failure. The most common shortcoming of command economies is their propensity to misallocate resources. China is no exception. The Communist Party’s management of the Chinese economy has resulted in massive misallocation of capital in the country. An intentionally undervalued currency, poor incentives for political leaders, and a government-controlled banking system are all to blame. There is a property and fixed-asset investment bubble that, according to one formerly bullish China expert, could produce a “major, major economic correction.” Investment bank Standard Chartered estimates that about 50% of China’s GDP is linked to the fate of its real-estate market. That’s a scary thought, especially since Chinese policymakers have been tightening monetary policy in an effort to slow inflation. A hard landing could be in store for China. And if it is, investors crafting portfolios on the hope that China will drive global economic growth are in for an unpleasant surprise.

That leaves Japan. With GDP of $5 trillion, Japan is the world’s fourth-largest economy. Is Japan any more structurally sound than the U.S., euro area, or China? Do two lost decades of economic growth, persistent deflation, a declining population, and a government debt-to-GDP ratio of 200% seem structurally sound to you? Japan’s excessive government debt is a disaster waiting to happen. The country has managed to avoid financial collapse up to this point because it has been able to finance itself with private-sector savings at sub-2% interest rates. But Japan’s population is aging, and as it ages, the country’s savings rate falls. By 2015, the household savings rate is expected to dip into negative territory. If Japan can’t finance itself domestically, external creditors will have to close the gap. What’s the problem with Japan turning to external creditors? The problem is the rate of interest. At today’s sub-2% borrowing rates, debt service eats up 20% of government revenues. If external creditors demand a yield more on par with yields on U.S. and euro-area bonds, Japan’s debt service costs could consume the country’s budget.

All in all, it is a pretty bleak picture for the global economy. The world’s four largest economies, accounting for almost 60% of GDP, face major structural headwinds that are likely to weigh on growth in the medium term. And without vibrant growth in the “Big 4,” global economic growth is likely to muddle along at a lackluster pace.

Until the structural headwinds subside or financial markets start pricing in the challenged outlook for the global economy (the latter is starting to happen), we will maintain our defensive approach.

Our defensive approach relies on several tactics. First, we focus on cash-generating securities. A predictable stream of interest and dividend payments not only can supplement spending needs but also provides a sense of comfort that appreciating markets are not the only fuel for portfolio growth. Second, we primarily invest in bonds and stocks of companies we believe to be higher quality. High-quality companies tend to stay in business and tend to continually make timely interest and dividends payouts.

Third, while we believe in a diversified portfolio, we do not wish to over-diversify. Long bonds, technology shares, and much of euro land are currently not welcome in a Young portfolio. Instead, we include favorites like short-term corporate bonds, utilities, consumer staples, pipelines, Canada, and Switzerland.

Have a good month, and as always, please call us at (888) 456-5444 if your financial situation has changed or if you have questions about your investment portfolio.

Sincerely,

Matthew A. Young

President and Chief Executive Officer

P.S. The Fed’s August decision to hold interest rates near zero for another two years has pushed short-term Treasury rates of varying maturities down to levels near zero. The five-year Treasury now yields less than 0.95%. We are adapting our fixed-income strategy to the current environment to enhance portfolio yield. We plan to rely more heavily on a roll-down strategy and high-yield bonds, which have become more attractive in the recent market sell-off. I’ll describe each strategy in more detail next month.

P.P.S. Most investors understand the concept of total return. Total return is calculated according to the following formula: capital gains + dividend yield = total return.

Total return could also include a third element, dividend growth. When you have dividend growth, your investment has a better chance to keep pace with inflation.Our Retirement Compounders equity portfolio invests in 32 dividend-paying securities, and a majority of the securities increase their dividend annually. Today, our Retirement Compounders program has a current yield around 5%.

P.P.P.S. As recently noted in SmartMoney magazine, a regular check isn’t the only way that a dividend-paying stock can benefit retirees.
Recent research by Michael Goldstein, finance professor at Babson College, shows that dividend stocks as a group outperform nonpayers over time, in both up and down markets. Goldstein points out that dividend-paying companies tend to be more financially sound, which may account for the outperformance.


The Serious Challenges Facing Investors

August 2011 Client Letter

August has been a stark reminder of the serious challenges facing investors. Those lulled into a sense of complacency from double-digit market gains in 2009 and 2010 were rocked back to reality this month by three events. 

On Thursday, August 4, the Dow Jones Industrial Average posted its worst point-drop since the financial crises in December 2008. More bad days followed as the Dow dropped 4% during the week of August 15. For the month, the Dow was down almost 4.4%. Concerns are broad. In the U.S., the economy had been much stronger in the first half of last year compared to 2011. Real GDP rose at an annualized rate of 3.9% in the first quarter of 2010 and 3.8% in the second quarter. For 2011, GDP rose at a rate of 0.4% in the first quarter and 1% in the second quarter. In Europe, a debt crisis, which began in Greece, is widening to include far larger economies of Spain, Italy, and even France. While the U.S. has been officially out of recession for two years, the economy is still on shaky ground. If Europe can’t contain its debt crisis, the global economy could suffer a serious blow. Stock market volatility remains a threat.

U.S. Debt Downgraded

On Friday, August 5, Standard & Poor’s downgraded U.S. long-term debt to AA+ from AAA. As noted in The Wall Street Journal, the downgrade was not a big surprise. “Is there anything that S&P said on Friday that everyone else doesn’t already know? S&P essentially declared that on present trend the U.S. debt burden is unsustainable, and that the American political system seems unable to reverse that trend.” The downgrade further highlights the political mess we have had in Washington for years. Unfortunately, this mess plays too large a role in how the markets move, creating more uncertainty and making investing even more difficult. Not too long ago, corporate earnings momentum and price-to-earnings ratios guided successful investors. Today, the political climate and Fed action are a huge component in gauging the investment climate.

On Tuesday, August 9, the Fed, which has kept its short-term interest rate target at near zero for almost three years, announced a two-year extension of the low-rate environment. For most retired and soon-to-be retired investors, the Fed keeping a lid on short rates is a real killer. With millions of boomers nearing the end of their working lives, low rates result in meager returns on fixed-income investments. In 2006, the average one-year CD yielded roughly 3.78% according to Bankrate.com. Those yields today are roughly 0.4%. Average seven-day yields on the more than $2.5 trillion in assets in money-market mutual funds are near zero, at 0.01%, according to data provider iMoneyNet. In 2007 they hovered above 4.5%.

Concentrate on Dividend Paying Securities

Given an environment of high volatility, continued uncertainty, and low interest rates, we believe investors’ equity exposure should feature a concentration of dividend-paying securities.

Investing in dividend-paying companies is often seen as a way to defend against big swings in the market. Higher-quality, dividend-paying companies tend to withstand volatility better than lower quality or smaller companies. Dividend-payers also become more appealing in times of turmoil because their payouts help ease the pain from falling prices. And, as long as investors continue to receive their quarterly dividend check, the thinking goes, they are less likely to sell when the market declines.

Buy Dividend Raisers

When investing in dividend-paying securities, our goal is not to just choose the highest-yielding companies. An important feature of our strategy is to focus on companies we believe possess the ability and desire to raise dividends annually. Companies with annual dividend increases are usually confident about their future earnings. These companies tend to be stable businesses well positioned in their markets and able to perform throughout market cycles, making them good candidates for long-term growth.

Annual dividend increases are also a comfort to investors because of their predictability. Where the stock market will land on any given day, quarter, or year is anyone’s guess. The consistency of annual dividends takes away some of the mystery of investing.

Dividends Contribute Significantly to Total Return

A dividend strategy is not just a defensive strategy. Too often, the importance of dividends goes unnoticed, especially the contribution to total return from reinvested dividends. According to research from T. Rowe Price, dividends contributed more than 44% of the total return of the S&P 500 from the start of 1986 to the end of 2010. Reinvested dividends can also provide significant inflation protection in the form of a growing stream of income.

For years we have highlighted the benefits of dividend-paying stocks. Our Retirement Compounders equity portfolio is a globally diversified portfolio comprising 32 dividend-paying securities. Our challenge today is finding companies that pay a decent yield. Not only are rates low on fixed-income securities, but they are low in the equity universe as well. By example, the yield today on the S&P 500 is 2.15%—less than half our target yield of 5%.

When constructing our Retirement Compounders portfolio, we seek big, blue-chip type companies from across the globe. Canadian, Swiss, and Brazilian shares have been our primary international favorites, but we increasingly favor the Nordics.

The Nordics—sans Finland—offer the benefit of no direct euro exposure. For reasons I’ve outlined in past client letters, the euro is a currency we are avoiding. Within the Nordics, Sweden is our favored country today. Though we maintain a position in Statoil, the Norwegian integrated oil company in our Retirement Compounders portfolios, we aren’t buying the Norwegian krone or krone-denominated bonds today. In Sweden, we are buying both equity shares and bonds.

What we Like About Investing in Sweden

What do we like about Sweden? Sweden is the largest of the Nordic countries. It has a population of over 9 million and GDP of more than $400 billion. Sweden is a neutral country and a stable democracy (technically, a constitutional monarchy), and it is, of course, not a member of the euro zone. Unlike the U.S. and many of its European counterparts, Sweden is not burdened by excessive government debt. In fact, Sweden is one of the world’s few developed countries where government financial assets exceed government debt. And even ignoring the government’s financial assets, Sweden’s debt-to-GDP ratio is a moderate 40% and falling. Sweden is also projected to run a budget surplus in 2011 and 2012. Sweden’s strong public finances may even pave the way for a reduction in personal taxes. Contrast that with other countries in Europe and America where austerity measures are likely to act as a headwind to near-term economic growth.

Sweden’s Forward Looking Energy Policy

In terms of a forward-looking energy policy, Sweden is way ahead of the curve. Sweden’s goal is to be totally oil-free by 2020. Sweden has already reduced its energy-from-oil number to about 30% from near 80% in the 1970s. That’s impressive progress. Renewables are a major part of the equation. Renewables already account for 39% of Sweden’s energy consumption. And by about 2030, Sweden’s plan is to rely on renewable energy to supply two-thirds of its power. Along its coastline, Sweden has built water-power and wind-power plants. Sweden is also in better shape than any other country in the EU when it comes to forests, which puts Sweden in good shape for biomass. In 2009, biomass surpassed oil to become Sweden’s number-one energy source. Biomass today accounts for over 30% of Sweden’s energy needs. In a world of scarce conventional energy resources, a focus on renewables has appeal.

From a cyclical perspective, Sweden’s economy is recovering nicely. In 2010, GDP growth was 5.7%, and in 2011, forecasters are looking for growth of 4.7%. In contrast to the Federal Reserve, which continues to repress savers by holding short-term interest rates at zero, Sweden’s central bank, the Riksbank, is tightening monetary policy. Why? Swedish inflation of 3.3% exceeds the Riksbank’s inflation target of 2%. Inflation in the U.S. is 3.6%, but instead of tightening policy, our monetary policy authorities have decided to move the goal post. We are told it is not headline inflation that we should focus on, but inflation excluding food and energy—in other words, inflation excluding everything that is going up in price. Which central bank do you think will be a better steward of your money?

At its last monetary policy meeting, the Riksbank raised the repo rate (the main policy rate) by 25 basis points to 2.0%, and signaled that rates will increase gradually to a more normalized level. For 2012, the policy rate is expected to average 2.8%. A strengthening economy and rising short-term interest rates are bullish for Sweden and the Swedish krona.

An expected current-account surplus equal to more than 6.4% of GDP adds to the krona’s appeal, as does our estimate of the krona’s purchasing power parity (PPP). The krona is the cheapest of the major currencies on the basis of PPP. Our PPP work estimates fair value for the USD/SEK exchange rate at 6.30 compared to a current rate of 6.40.

To gain exposure to Sweden and the Swedish krona, we are buying Swedish government bonds and Swedish shares. On the bond side, we’ve purchased short-term government bonds with a yield near 1.5%. Comparable maturity U.S. Treasuries yield less than 10 basis points today. That’s a 1.40% yield advantage for Swedish government bonds.

Investing in Svenska Cellulosa

On the equity side of the ledger, we are buying Svenska Cellulosa AB, also known as SCA, and scouting for additional opportunities. SCA develops, produces, and markets personal care products, tissue, packaging, and forest products.

The personal care segment sells incontinence care products, baby diapers, and feminine care products. SCA’s brand for incontinence care is the world leader. In baby diapers, the company has a 60% market share in the Nordic region and is making inroads in Russia and Eastern Europe. The feminine care division is the market leader in the Nordic region. In the tissue business, SCA is Europe’s largest, and the world’s third-largest, consumer supplier. SCA’s packaging division is Europe’s second-largest producer of corrugated board and containerboard and one of the largest producers of corrugated board in China. The forest products division includes the sixth-largest publication papers manufacturer and one of the largest solid-wood product manufacturers in Europe. SCA is also Europe’s largest private forest landowner, with 6.4 million acres of forest.

SCA is a basic consumer products company with valuable timber assets, a strong balance sheet, and an attractive dividend yield. The shares also appear cheap, trading at a discount to book value and at less than 10X estimated earnings. The firm’s dividend policy is to provide long-term stable and rising dividends. SCA has increased its dividend in 14 of the last 16 years. The only year it was decreased was during the financial crisis in 2008. Over the last 10 years, dividends have compounded at an annual rate of 4.5%. At a 4.7% current yield, SCA’s shares are attractive in our view.

Of course an investment in SCA and Sweden is not without risks. Though Sweden doesn’t use the euro, Sweden’s economy would not be immune to a Greek- (or otherwise-) induced euro-area financial crisis. The euro area is one of Sweden’s major trading partners. A recession in the euro area would undoubtedly hurt Sweden and SCA. For SCA this risk is somewhat mitigated by the nature of the company’s products. Diapers, toilet paper, and incontinence products aren’t discretionary items, but a downturn could still hurt the company. As for the krona, the major risk from a euro-area financial crisis would be a flight to the perceived safety of the U.S. dollar.

Many global economies are straddled by structural deficiencies likely to weigh on their growth in the short to medium terms. We believe countries including Sweden, Canada, Brazil, and Switzerland are in relatively better shape than their neighbors.

Our investment approach in the current environment is one of caution. With U.S. GDP slowing, interest rates low, volatility and uncertainty high, inflation on the rise, and the tax treatment on qualified dividends still favorable, we continue to favor dividend-paying stocks that offer the potential of annual increases.

Also, bonds should not be ignored. We do not believe stocks today are cheap, and certain bonds can help dramatically limit portfolio volatility. While bond yields remain painfully low, we believe there are strategies to boost yield without taking ill-advised risk. I’ll go into detail next month.

Have a good month and, as always, please give us a call at (888) 456-5444 if your financial situation has changed or if you have questions about your investment portfolio.

Sincerely,

Matthew A. Young

President and Chief Executive Officer

P.S. In August, we initiated a position in the ProShares UltraShort 7–10 Year Treasury (PST). The fund gains when longer-term interest rates rise. At the time of purchase, rates moved near the panic lows of 2008. With inflation running at 3.6%, long-rates are negative in real terms. At some point, rates will rise, which will benefit PST. No doubt rates could fall further temporarily, but we would view the drop as another buying opportunity.

P.P.S. For many clients, we increased their position in BlackRock Dividend Achievers Trust (BDJ). In our view, the volatility in August provided a buying opportunity for BDJ. At the time of purchase, BDJ was selling at approximately a 9% discount to NAV, with a yield of almost 10%. We also bought Procter and Gamble, a company we sold in the past when its yield dropped. More recently, PG’s dividend has been increased without much rise in the share price. As a result the yield has risen to approximately 3.5%.

P.P.P.S. Our Retirement Compounders equity program is a globally diversified portfolio comprising 32 dividend-paying securities. Many of the companies, including AT&T, Coke, and Duke Energy are household names. Other companies, primarily the international ones, may not be so familiar. Included on our list of non-household names are Bonterra Energy, Brookfield Renewable Power, and Innergex Renewable Power. All three companies are Canadian, a country we have favored for many years. Canada had no bank bailouts and its unemployment is falling fast. Canada has the first conservative majority since 1993, has balanced its budget, and retired debt by collapsing government spending. Investors are pleased to see its corporate tax rate reduced to 15% and a reduction in its capital gains tax. All of these factors help underpin our continued enthusiasm for Canada as an investment destination.


Interest Rates Unattractive

May 2011 Client Letter

I sure would feel more comfortable if an attractive interest-rate environment accompanied today’s stock-market gains. While the Dow is up over 7% YTD, the yield on a five-year Treasury note is a lowly 1.7%. But a competitive interest-rate environment has not been a priority of the Federal Reserve. Instead, the Fed has kept its core short-term interest rate near zero while spending heavily on bonds to keep longer rates low.

By keeping rates low, the Fed has been able to recapitalize banks and prop up the financial system. Essentially, banks are allowed to borrow from the Fed at rates much lower than those available to you and me—near 0% interest. The banks then use the cheap borrowed money to buy longer-term Treasuries, lock in a nice profit, and boost their balance sheets. As banks become healthier, businesses and consumers are lured into using their credit cards again. Savers who are unwilling or unable to accept low yields on CDs and bonds jump into the stock market, which helps sustain the rally. As the markets rally, paper wealth is created and consumers head back to the shopping malls. With a wave of the magic money wand, the Fed has given the appearance that the financial crisis has been mitigated and a recovery has begun.

Today, many of the bankers who played a large role in creating the financial crisis are profiting once again, with large salaries and bonuses. On the flip side are the nation’s 50 million retirees, who have been significantly compromised through low interest rates received on their lifetime savings. It’s almost as if the retirees have financed the bank bailout. The rising stock market has helped the likes of Bill Gates, Warren Buffett, and Larry Ellison finally began to recover their losses and get richer and richer. Meanwhile, younger families, college graduates, and hourly workers, who tend not to have sizable investment portfolios, benefit less from the market rally.

Thanks to the Fed’s easy-money policy, the dollar has weakened, contributing to higher food and energy prices. These inflationary pressures hit retirees who operate on a fixed income and make it difficult for younger families, college grads, and hourly workers if their incomes do not keep pace with the rising costs.

And so we have an odd environment where the Dow Jones Industrial Average is currently on pace for its third consecutive year of solid appreciation, yet millions in our country are financially challenged. Many who are not financially challenged are concerned about the direction of the country’s finances. Not a day goes by without discussion and reports on the country’s annual deficits and budget problems.

Take, by example, this headline from the L.A. Times on May 16: “U.S. Hits Debt Limit and Takes Actions to Postpone a Default.” How worried should you be? The headline is of course referring to the U.S. hitting the congressionally mandated debt ceiling. When a country spends more than it collects in taxes, it must borrow. But since the U.S. hit its debt limit in mid-May, borrowing is no longer an option. Sounds like a problem—especially since the U.S. is running trillion-dollar deficits. In order for the country to borrow more, Congress must raise the debt limit. If it doesn’t, the U.S. could default on its debt—roiling financial markets. For being faced with an event with such cataclysmic consequences, the financial markets don’t seem too worried. Treasury yields are falling, not rising as one would expect if default were anticipated.

Why is the bond market so relaxed? Investors understand that the debt ceiling debate is a game of political chicken. Republicans are using the issue as leverage to negotiate a much-needed deficit-reduction plan. Congress will most likely raise the debt limit before it becomes a problem, and the U.S. won’t default on its debt—at least in the short term. In the longer term, U.S. solvency is not as clear.

The Congressional Budget Office projects trillion-dollar deficits for the next two years and a gross debt-to-GDP ratio well above 100% over coming years. And that is according to overly sanguine economic assumptions. Greece, Ireland, and Portugal all required bailouts at levels of debt to GDP near or below those projected for the U.S.

If the U.S. doesn’t pass a deficit-reduction plan, does it risk default? Yes, but not in the way you may think. You see, the main difference between the U.S. and the euro area’s peripheral countries is that the U.S. can print money. Greece, Ireland, and Portugal cannot. In the euro area, the European Central Bank is the sole supplier of money. The only way for Greece to reduce its debt is to collect more taxes than it spends. In the U.S., we have another option for reducing the debt burden—inflate it away. Given the choice between an outright default on government debt and a soft default via inflation, policy makers will always choose inflation. Investors in U.S. Treasuries shouldn’t worry about losing principal; they should worry about losing purchasing power.

You can be sure the world’s global central banks are worried about losing purchasing power in U.S. Treasuries. Global central banks hold over 30% of outstanding U.S. Treasury securities. They fully understand the consequences of failing to pass a comprehensive deficit-reduction plan. Some are even questioning the dollar’s role as the world’s reserve currency.

Will the U.S. Dollar Lose Reserve Currency Status?

What are the prospects of the U.S. losing reserve currency status, how soon could it happen, and what would the consequences be?

When you read that the U.S. is at risk of losing its status as the world’s reserve currency, it is important to understand that the dollar is not the world’s reserve currency, it is a reserve currency. Yes, it’s the primary reserve currency, but the euro, yen, and pound are also important reserve currencies. In fact, IMF data shows that dollar currency reserves make up 61% of allocated global currency reserves—down from 71% 10 years ago.

So the question isn’t whether the dollar will lose its role as the world’s reserve currency. The dollar’s importance in global currency-reserve portfolios has been gradually declining for years. The question is whether the dollar’s share of global currency reserves will decline suddenly. Analysts concerned that foreign central banks could wake up tomorrow and decide to liquidate their dollar reserves must ask themselves what would be purchased in place of dollars.

The Swiss franc would be at the top of my list. Switzerland is a neutral country, and the franc has proven over many decades to be a hard currency. We own francs in many portfolios for some of the same reasons. Why aren’t global central banks buying more francs? Because the Swiss economy is too small. There are over $9 trillion in global currency reserves. Switzerland’s GDP is only $500 billion.

The U.S. is the world’s largest economy, with annual GDP of $14 trillion. Though it isn’t a country, the second-largest currency bloc is the euro zone, with GDP of more than $12 trillion. The third- and fourth-largest economies are China and Japan—both with GDP of about $5 trillion. The fifth-largest economy is the U.K., with GDP of $2.1 trillion. Once you get past the five largest economies (counting the euro zone as one), you are looking at countries such as Brazil, Canada, and India. All have annual GDP of less than $2 trillion. When there are only two economies with GDP of more than $9 trillion, it should be clear that size is a major limiting factor in replacing the USD as the lead horse in global currency-reserve portfolios.

What are some of the other limiting factors? Convertibility is an issue for some countries, namely China. An inconvertible currency doesn’t serve much purpose as a reserve currency. China is also still a command-style economy. There may be some foreign governments that are comfortable investing in light of China’s ruling party, but there are many more that prefer a stable democracy and an established and transparent rule of law.

Another important factor for a reserve currency is military power. If you are a foreign central banker responsible for investing the reserves of your country, do you want to worry about a rogue nation attacking the country you are investing in? Though the risk is small, an adverse outcome could result in a total loss of capital. Any country lacking the means to properly defend itself is unlikely to take a leading role in currency-reserve portfolios.

When you consider the currencies large enough to replace the dollar, it is difficult to come up with a credible scenario in which foreign central banks suddenly liquidate dollars. What would these banks buy in place of dollars? The only currency that is even a potential contender is the euro. But the euro is a young currency, and its sustainability remains in doubt. Who wants to put most of their eggs in that basket?

Over the long term we expect that the dollar’s share in currency-reserve portfolios will decline, but the adjustment will be gradual, not sudden. In my opinion, there is no viable alternative to accommodate a sudden move out of dollars.

What are the investment implications of a gradual decline in the dollar’s share of global currency reserves? As fewer dollars are purchased by global central banks, there could be pressure on the dollar to decline—but the more likely scenario is that there will be pressure on U.S. Treasury rates to rise. If foreign central banks stop buying dollars, they stop buying Treasuries. The drop in the number of non-price-sensitive buyers would likely push up U.S. yields. Higher U.S. yields would likely result in greater demand for U.S. Treasuries, both at home and from abroad. Which asset classes are the losers in such a scenario? Long bonds and riskier assets. If investors can earn higher returns on full-faith-and-credit-pledge Treasuries, they will demand greater returns from higher-risk assets—and that means lower prices.

The federal government’s fiscal and monetary policies have created uncertainty and concern. And the Fed’s great money flood has complicated investment strategies. Many investors have fled the relative safety of money markets, CDs, and investment-grade bonds in favor of high-growth opportunities from the stock market. We view this shift as a misallocation of capital that could end up hurting many investors.

In general, we continue to favor a balanced portfolio that includes a mix of both stocks and bonds. While interest rates on bonds are much lower than in years past, we do not believe the dust has settled from the 2008 financial crisis. Stock-market volatility remains a constant threat, and shorter-term investment-grade bonds both provide a predictable stream of annual income and help to reduce overall portfolio volatility.

To diversify away from the dollar, we include a mix of gold and foreign currencies. Today, many of our favored foreign currencies are expensive, so we are limited in how much we can purchase. Recently, though, we added to our Swedish holdings. Sweden is a country we favor for many reasons, which I will highlight in June’s letter.

Have a good month, and as always, please call us at (888) 456-5444 if your financial situation has changed or if you have questions about your investment portfolio.

Sincerely,

Matthew A. Young

President and Chief Executive Officer

P.S. Currently, a three-month T-bill yields a lowly 0.05%. At some point, though, rates will begin to rise. Surges in interest rates are one of the biggest concerns for bondholders. We are implementing several strategies to deal with such an environment. One strategy is to gain exposure to debt securities whose interest payments adjust regularly. Floating-rate funds invest in bank loans made to lower-quality companies. The rates on these loans usually adjust every 30 to 90 days several percentage points above LIBOR. As rates rise, the yield on banks loans will rise as well.

P.P.S. An eventual rising interest-rate environment will likely be accompanied by inflation. Dividend payers, especially those that raise their payout annually, can have special appeal during inflationary periods. Unlike the interest received from most bonds, dividend payers offer the potential for a higher dividend payment each year, helping to preserve the purchasing power of an investment portfolio. Our Retirement Compounders equity portfolio has an approximate current yield of 4.5%. The Retirement Compounders portfolio of 32 securities invests in select sectors of the market, including energy, pipeline companies, utilities, and consumer staples. International holdings include Canadian, Brazilian, Swedish, and Swiss securities.

P.P.P.S. One of the few securities we own that does not pay interest or a dividend is gold. And gold is perhaps the only security we own whose price we hope declines in value. But as long as the U.S. printing presses continue to rumble and other concerning issues persist, we believe gold to be a necessary component of an investment portfolio. We are not as enthusiastic about silver. No doubt silver can act as a hedge against grim world developments, including inflation, currency debasement, and geopolitical fallouts. But in our view of late, gold appears to be the more stable metal of the two. There are several reasons for this. Silver has a much lower price compared to gold, which can be more attractive to the speculative crowd. The market for silver is much smaller than the market for gold, also lending to higher relative volatility. Lastly, central banks tend to favor holding gold over silver in their reserves, which helps with gold’s stability. In 2005, we started buying gold. Today, a combination of gold and foreign currencies accounts for approximately 10% of our clients’ portfolios.         


Bob Levy and Ed Crane in Naples

April 2011 Client Letter

In March, I met at our Naples office with Cato Institute chairman Bob Levy and cofounder and president Ed Crane. The goal was to increase my awareness of Cato’s research efforts and to review federal budget policies of the U.S. government. The Cato Institute is a public policy research organization dedicated to the principles of individual liberty, limited government, free markets, and peace. Cato has 13 primary research areas, including finance, banking and monetary policy, government and politics, and international economics and development.

During the seasonal months in Naples, Cato hosts seven invitation-only policy forums. The first forum, which I attended after meeting with Bob and Ed, focused on taming the federal budget. The inaugural Cato Naples briefing featured commentary on the budget from Chris Edwards, director of tax policy studies at Cato, and senior fellow Richard W. Rahn.

Mr. Edwards handed out a chart pack that allowed attendees to fully grasp the urgency of the message. In the chart “Federal Spending by Department,” the five largest annual expenditures are (1) defense at $761 billion, (2) Social Security at $742 billion, (3) Medicare at $488 billion, (4) Medicaid at $276 billion, and (5) net interest at $207 billion. Below the big five trailed a list of much smaller budget expenditures.

Congress has come up with a nifty scheme to deal with the budget crisis. In a nutshell, the idea is to nickel and dime the smaller budget expenditures and avoid the other five behemoths. It is clear to me, as it is apparently clear to the Cato analysts, that neither the administration nor Congress plans to address what appears to be a crisis. And here is the icing on the cake: net interest, which stands today at #5 on the spending list at $207 billion, is set on an uphill trajectory that will balloon it into the biggest, most bloated beast of all.

In a March 8 Washington Times article, Mr. Rahn wrote about the U.S. government’s serious overspending problem:

If the spending and the resulting deficits are not soon stopped, the U.S. economy will become dysfunctional, and our prosperity and freedoms will disappear. Despite the overwhelming evidence that the government is headed for a debt crisis, there are still a few economists who are saying: “Spend more.” Last week, one of the “spend more” crowd, Mark Zandi of Moody’s, made the absurd claim that the attempt by the Republicans to cut the budget by approximately $60 billion (or less than 2 percent of total federal spending) would result in 700,000 lost jobs. The Democrats and their media allies, of course, jumped on the opportunity Mr. Zandi gave them as their latest excuse not to reduce spending. Instead, they have proposed cutting the budget by one quarter of 1 percent.

On the monetary side, which Bob, Ed, and I also discussed, the Federal Reserve continues backing up the money truck. There has never been a more accommodative monetary policy in the 235-year history of the United States than there is today. The power of the 0% interest rates and the printing press cannot be overstated. Since the Fed first signaled to the market that round two of quantitative easing was likely, stocks have soared, with the S&P 500 climbing 22% and the speculative Nasdaq advancing 27%. Meanwhile, the dollar index has tumbled 9.1%. The CRB commodities index has gained 26%.

With commodities prices surging and inflation pressures heating up in certain sectors of the economy, the financial press is loaded with articles offering advice on how to protect your portfolio from inflation. One of the more common recommendations is to buy Treasury inflation-protected securities (TIPS). This advice sounds reasonable. If you want to protect your portfolio from inflation, why not buy inflation-protected bonds?

In our view, buying TIPS today to protect your portfolio from inflation would be a mistake. It is not that we are averse to TIPS. In fact, we own a legacy position in TIPS for many of our clients. The problem with TIPS as an inflation hedge is one of price. TIPS yields today are far too low. By example, the yield on the Vanguard Inflation-Protected Securities fund is currently -0.05%. The last time we purchased TIPS for clients, yields were north of 3%.

If you aren’t familiar with TIPS, the yields I am quoting are real yields. TIPS earn a real yield plus compensation for the rate of inflation. So everything else equal, if inflation is 2% over the next 12 months, the Vanguard Inflation-Protected Securities fund should earn 1.95% (-0.05% in real yield plus 2% in inflation compensation).

The potential mistake in buying TIPS as an inflation hedge today is that investors cannot separate the inflation-protection component of TIPS from the real-yield component. Even in an inflationary environment, an adverse move in real yields could cause TIPS prices to plunge.

With real yields near historic lows, the probability of an adverse move in real rates is uncomfortably high. Take a look at my real 10-year Treasury yield chart. Here I am simply taking the historical nominal Treasury rate and subtracting the average inflation rate over the previous 10 years. Over the last five decades, the real 10-year Treasury yield has averaged 2.71%. Today, real yields are 0.99% as measured by 10-year TIPS. By historical standards, real yields are low. If real yields rose 1.70% to their historical average, theoretically TIPS prices would plummet 14%.  

That -14% price change assumes an instantaneous rise in interest rates, but even if you use more conservative assumptions, the return implications still aren’t pretty. If you assume a three-year holding period, a 1.7% rise in real yields, and inflation of 4% annually, 10-year TIPS would return 1.15% annually for the next three years. That’s far below the assumed inflation rate of 4% in my example.

Another sector of the fixed-income markets we continue to avoid is municipal bonds. We sold our clients’ muni-bond positions in 2009 and early 2010. Our concern was that states and municipalities were facing severe budget pressure that was likely to result in elevated muni defaults. The sales turned out to be timely. Since November of last year, muni bonds have sold off. My chart shows that the iShares National AMT-Free Municipal Bond Fund (MUB) fell 8.8% from October 31 to January 14. The fund has since recovered some of its losses but is still down 6.9% from its high.

We continue to avoid munis for some of the same reasons we sold them in 2009 and 2010. State and municipal budgets are strained. In our view, more defaults are unavoidable. Will defaults reach into the hundreds of billions as some analysts are projecting? I don’t know, and neither does anybody else. State and municipal finances are famously opaque. Municipal financial statements, if you can even locate them, are filed with a long lag.

Historically, investors paid little attention to issuer financial statements. Most muni issuers bought AAA ratings by paying for municipal bond insurance. But many of the muni-bond insurers went bust or were severely downgraded in the financial collapse. Insured AAA ratings are no longer prevalent in the muni market. The finances of underlying issuers must be evaluated. That’s no easy task when there are tens of thousands of different issuers.

What concerns us most about muni bonds is not so much the prospect of massive defaults. Rather, it is the potential for panic selling. According to Barron’s, 70% of the investor base in muni bonds is individual investors. The folk who own these bonds don’t analyze muni-bond credits full-time. If muni defaults start to pile up, panic selling may ensue. With long muni rates still below 5%, it could be a long way down before value buyers step in to stabilize prices. Who needs the potential volatility at such low yields?

Instead of buying TIPS and municipal bonds we currently favor a short-duration portfolio of GNMAs, individual corporate bonds, and bank loans. Bank loans are a new fixed-income sector we’ve added to many portfolios.

Bank loans are also referred to as floating-rate loans or leveraged loans. Bank loans are generally made to businesses with below-investment-grade ratings. They are most often secured by collateral of the borrower, such as receivables or inventories. Bank loans are the most senior security in a company’s capital structure, ranking ahead of even secured senior debt. That gives bank-loan investors first priority on assets in the event of default. Compared to similarly rated high-yield bonds, bank loans have historically had lower default rates and higher recovery rates. According to Moody’s, the long-term average recovery rate of bank loans is 70%, compared to 40% for high-yield bonds.

Bank loans are often issued at a spread of 250–300 basis points to three-month London Interbank Offered Rate (LIBOR). LIBOR is an interbank lending rate that is used as a benchmark for private-sector borrowing rates. The average maturity of bank loans is about four years, but because they are floating-rate instruments, bank loans have a duration of close to zero. When interest rates move up, bank-loan investors get a pay raise. In other words, bank loans have almost no interest-rate sensitivity, although there is credit risk. According to S&P, the current yield to maturity on bank loans is approximately 4.8%.

The total size of the bank-loan market is estimated at about $515 billion. Bank-loan investors include insurance companies, banks, hedge funds, and mutual funds. This is an institutional asset class. Bank loans aren’t securities individual investors can just go out and purchase. You need large sums of capital and adequate support staff to deal with the legal and operational complications of managing a bank-loan portfolio.

To gain exposure to the bank-loan market, we are buying the Fidelity Floating Rate High Income Fund (FFRHX). FFRHX is a conservatively managed bank-loan fund. The fund manager tends to avoid the most speculative deals in the bank-loan market.

When you consider the current environment, bank loans can make sense. Banks are flush with liquidity. Companies that need to refinance maturing debt should. With risk appetite in the fixed-income markets on the rise, investors will be looking to pick up additional yield in lower-rated securities. An improving economy also points to higher interest rates. Since bank loans are floating-rate instruments, they benefit from rising rates. The 30-day SEC yield on FFRHX is 2.65%. The yield is a bit lower than the average yield in bank loans both because investors must pay an expense ratio, and because the fund favors high-quality credits. The yield is still compelling when compared to a similar-duration three-month T-bill, which offers a yield of only 0.13%.

Given the wildly expansionary and unsustainable fiscal and monetary policies of the U.S. government, we believe the prudent investment course for conservative investors is a defensively constructed allocation. For fixed-income investing, we favor relatively higher-quality bonds with short- and intermediate-term maturities.

On the equity side, we are constructing a globally diversified portfolio featuring securities that pay out decent dividends rather than rely solely on capital appreciation. One of our favored domestic names has been Verizon, with its 5% dividend yield, which has increased in each of the last four years. Also, we have added Canada’s Peyto Exploration & Development to many client accounts. Peyto, a low-cost natural gas producer, owns a portfolio of natural gas reserves with an estimated life of 21 years. Peyto shares yield close to 4%.

Have a good month, and as always, please call us at (888) 456-5444 if your financial situation has changed or if you have questions about your investment portfolio.

Sincerely,

Matthew A. Young

President and Chief Executive Officer.

P.S. We recently acquired bonds from Brazilian oil company Petroleo Brasileiro, or Petrobras. The energy giant, based on market cap, is the eighth-largest company in the world. By the end of this decade, some predict that Petrobras will pass ExxonMobil to become the largest publicly traded oil company in reserves and production. As CEO Sergio Gabrielli explains, “What we can say is that we have a lot of oil. We have an asset base in our own portfolio that, on an organic basis, can grow faster than anyone else.”

P.P.S. “Officially reported job growth is better in the last couple of months, but jeez, nonfarm payrolls today are at about the same level as May 2009. That’s almost two years with no net gain. And the rotten employment and new home sales readings come on the heels of a mega money-printing campaign at the Fed. What happens when the press shuts down this summer, when QE2 ends, and when the Bernanke-driven Free Money Truck exits the hood? It is an outrage that the Fed subsidizes Goldman Sachs, while Mr. and Mrs. Goldman, private citizens, hunkered down in a Boca retirement condo, are getting four basis points of T-bill interest on their retirement savings. Are Americans paying any attention to this appalling expropriation? No wonder gold and the Swiss franc are trading at record prices.” Dick Young, April 2011.

P.P.P.S. With the Swiss franc trading near record prices, we recently reduced our position in the currency. Historically, investors have viewed the franc as a safe-haven currency. But, with today’s sovereign debt problems in Europe and reckless money printing by the Fed, the franc has become a go-to currency to hedge against debasements. In our view, the franc has been overbought and over-owned by speculators. We continue to favor the franc on a long-term basis and will look to add to our position again in the future. For additional currency diversification, we have begun taking positions in Swedish holdings. I will profile Sweden and recent purchases next month.


A Conservative Strategy is the Mandate

February 2011 Client Letter

The value of the U.S. stock market has doubled from its March 2009 lows and has vaulted almost 30% since this past August. Fueling the bull stampede is the Fed’s continued ultra-accommodative monetary policy, improved economic momentum, a pre–presidential election year (the average stock-market return in year three of a presidential cycle is 17.5%), and investors’ rising risk appetite (flows into stock funds are on the rise). Wall Street strategists seem optimistic: recent average price targets for 2011 project that the S&P 500 will reach 1,400, an 11% gain.

However, while 2011 is generally off to a good start, we remain cautious. For starters, the yield on the S&P 500 is 1.8%. In our view, such a low yield is an indication that stocks aren’t cheap. Today, we believe we are in the early stages of an upward trend in interest rates and inflation. The euro-debt crisis remains unresolved. Like U.S. policy makers, euro-area policy makers continue to kick the can down the road. China and other emerging markets also pose a risk to the global economy. There is much to worry about in China. There is a real-estate bubble in coastal cities that could derail growth, there is an overreliance on fixed-asset investment, and there is an emerging inflation problem. Inflation is also beginning to heat up in some of the other large emerging markets. Monetary policy will have to be tightened to prevent an inflation spiral. Tighter money in emerging markets could result in slower-than-expected global economic growth.

So, while the stock market appears to be in friendly territory today, we have a variety of concerns as we look forward. Our general recommendation is to maintain a relatively conservative and balanced portfolio that emphasizes interest and dividend-paying securities.

The heart of our Retirement Compounders equity portfolio is an emphasis on domestic and international dividend-paying stocks. In particular, we favor companies with pricing power and those that increase their dividends annually. A combination of pricing power and annual dividend increases is an often-overlooked defense against the potential nasty effects of inflation.

Coca-Cola Dividend Story

Take Coca-Cola, by example. Coke’s consistent annual dividend hikes have helped the stock reach a new decade high. Coke’s dividend was increased to $1.76 in 2010 from $0.68 in 2000—a compound annual growth rate of 10%. Coke has increased its dividend annually for 48 consecutive years.

Coke was established in 1886 and is the world’s largest beverage company today. Coke boasts a portfolio of nearly 500 brands, including 13 billion-dollar brands. The flagship Coca-Cola brand is naturally the most valuable of the 13 billion-dollar brands. Coca-Cola has topped Interbrand’s ranking of the world’s most valuable brands since 2001, when rankings began. Interbrand estimates the Coca-Cola brand is worth over $70 billion—an amount greater than the combined brand value of McDonald’s and Disney.

While Coke’s headquarters are in Atlanta, the company is truly a multinational operation. Coca-Cola beverages are served to consumers in more than 200 countries at a rate of 1.6 billion servings per day. North America accounts for only 17% of operating income. Europe makes up another 29% of operating income, while the faster-growing regions of Asia, Latin America, and Africa account for 51% of operating income. It is in these faster-growing economies where Coke’s future growth potential resides. Consider the opportunities in the world’s two most populous nations. The combined population of China and India is over 2.4 billion. The annual per capita consumption of Coke products in India is 9, and in China it is 32. The annual per capita consumption of Coke products in the U.S. is 399, and in Mexico it is 665. Per capita consumption in China and India could increase tenfold and still not exceed per capita consumption in the U.S.

Of course, Coca-Cola’s success does not depend solely on emerging markets. Coke must also maintain relevance in more mature markets. Innovation is vital here. Products like Coke Zero, which was introduced only five years ago, can help Coke maintain market share in developed economies such as the U.S and Europe. Since its launch, Coke Zero has been the industry’s best-growing new brand, with double-digit sales growth each year. Since 2001, there have been 350 new sparkling beverages introduced to the market. Only six ever breached 1% market share. Only one, Coke Zero, has been able to maintain that milestone. Owing to the rapid growth in its popularity, Coke Zero is on track to break into the top 10 most popular sparkling beverages in the U.S.

My long-term price chart shows Coca-Cola shares have recently broken out of a 10-year trading range.

TC Pipelines

TC Pipelines (TCLP) is another favorite with a strong record of consecutive annual dividend increases. TCLP is a master limited partnership (MLP) that owns and operates interstate natural gas pipelines in the United States. It owns 50% of the Northern Border pipeline, measuring 1,249 miles long; 100% of the Tuscarora pipeline, measuring 240 miles long; and 46.45% of the Great Lakes pipeline, measuring 2,115 miles long. The three pipelines have a combined receipt capacity of 5.06 billion cubic feet of gas per day. TCLP also owns the 80-mile North Baja pipeline. The North Baja cuts across Arizona and through Southern California until it meets another pipeline at the Mexican border.

Long term, we expect U.S. natural gas demand to increase. Natural gas is cleaner than coal, safer than nuclear, and much cheaper than oil on an energy-equivalent basis. And thanks to new drilling techniques and technologies that have unlocked vast stores of shale gas across the United States, natural gas can be produced in abundance domestically. Greater production and use of natural gas should increase the demand for natural gas infrastructure. According to the Interstate Natural Gas Association of America, the U.S. will need to boost pipeline capacity by as much as 20% to transport new natural gas supplies to growing markets.

In our view, the economics of the pipeline business have appeal. The barriers to entry are high, demand is stable, maintenance capital spending is modest, and revenues are often inflation-adjusted. The frequent dividend increases and high yields of pipeline MLPs also don’t hurt. TCLP has increased its dividend in each of the last 10 years. Today the shares yield 5.6%.

Like the pipeline business, the hydroelectric power industry also has favorable economics. Hydroelectric power plants are a conservative way to profit from a potential long-term secular increase in fossil fuel prices. How does hydro power benefit from higher fossil fuel prices? Let’s look at an example. Assume that natural-gas-fired power plants are the source of electricity with the highest marginal cost. If the price of natural gas rises, natural-gas-fired power plants would face higher costs. These greater costs would be passed on to consumers in the form of higher electricity prices. Since prices are set at the margin, the highest-cost kilowatt-hour sold sets the market rate. In our example, this would be electricity generated from natural gas power plants. When electricity prices increase, all power plants earn more revenue, but those powered by natural gas (and coal, since coal and gas are substitutes) would also face greater costs. Since hydroelectric power plants rely on water to generate electricity, their input costs don’t change when natural gas prices rise. Hydroelectric power plants get the upside of higher electricity prices when fossil fuel prices rise, without a corresponding increase in costs. Rising revenues and stable costs of course lead to greater profitability. We own two high-yielding Canadian hydroelectric power companies, Brookfield Renewable Power Fund and Innergex.

Brookfield Renewable Power Fund

Established in 1999, the Brookfield Renewable Power Fund is a Canadian income trust (with plans to convert to a corporation in 2011). The company is Canada’s largest publicly traded renewable power firm and one of the largest power income funds in North America, with 1,652 megawatts of installed capacity and average annual production of 6,382 gigawatt-hours.

As its name implies, Brookfield Renewable Power Fund owns renewable power assets. The company’s assets consist predominately of hydroelectric plants and wind farms. Almost 90% of Brookfield’s installed capacity is hydroelectric. The company owns 6 facilities in Quebec, 18 in Ontario, 3 in British Columbia, and 15 in New England.

Hydroelectric power plants are some of the most attractive power-generation assets investors can acquire. There are few moving parts and no high-heat combustion to worry about. As a result, hydroelectric power plants have long lives, low maintenance requirements, and strong reliability. Hydro plants also have some of the lowest operating costs in the industry. The U.S. Energy Information Administration estimates that the total operating expenses of a hydroelectric power plant are 84% cheaper than a coal- or natural-gas-fired power plant.

Brookfield Renewable Power Fund sells the electricity it generates under long-term, fixed-price purchase agreements with partial-inflation escalation clauses to utilities, industrial companies, and Brookfield Renewable Power Inc., a wholly owned subsidiary of Brookfield Asset Management. Brookfield Renewable Inc. guarantees all of Brookfield Renewable Power Fund’s purchase agreements with industrial companies and itself. Renewable Inc. owns 50% of the Renewable Fund. Renewable Inc. has been in business for more than 100 years. The company is a highly experienced owner and operator of renewable energy facilities. In 2009, Renewable Inc. was Renewable Fund’s largest customer, accounting for 66% of revenues. Renewable Inc. maintains a strong balance sheet and is rated BBB by S&P. In the event Renewable Inc. were to run into financial difficulties, Brookfield Renewable Power Fund could always find another wholesaler to sell its electricity, but the fixed purchase price agreements would be voided.

The trade-off for the purchase-agreement guarantees that Renewable Inc. provides to Brookfield Renewable Power Fund is that it gives up some of the potential upside from rising electricity costs. Brookfield Renewable Power Fund aims to distribute 80% of profits as dividends, and for a 2% long-term dividend growth rate. The shares currently yield 6.1%.

The other Canadian hydroelectric power producer we own for clients is Innergex. Innergex is a leading developer, owner, and operator of run-of-river hydroelectric facilities and wind energy projects in North America. In its current form, Innergex Renewable Energy Inc. was formed in March of this year via a merger between Innergex Power Income Fund and the old Innergex Renewable Energy. Innergex Power Income Fund was an owner of hydroelectric power-generating facilities and wind farms. The old Innergex Renewable Energy was a developer, owner, and operator of hydroelectric and wind energy projects. Prior to the merger, the development and ownership of power-generating assets were split. The merger was structured as a reverse takeover so that the Innergex Power Income Fund could convert from a Canadian income trust to a corporation.

Innergex owns a portfolio of projects including interests in 17 operating facilities with operating capacity of 326 megawatts and seven projects under development with capacity of 203 megawatts. Like Brookfield Renewable Power Fund, Innergex’s business is primarily concentrated in hydroelectric power. Innergex shares yield 5.9%.

Three years ago, many were concerned about a second coming of the Great Depression. Those concerns seem to be gone in much of the media and Wall Street analysis. I guess they don’t make depressions like they used to. In our view, it’s not prudent to have a short memory regarding the recent financial meltdown. The Fed is flooding the financial landscape with liquidity, which can mask deep problems remaining in our economic system. A quick look at the real estate and unemployment picture should raise red flags about the issues still facing America.

Until our economic and geopolitical outlook changes, we continue to favor a conservative and defensive portfolio featuring short-term corporate bonds, gold and currencies, and of course, a globally diversified mix of common equities that pay out a dividend year after year, along with regular dividend increases.

Have a good month, and as always, please call us at (888) 456-5444 if your financial situation has changed or if you have questions about your investment portfolio.

Sincerely,

Matthew A. Young

President and Chief Executive Officer

Bond Bubble. Bonds performed so well in 2010 that some analysts have described today’s action in the bond market as a bubble. However, I am not ready to label the portfolio of bonds we manage as being in a bubble. The dot-com bust and the real estate collapse were examples of bubbles where some investors lost as much as 50% or more on their investment. A majority of the bonds we hold have an overall duration of 2. Duration is a measure of a bond or a bond fund’s sensitivity to interest rate changes. The shorter the duration, the less a bond will decline in price as interest rates rise. You can estimate the percentage change in the price of a bond based on its duration. By example, a bond with a duration of 2 can be expected to decline in price by approximately 2% for every 100-basis-point increase in interest rates. If interest rates begin to soar, it’s the longer end of the bond market that will feel the most pain.

Muni Concerns. One of our primary concerns regarding municipal bonds is the potential for panic selling. According to Barron’s, 70% of the investor base in muni bonds is individual investors. The investors who own these bonds do not tend to analyze muni bond credits full-time. If muni defaults start to pile up, many investors are likely to panic-sell as we witnessed with preferred securities during the financial crisis. And with long muni rates still below 5%, it could be a long way down before value buyers step in to stabilize prices. Today we continue to avoid the municipal bond market.

Performance Cycles. To help hedge against a declining dollar, we own positions in CurrencyShares Swiss Franc (FXF) and SPDR Gold Shares (GLD). Both had nice returns last year, with FXF up 10.5% and GLD up 29%. YTD, both positions have gained a little, while the NASDAQ is up nearly 5%. Despite the divergence in performance, we continue to favor the defensive characteristics of FXF and GLD. And while the NASDAQ is on a nice charge, it’s wise to remember that the index is still down 30% since December 31, 1999.


Adding Currencies to a Portfolio

December 2010 Client Letter

With momentum appearing to be behind the stock market, now may be a good time to review one of the most important considerations of investing: risk. Risk tolerance varies among individuals and even varies for the same individual during different market environments and time periods. Because an investor’s tolerance for volatility is subjective, risk tolerance can be difficult to measure precisely.

It’s helpful to read through a stock or fund prospectus to refamiliarize oneself with the broad variety of risks associated with investing. Business cycle risk, liquidity risk, credit or default risk, prepayment risk, currency risk, political risk, and systemic risk are among the usual suspects with potential to cause chaos. Investing in SPDR Gold Trust (GLD) carries several risks including official-sector risk. The official sector consists of central banks, other governmental agencies, and multilateral institutions that buy, sell, and hold gold as a part of their reserve assets. In the event future economic, political, or social conditions or pressures require members of the official sector to liquidate their gold assets all at once or in an uncoordinated manner, gold prices could decline significantly.

During periods of stock-market appreciation, it can be easier to dismiss the potential for loss. As the stock market goes up and our paper gains rise, we can become less sensitive to the fact that markets are always cyclical and unforeseen circumstances remain a constant threat.

Even the smartest folk around can get head-faked. Remember Long-Term Capital Management? Long-Term Capital was a hedge fund in the 1990s whose partners included Nobel Prize winners and MIT PhDs. The company used complex mathematical formulas to assess fixed-income arbitrage deals. The 1998 Russian financial crisis caused havoc for Long-Term’s trading strategies and nearly ruined the financial system. I think it was the Long-Term debacle that inspired Warren Buffett to say “Beware of geeks bearing formulas.”

Many conservative retired or soon-to-be retired investors prefer a mix of both bonds and stocks to help reduce volatility. While investing in a portfolio of all equities may provide the best long-term returns, there is a greater chance for steeper loss than with a broadly diversified portfolio. For those who have spent a lifetime accumulating their wealth, steep losses are an unacceptable outcome.

I periodically highlight the long-term performance of Vanguard’s Wellesley Income Fund. Wellesley, with approximately 60% in bonds and 40% in equities, has posted only six down years since 1970. Perhaps most impressively, the fund was down only 9.8% in 2008. While future results may vary, Wellesley offers a long-term example of how broad diversification can reduce risk and provide comfort for conservative investors.

For years we have used Wellesley as a guide for conservative asset allocation. At Richard C. Young & Co., Ltd., we also incorporate some additional strategies we believe will add value to client portfolios. One of those strategies is including gold and foreign currencies. We began taking initial positions in gold in 2005, and several years ago we added a currency component.

Why We Invest in Currencies

Currency investing is unfamiliar territory for many investors, but it shouldn’t be. The global foreign-exchange market is the largest, most liquid market in the world. According to the Bank for International Settlements, daily turnover amounts to nearly $4 trillion. To put that into perspective, the daily turnover of U.S. stocks is only $40 billion, or 1% of turnover in global currency markets.

The Opportunities in Currencies

Those not investing in the world’s largest market may be forgoing considerable profit opportunities. Currency markets are unique in the sense that not all market participants are motivated by generating profits from their currency trades. Compare this dynamic to the stock market. In the stock market, when you sell a position, the buyer thinks he is acquiring a stock that will move higher while you take the opposing view. Both buyer and seller are most often motivated to trade based on a desire to earn or capture profits. In currency markets, you have central banks, multinational corporations, and individuals, among other participants, who have no opinion on the currencies they are exchanging. Central banks transact in currency markets to manage their exchange rates. A company like Coca-Cola that builds a new plant in Indonesia, by example, isn’t looking to make currency profits on the dollar-rupiah exchange. Coke is more interested in the profits it will earn on the new plant it is building. And a family taking a trip to Europe isn’t exchanging dollars for euros to make a profit. They need euros to pay for goods and services on their vacation. The presence of these non-profit-motivated participants creates opportunities for profit-seekers.

Monetary & Economic Trends in Currency Investing

In our view, currency profit opportunities are best exploited by following a wide variety of global economic and monetary trends. An exclusive focus on the U.S. economy won’t get you far in currency investing. When you buy foreign currency, it is important to understand you are simultaneously selling dollars. In stock-market terms, this is similar to a long-short trade. An investor may buy shares in Home Depot and sell short shares of Lowes. It is not the fundamental performance of Home Depot that determines the return on this position, but the fundamental performance of Home Depot relative to Lowes. Similarly, when you buy the euro, it is the relative fundamentals of the euro and the U.S. dollar that drive the exchange-rate value of the euro. So you can be bearish on the U.S. dollar, but if you are more bearish on the euro, you would buy the dollar-euro currency pair.

Numerous factors can cause an investor to be bullish or bearish on a currency. Valuation, interest-rate differentials, inflation expectations, trade balances, economic growth, price action, and politics and geopolitics can all influence exchange rates over the short and long term. Consequently, currency investors pursue various strategies. Some investors focus on fundamental analysis such as interest rate differentials and valuation, while others rely exclusively on quantitative analysis or technical analysis. Interestingly, both approaches have proven their worth in currency investing.

Purchasing Power Parity and Currency Investing

At Richard C. Young & Co., Ltd., we focus on the fundamentals, with a particular eye on valuation. Like a stock or a bond, an exchange rate has an intrinsic value. Economists refer to this as purchasing power parity (PPP). PPP is based on the law of one price, which states identical goods should sell for the same price in two separate markets.

The most famous example of PPP is The Economist’s Big Mac Index. No matter where in the world you buy a Big Mac, you get the same three sesame-seed buns and two all-beef patties smothered in American cheese and piled high with lettuce, onions, pickles, and McDonald’s special sauce. According to PPP, since you are buying an identical good, the dollar cost should be the same everywhere. To measure the PPP value of currencies, The Economist collects the prices for a Big Mac around the world and translates them into dollars. Countries where a Big Mac is more expensive than in the U.S. have an overvalued currency, and countries where a Big Mac is cheaper than in the U.S. have an undervalued currency. Though the Big Mac Index may sound like a simplistic approach to currency valuation, it is often surprisingly accurate. According to the latest Big Mac Index, the Chinese yuan is undervalued by about 40%, and the euro is overvalued by about 30%. More sophisticated PPP methods come up with valuations that are not far from those generated by the Big Mac Index. Simple is indeed sophisticated.

We, of course, do not base our currency investment decisions on the Big Mac Index, but we do use PPP to value currencies. Over the long run, currencies tend to revert to their PPP values.  However, the long run can last for an extended number of years. In the interim, currencies can deviate widely from their PPP values. It is also not uncommon for widely overvalued currencies to become more overvalued before eventually returning to their PPP values. As a result, a currency strategy based exclusively on valuation can be a losing strategy. We supplement our PPP work with an evaluation of relative interest rates, trade positions, political and geopolitical factors, and price action, among other variables. This more inclusive approach results in a diverse portfolio of short- and long-term currency positions.

Our position in the Swiss franc is a longer-term hedge against the U.S. dollar. While we currently believe the franc is richly valued against the dollar on the basis of purchasing power parity, we view it as a hard currency likely to maintain its value even if the deterioration in U.S. currency fundamentals accelerates.

In contrast to our strategy with the Swiss franc, we closed our position in the Canadian dollar earlier this year due to valuation. We continue to favor the underlying fundamentals of the Canadian economy, but at the time of our sale we felt the Canadian dollar’s valuation was stretched. We favor Canada’s long-term prospects and will likely reacquire a position in the Canadian currency when the valuation improves or the country’s interest-rate differential with the U.S. widens.

Interest-rate differentials are the motivating factor behind the position we hold for some clients in Norwegian government bonds. We initiated a position in Norwegian government bonds near the height of the Greek debt panic earlier this year because we felt the currency was oversold, the bonds offered an attractive yield advantage to U.S. treasuries, and the Norwegian government has a net-asset position compared to the massive debt positions of almost every other developed country. We purchased an 11-month bond with a yield of more than 2%. Comparable U.S. Treasuries were yielding only 0.28% at the time.

When Trading Makes Sense

One notable difference between our stock-investing strategy and our currency-investing strategy is that, with the exception of gold, we believe it is advantageous to trade currencies. In the long run, currencies should revert to their PPP rates. Since the PPP rates of most major currency pairs vis-à-vis the dollar exhibit no meaningful long-term trend, one should not expect a sustained long-term gain in a given currency position. My relative PPP chart on the British pound highlights this concept. Over the last 20 years, the PPP value of the pound has changed little. Not surprisingly, there has been no sustained long-term gain or loss in the dollar-pound exchange rate. If you initiated a position in the pound in 1990 and closed the position today, your currency profits would sum to zero. However, if you traded the pound, you could have made significant profits. An investor who purchased the pound at year-end 2001 and sold it at year-end 2004 would have made 52% in only three years.

Expanding our currency diversification as a result of the 2008 financial crisis was just one of the many adjustments made to portfolios during the last two years. Additional adjustments include the sale of all preferred securities and municipal bonds, as well as a greatly reduced position in U.S. Treasury securities. Many of our lower-yielding stocks have been replaced by higher-yielding international companies. Recent foreign equity purchases include Brookfield Renewable Power, Companhia Energética, Innergex Renewable Power, Statoil and Tele Norte Leste Participacoes. We also have less invested in traditionally managed mutual funds. Instead we find value investing in select exchange-traded funds (ETFs). ETFs offer us many diversification options with expenses much less than most traditional mutual funds.

Have a happy New Year and, as always, please give us a call at (888) 456-5444 if your financial situation has changed or if you have questions about your investment portfolio.

Sincerely,

Matthew A. Young

President and Chief Executive Officer

P.S. The investor who has a long-term horizon, or expects to live for many years, faces a risk perhaps worse than portfolio volatility. The erosion of purchasing power by the long-term effects of inflation is a major risk. Historically, the risk of portfolio loss from market declines diminishes over time. The good years should outnumber the bad years, resulting in a long-term positive return. The negative effects of inflation, on the other hand, are amplified with each passing year. We look to offset the effects of inflation by investing in companies that annually increase their dividend, investing in industries with pricing power, and investing in a variety of natural resources, including energy and agriculture.

P.P.S. In an interview with 60 Minutes earlier this month, Ben Bernanke said he feels the fear of inflation is overstated. The Federal Reserve favors the “core CPI” as its measure of inflation. Core CPI strips out food and energy prices. So if you are not concerned with eating or driving, then the effects of inflation should be minimal to you. (Avoiding medical attention, travel, and college tuition are other ways to minimize the effects of inflation). Today we believe inflationary pressures do exist, and investors should be preparing.

P.P.P.S. While the U.S.’s share of the world’s gross domestic product has been declining for decades, profits to U.S. companies from abroad are on the rise. In 2009, the U.S. exported about $1 trillion worth of goods, and it is expected to exceed that in 2010. As the rest of the world expands, demand will increase for airplane engines, cars, computers, and other heavy industrial equipment. Investing, as we do, in big U.S. companies that generate a significant amount of their revenues internationally is a simple way to participate in the growing global economy.


Investing in Emerging Markets: Brazil

November 2010 Client Letter

In the early 1980s, the stock market’s tank was fueled up and ready to roll. Short-term interest rates had topped 19% by January 1981. In October 1981, 30-year mortgages were 18%. As interest rates began a two-decade secular decline, the stock market exploded. From August 1982 through March 2000, the S&P 500 returned an amazing 19% a year, nearly double what it had returned the previous five decades. A whole generation of investors grew accustomed to a seemingly endless run of asset growth.

Today we have an interest rate environment that is a one-eighty reversal of the early 1980s. If declining rates helped the stock market for 20 years, what will happen if we have a secular incline in rates? I believe today’s investors face a daunting environment ahead in the form of much higher interest rates and inflation.

For the time being, inflation does not appear to be an immediate concern. As I wrote last month, the Fed has signaled a willingness to restart quantitative easing. Quantitative easing is a fancy name for money printing. When the Fed engages in quantitative easing, it simply buys Treasury securities from member banks. As the Fed buys more Treasuries, yields are driven down.

With uncompetitive U.S. Treasury yields and somber growth prospects in the U.S., some investors are piling into emerging-market equities. According to EPFR, a firm that tracks fund flow data, year-to-date emerging-market equity inflows now exceed last year’s record-setting $44.2 billion.

The case for investing in emerging markets is often based on growth. Economic growth in emerging economies is widely expected to outpace growth in the developed world. The argument is greater economic growth leads to rising corporate profits. Since corporate profits drive stock prices, greater economic growth must drive emerging-market shares higher. Simple, right? Unfortunately, while this investment thesis sounds well reasoned, it doesn’t hold up to scrutiny. An examination of the historical record shows there is little correlation between a country’s stock-market returns and its rate of GDP growth.

There are many reasons GDP growth and a country’s stock market returns are not correlated. As many investors painfully learned in the tech-stock bubble of the late 1990s, high rates of growth don’t necessarily translate into higher stock returns. If investors are anticipating high growth, chances are that growth is already baked into prices. It is also possible that industries experiencing the highest rate of growth in an economy may be inaccessible to stock-market investors. This is especially true of emerging economies, where capital markets are underdeveloped. The majority of businesses in an emerging economy could be private, state-owned, or foreign-owned.

It is also important to evaluate the quality of economic growth and not just the quantity. In an economy such as China’s, where the state is still heavily involved in the economy, GDP growth is high but quality is low. China’s currency is intentionally kept undervalued to subsidize business, loans are granted on preferential terms to industries and businesses favored by policy-makers, and there are distortive incentives to encourage excessive fixed-asset investment. In our view, China’s economic growth model fosters overcapacity and uneconomic business ventures—neither are conducive to sustainable stock market gains.

Allocating funds to emerging markets solely on the assumption that high future economic growth results in higher stock-market returns is not a strategy we follow. We take a more systematic approach to investing in emerging markets. We pay attention to the growth prospects of an economy but also consider valuation, political stability, economic policy, currency values, interest rates, and investor transparency, among other things. When we evaluate these factors today, Brazil appears to compare favorably to other emerging markets.

Brazil is a  middle-income country with a population of about 200 million. GDP growth averages between 4% and 5%, half of what it is in China and India. Unlike many emerging-market countries, Brazil is not overly dependent on commodities or exports. Brazil’s economy is highly diversified, with personal consumption expenditures accounting for 60% of GDP and exports accounting for only 11% of GDP.

In contrast to the single-party system in China, Brazil is a democracy with a government structure similar to that of the U.S. Brazil is divided into 26 states and one federal district, each with its own local government. The national congress is bicameral. The federal senate, the upper house, comprises three senators from each state and three from the federal district. Senators serve eight-year terms. The lower house is the Chamber of Deputies. The chamber comprises 513 deputies who are elected to serve four-year terms.

The executive branch comprises a president and vice president who run on the same ticket and are elected to four-year terms. The president has a two-term limit. He serves as both head of state and head of government and appoints his own cabinet.

Brazil’s independent judiciary consists of a supreme federal tribunal with 11 judges appointed by the president and confirmed by the senate, a higher tribunal of justice, and regional federal tribunals. Judges are appointed for life but face mandatory retirement at age 70.

For an emerging market, Brazil’s corporate governance requirements offer foreign investors a level of comfort not attainable in some emerging markets. There are four different levels of corporate governance: Standard, Level 1, Level 2, and Novo Mercado. All publicly held companies are required to disclose material developments to the securities regulator.

Level 1 companies must disclose an annual corporate agenda and consolidated financial statements, but these can be based on local standards. Level 2 and Novo Mercado must prepare quarterly and annual financial statements in English and according to IFRS or US GAAP. Novo Mercado is the highest level of corporate governance. In addition to publishing international financial statements, Novo Mercado companies have share class restrictions and independent board membership requirements.

Long term, we believe Brazil is well positioned to succeed in a competitive global economy. Brazil owns what the world needs. The country is the world’s leading exporter of iron ore, coffee, soy, orange juice, beef, chicken, sugar, and ethanol. Brazil has 958 million acres of highly productive arable land, with 222 million acres yet to be farmed. Brazil holds 12% of the world’s fresh water supply and generates 73% of its energy needs from renewable hydroelectric power. Brazil is also home to one of the top 10 largest oil reserves in the world, the Tupi field.

Brazil’s endowment of vital natural resources is an important component of our investment thesis on the country, but not the only reason we are investing there. For decades, Brazil’s economy suffered from political and economic instability. Hyperinflation and currency debasement were common themes. Instability distorted the economy. Prohibitively high interest rates and volatile growth made corporate and household borrowing impractical.  However, since former president Cardoso implemented economic reforms that  have been maintained by current president Lula da Silva, economic vibrancy and vitality have returned to Brazil. Though still elevated, inflation and interest rates have come down considerably over the last decade. Brazil’s government debt is now rated investment-grade, total debt to GDP is only 45% compared to over 60% in the U.S., and foreign currency reserves stand at $264 billion, which is equivalent to 15 months of imports.

To gain exposure to Brazil we are investing in Brazilian real–denominated debt, individual Brazilian companies, and the Market Vectors Brazil Small-Cap ETF. We favor the Market Vectors fund over the large-cap fund iShares MSCI Brazil for two reasons. First, the iShares Brazil fund is dominated by a handful of companies. In our view, the fund lacks proper diversification. Second, the largest weightings in the iShares fund are in multinational companies. Multinationals are influenced more by the global economy than the Brazilian economy. We believe the Market Vectors fund provides more direct exposure to Brazil’s economy.

Of course, our investment case for Brazil is not without risks. We favor a meaningful position in the country, but no more than that. Brazil is still an emerging market. Political and economic stability are a recent phenomenon. Free-market capitalism is not embraced by all in Brazil. There is heightened risk of government meddling in the private sector. Hot foreign money inflows are also a risk, as are Brazil’s uncompetitive tax code, burdensome regulations, and rigid labor laws.

In our view, it is the ongoing transition from instability to stability that offers the most promise for investors in Brazil. We view an investment in Brazil as a secular re-rating story. Over the long term we expect interest rates to decline, the currency to appreciate, the economy to remain strong, and asset price valuations to rise to reflect this new economic paradigm.

Have a good month and, as always, please give us a call at (888) 456-5444 if your financial situation has changed or if you have questions about your investment portfolio.

Sincerely,

Matthew A. Young

President and Chief Executive Officer

P.S. Lately, there has been some grumbling among the CNBC analysts and the Wall Street crowd about the low-growth prospects of AT&T (NYSE: T) and Verizon (NYSE: VZ). It may be true that AT&T and Verizon are fighting for a smaller piece of the maturing domestic wireless market and the wireline business has not evolved for decades. But at Richard C. Young & Co., Ltd., our focus is on cash flow and compounding, not chasing growth stocks around the big board. AT&T and Verizon are major cash generators, and the companies are sharing that cash with shareholders. Each company offers a current yield approaching 6%.

P.P.S. Another high-yielder we are buying for clients is Bonterra Energy. Bonterra is a Canadian oil and gas company based in Calgary, Alberta. Bonterra’s assets are located primarily in the Pembina field in Central Alberta. The firm’s reserve base is long-lived and considered to be low-risk and predictable. At current production rates, Bonterra has a 20-year supply of oil and gas as well as a land base that offers a 14-year inventory of drilling opportunities. Bonterra’s production and reserves are weighted about 75% oil and 25% natural gas. The company’s dividend policy is to pay 60% to 75% of cash flow out to shareholders. Dividends are paid monthly and may vary depending on oil and gas prices. Today Bonterra’s shares yield 6.5%.

P.P.P.S. One of our favorite closed-end funds today is BlackRock Enhanced Dividend Achievers Trust (BDJ). BDJ focuses on equities of companies that have long, steady records of dividend increases. BDJ maximizes its own distributions by using a covered-call strategy to increase payments to shareholders. The trust’s current distribution rate exceeds 11%. Top holdings in the fund include Johnson & Johnson, Procter & Gamble, and General Dynamics. We look to buy BDJ when its price drops below net asset value.