Buy Your Straw Hats in Winter

April 2020 Client Letter

Last month, I wrote to you about Ben Graham. Graham was a student of psychology and ahead of his time in behavioral economics. He recognized that investors were far from the calculating, perfectly rational actors many economists assumed. Instead, investors are often motivated by fear and greed. As Graham described it, “The investor’s chief problem—and even his worst enemy—is likely to be himself.”

Over the years, we have written often about emotionalism and how emotionally charged investment decisions can sabotage portfolio performance. At Richard C. Young & Co., Ltd., our goal is to help you maintain a degree of psychological and emotional comfort during your retirement years.

One way we help you maintain comfort is through consistency. As my dad explained over a decade ago:

Consistency through cash flow—that is the goal at our family investment management company, and that is my primary goal for you in these strategy reports. Clients of our family management company are most often soon-to-be-retired and retired investors or conservative small business owners saving for a secure retirement. And it is just such a conservative group I write to monthly. As most of you know, I grew up in Shaker Heights, Ohio, during the Paul Brown/Otto Graham Cleveland Browns era. I learned about consistency from Graham and Brown. Over their 10 years together, the duo racked up a .854 winning percentage.

This consistency has never been matched by another coach and Q.B. Over Graham’s 10 pro seasons, Graham and Brown never once failed to win a division title and play for the championship.

A full 55 years later [and now 65 years later in 2020], I have not forgotten the lesson of consistency I learned from Paul Brown and Otto Graham. Our family investment company office at 500 Fifth Ave. in the heart of Old Town Naples, Florida, is dedicated to Paul Brown, Otto Graham, and the Cleveland Browns of their era. [Our office is now located at 5150 Tamiami Trail North, Suite 400, Naples, Florida 34103].

Over the four and one-half decades [five and one-half now] I have been advising investors, my emphasis on consistency through cash flow and the miracle of compound interest has never changed. When you lose 50% on an investment, you have to make 100% the next time out just to get even. And that is with a zero return. When you focus laser-like on investments that pay you cash in the form of dividends or interest, you mute portfolio volatility and the propensity for debilitating loss.

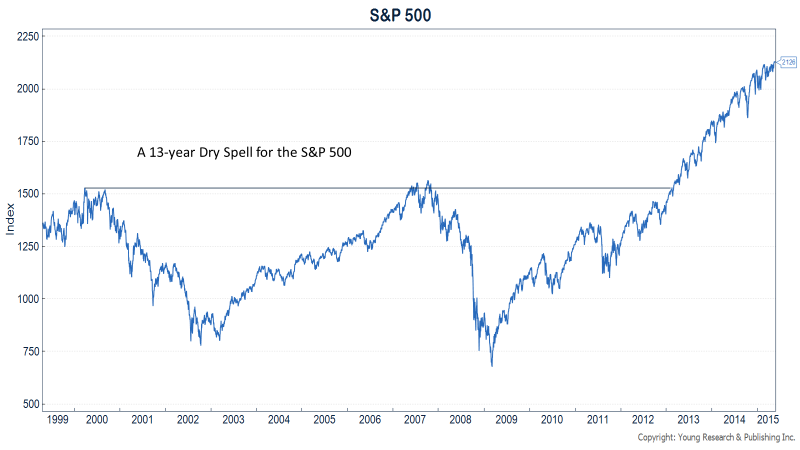
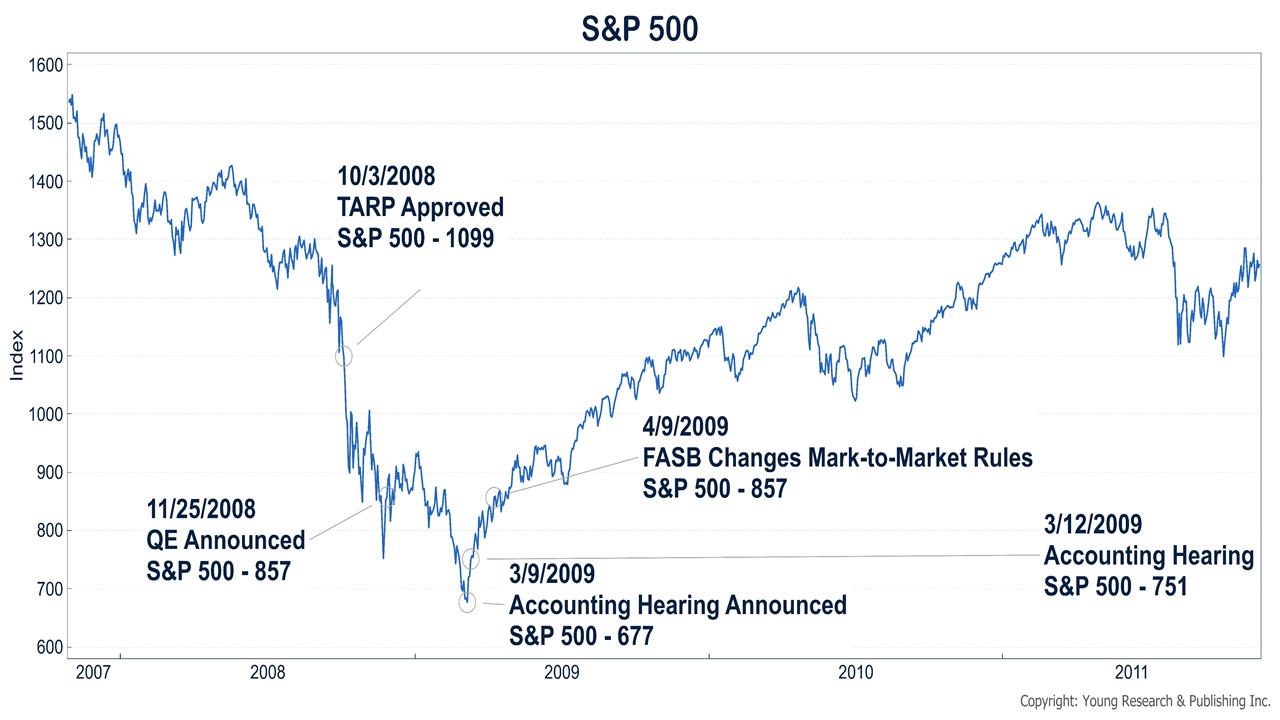
As of my last letter, I had no idea how your comfort (and mine) would be tested over the ensuing days. The stock market fell from an all-time high into a bear market in record time. It took a total of 16 trading sessions for the S&P 500 to fall 20% and 23 sessions for it to drop 34%.

The selling was indiscriminate in late February and March. Bull markets often end with a process that takes months to complete, not days. By example, during the last bear market, stocks hit their final high in October 2007 but didn’t officially enter a bear market for another eight months. Not this year!

Uncertainty and Anxiety

What is unsettling to many about the virus is its unprecedented nature (in our lifetimes) and the vast uncertainty it has created. We don’t know the path, the true fatality rate, how many people are actually infected, the prospects for herd immunity, the ultimate economic toll, or when we can expect our lives to get back to normal.

Uncertainty causes anxiety and discomfort in people and markets, but it also creates opportunity.

I obviously cannot will the virus out of existence or provide certainty where none exists, but my goal is to offer you comfort during a period of tumult and explain where we see opportunities for your investment portfolio.

Your Portfolio Was Positioned Defensively Heading into the Downturn

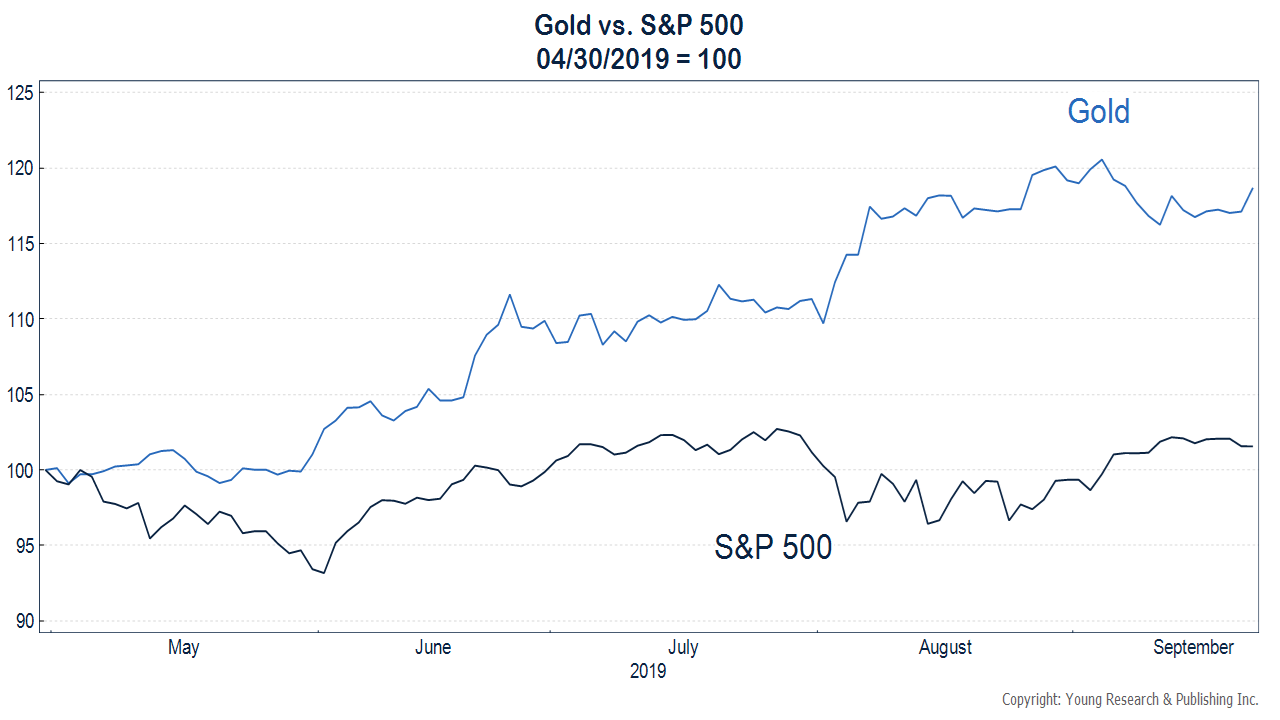
Heading into this downturn, your portfolio was positioned defensively. You owned a meaningful position in gold. Your fixed-income portfolio consisted of full-faith-and-credit-pledge Treasury securities and short-term investment-grade corporate bonds. And your largest common-stock-sector exposure was in healthcare and consumer staples. Firms such as Walmart, Kroger, Colgate, Procter & Gamble, Kimberly-Clark, Johnson & Johnson, Medtronic, and Merck. All beneficiaries of America’s newfound hoarding ways (toilet paper and otherwise).

With 20/20 hindsight, there may have been a better way to be positioned heading into a global pandemic. But lacking the luxury of an accurate crystal ball, once again a cash-flow–centric balanced portfolio muted volatility and helped to minimize losses.

America and the World Will Recover

“Abnormally good or abnormally bad conditions do not last forever.” ~ Ben Graham

“To be an investor you must be a believer in a better tomorrow.” ~ Ben Graham

While the COVID-19 pandemic is certainly disturbing on several levels and is unlike anything any of us has experienced, human ingenuity, resilience, and resolve point toward an eventual health, economic, and market recovery. Pandemics are new to you and me; but it is worth pointing out that there have been regional pandemics this century, and there was a major flu pandemic last century. Both eventually ended, and life went on pretty much as it had prior.

That’s not to say that things can’t get worse before they get better. We are hopeful that the nature of this downturn translates into a quick snapback. Still, we recognize that there is a great amount of uncertainty around the timing and magnitude of a recovery.

That uncertainty is partly or even largely responsible for the opportunity we now see in markets.

Shopping for Straw Hats in Winter

Where do we see opportunity today? Some investors see opportunity in what you might call COVID-19 bunker baskets. Netflix, Amazon, DocuSign, and Zoom are all popular stocks today. But unless you believe the pandemic is more than temporary (we do not), buying shares in these firms today is a lot like buying your straw hats in summer. We prefer to buy our straw hats in winter.

Companies that are out of favor and impacted most by the coronavirus are trading at levels we haven’t seen in years. Are these companies facing more business risk than an Amazon or Netflix today? Many are, but at today’s depressed prices, we believe the margin of safety is significant.

The concept of a margin of safety was popularized by Ben Graham. In The Intelligent Investor, Graham explained, “The danger in a growth-stock program lies precisely here. For such favored issues the market has a tendency to set prices that will not be adequately protected by a conservative projection of future earnings…. The margin of safety is always dependent on the price paid. It will be large at one price, small at some higher price, nonexistent at some still higher price.”

With the investment landscape shifting profoundly over the course of a couple of weeks, we have been more active over the last six weeks than we have been in years.

The bond market is where the bulk of our activity has been focused, but we’ve also been active in precious metals and common stocks.

In bonds, with the Federal Reserve quickly slashing interest rates to zero and buying tens of billions worth of Treasuries and mortgage-backed securities each and every day, we have liquidated all of our Treasury holdings to be used for higher-yielding and higher-returning opportunities.

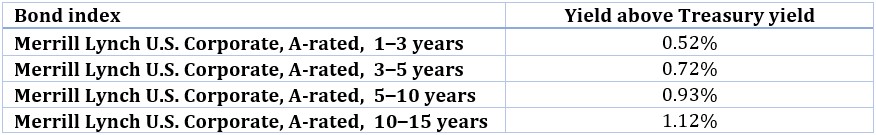
We’ve purchased corporate bonds at yields and spreads (yield advantage to Treasuries) that we haven’t seen in nearly a decade. Below is a list of some of the bond issues we purchased in many client accounts in recent weeks. You will note the maturity on some is much longer than we typically favor, but the yields and spreads were significant at the time of purchase. Higher yields and spreads drive down both the duration and the risk from a rise in Treasury rates. (Higher Treasury rates often coincide with narrowing spreads.)

  • Lowe’s: 4.05% | Due: May 2047 | Yield to maturity: ~4.7% | Rating: Baa1 / BBB+
    One of America’s largest home improvement retailers.
  • Weyerhaeuser: 4.0% | Due: April 2030 | Yield to maturity: ~3.85% | Rating: Baa2 / BBB
    Timber and timber products firm, and one of the largest private landowners in America.
  • Valero Energy: 3.40% | Due Sept. 2026 | Yield to maturity: ~6.25% | Rating: Baa2 / BBB
    One of the largest independent refining companies in the U.S.
  • FedEx: 4.40% | Due Jan. 2027 | Yield to maturity: ~5% | Rating: Baa2 / BBB
    One of the largest package delivery companies in the world.

In addition to purchasing corporate bonds, we have also been buying the Fidelity Floating Rate High Income Fund. We have owned this fund in the past. We favor the position during times of stress in the bond market, when yields are high and the margin of safety is elevated.

The Fidelity Floating Rate High Income Fund invests in bank loans issued by companies rated below investment grade. The loans float with short-term interest rates, so there is no interest rate risk.

The senior bank loans that the Fidelity Floating Rate High Income Fund invests in get paid before stockholders and bondholders in the event of default. The historical recovery rate (the percent of face value an investor typically gets when a company defaults) on bank loans has averaged 70%, which compares favorably to the 45% historical average recovery rate of high-yield bonds.

Our average purchase price was completed at an S.E.C. yield approaching 8%. At current prices, the Fidelity Floating Rate High Income Fund has an S.E.C. yield of 7.53%. At a 7.53% yield, 25% of the Fidelity Fund’s loans could default, and it would perform no worse than a T-bill (assuming the 70% historical recovery rate holds). The highest default rate in the data available for bank loans is 12%, which occurred during the 2008 financial crisis.

Cash Demand and Margin Calls Soared

After such a long period of calm in markets, the abrupt lock-down of the economy created some unorthodox moves in securities prices. With the demand for money soaring because of the lock-down, liquidations spiked, and so did margin calls. The selling was indiscriminate. Even Treasury bond prices went temporarily haywire, and so did precious metals.

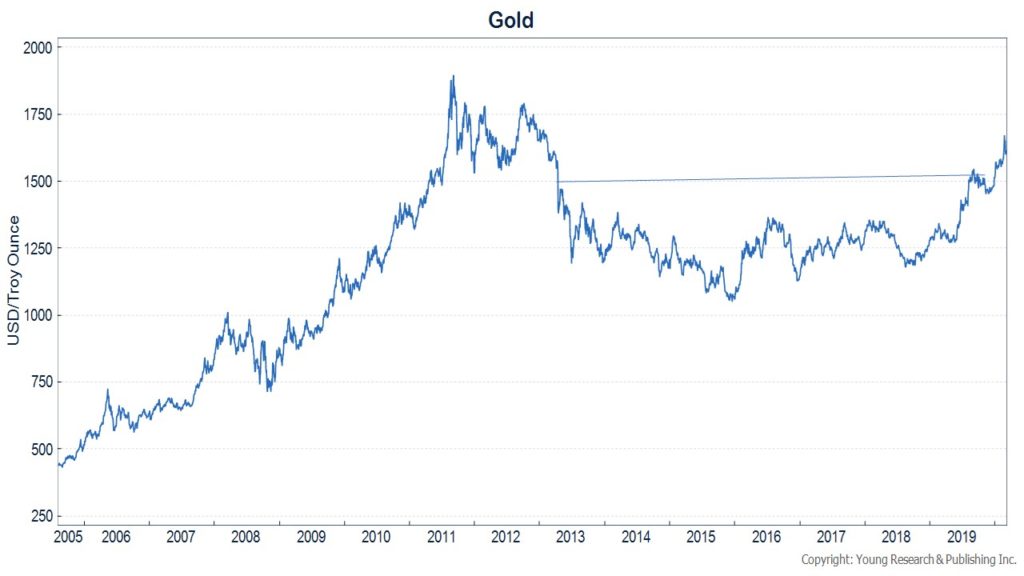
In mid-March, gold and silver prices started to fall with other risky assets. Seeing a potentially inflationary fiscal and monetary stimulus coming down the road, we felt gold and silver should have been rising in price.

On March 19, for most accounts we doubled your position in silver and increased your position in gold by 25%. As the liquidity panic subsided, gold and silver prices rallied. The chart below shows the price of both metals along with the date we bought more for you.

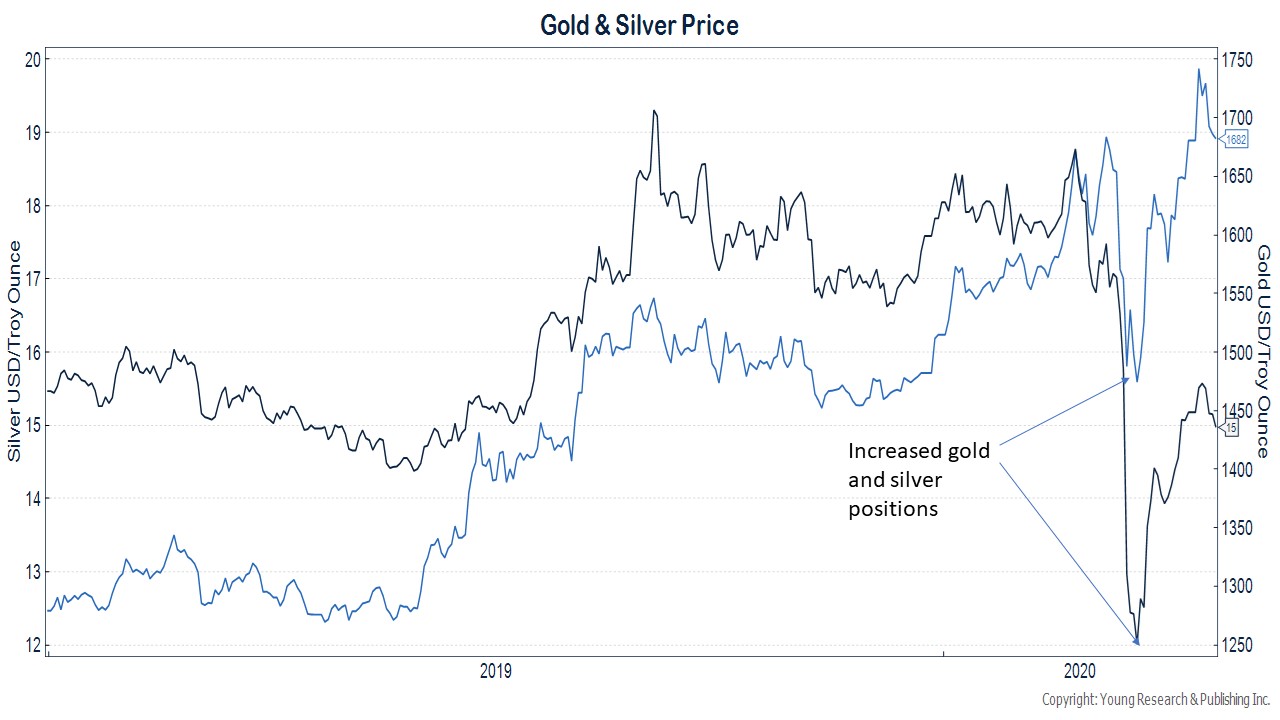
We weren’t trying to pick the bottom, but sometimes you just get lucky!

Precious metals are an area of the market we want to continue to hold. The amount of monetary and fiscal stimulus we see on a global scale is unlike anything since World War II.

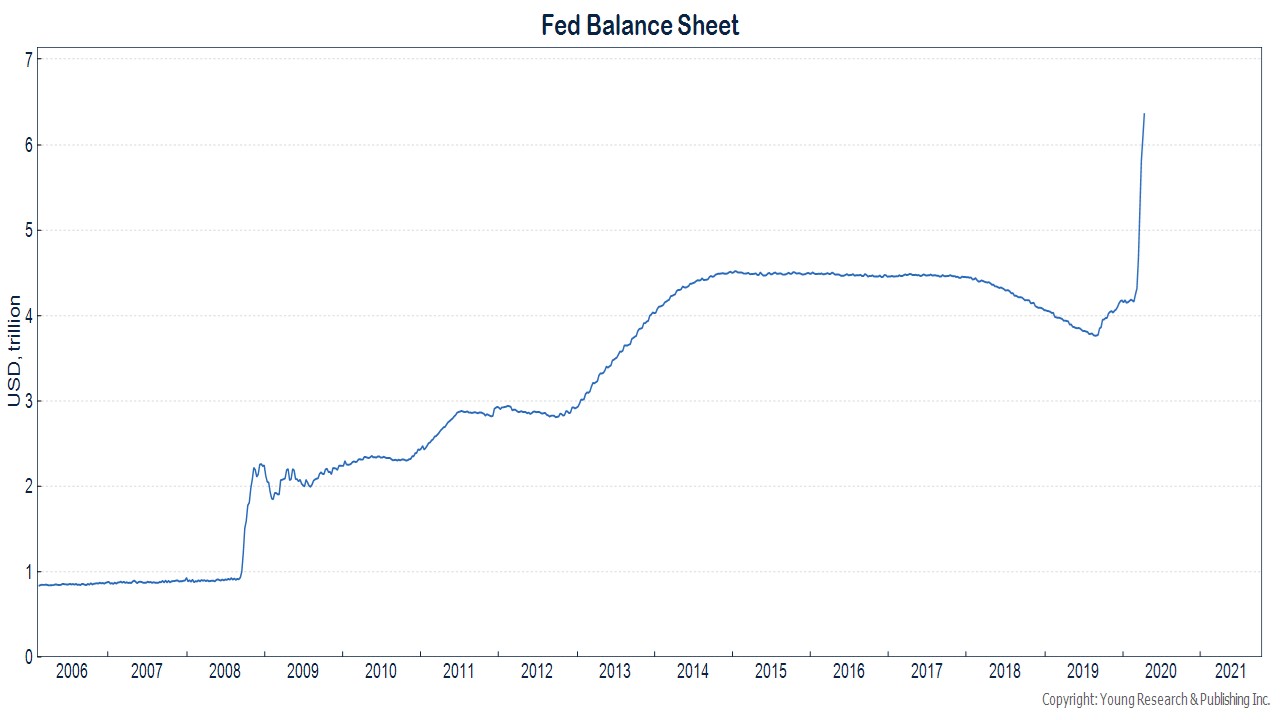
The U.S. is poised to run a budget deficit in excess of $3 trillion this year. Who will buy all of those Treasury bonds?

Cue Jerome Powell & Co.

Since the end of February, the Federal Reserve’s balance sheet has expanded by over $2 trillion, and the Fed is far from finished.

Maybe this all works out, and the inflation that will surely be created remains contained in financial markets as it did during the last decade. But if it doesn’t, your gold and silver will shine even brighter.

Common Stock Opportunities

In our Retirement Compounders portfolios, we initiated positions in a number of securities. For many clients, we started a position in McDonald’s, Starbucks, Texas Roadhouse, Polaris Industries, Rockwell Automation, Equity Residential, Chevron, and Valero, among a few others.

Chevron

We purchased Chevron shares at a yield of 7.85%. Twenty-dollar oil prices have savaged the oil industry, but we think the majors (Chevron, Exxon, BP, Royal Dutch Shell, etc.) have the balance sheet, diversification, and savvy to come out stronger than they went in. Chevron and the other major integrated oil firms have prioritized their dividends. We believe Chevron’s dividend is safe for the next 12 months, even if oil prices stay at these depressed prices. If today’s prices are sustained much longer, the supply of oil will likely decline sharply.

When demand returns, be it next quarter or next year, the supply-demand balance will likely be much tighter, leading to higher prices. The best cure for low oil prices is still low oil prices. At an almost 8% dividend yield, we believe the margin of safety in Chevron shares is substantial.

Polaris Industries

Polaris is a firm we owned many years ago. Polaris manufactures ATV’s, motorcycles, boats, and snowmobiles. At its low, the stock was down over 60% from its year-end 2019 level. Polaris will likely have a difficult year, maybe two, but we anticipate an eventual recovery in sales and profits to prior highs. We purchased the stock at 7.3X past-peak earnings and a dividend yield of almost 5%. Over the last decade, Polaris has traded at an average price-to-earnings ratio of 18X. We feel good about the margin of safety in the shares.

Over the coming months, I will have more to say about some of the other stocks we’ve added to portfolios in recent weeks; but I do want to mention that with a few of the firms we own, we have either seen or may see dividend holidays.

What is a dividend holiday? We consider a dividend holiday a temporary suspension of quarterly dividend payments. Texas Roadhouse and Cracker Barrel, which are both sit-down restaurants, have instituted dividend holidays. For obvious reasons, both firms have announced they would suspend dividend payments to conserve cash and allow time for the impact of the virus and lock-downs to be assessed. We view this as a prudent move on the part of both management teams. Being forced to close every single restaurant you operate—with no date certain on when you can reopen—demands caution.

The ugly reality is that the economy has ground to a halt. You can’t blame management teams for wanting to stay liquid in this environment. And rather than avoiding the shares of firms that may institute dividend holidays, we are proceeding at a measured and deliberate pace, and buying at prices we believe offer a significant margin of safety.

Have a good month. As always, please call us at (888) 456-5444 if your financial situation has changed or you have questions about your investment portfolio.

Warm regards,


Matthew A. Young
President and Chief Executive Officer

P.S. In addition to taking advantage of opportunities during the market volatility, we have also used the volatility to lower your potential tax bill. We have been harvesting losses where we feel it makes sense. By example, we recently harvested some losses in energy stocks as well as in shares of Lowe’s, which we swapped for Home Depot. We like both firms, and both provide exposure to similar economic trends.

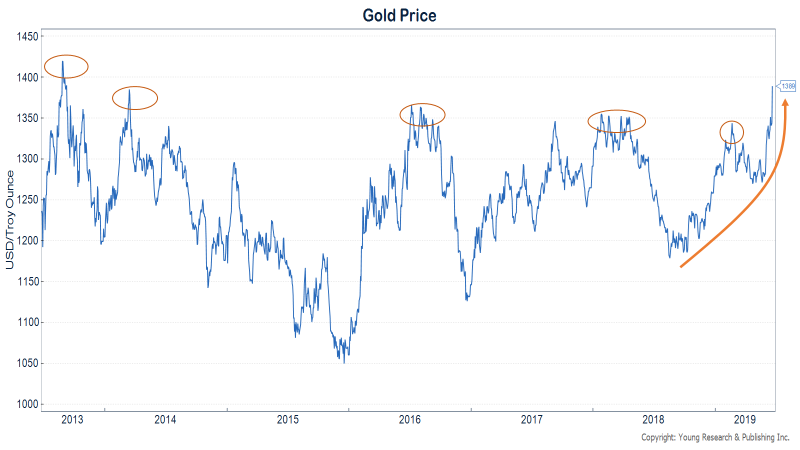
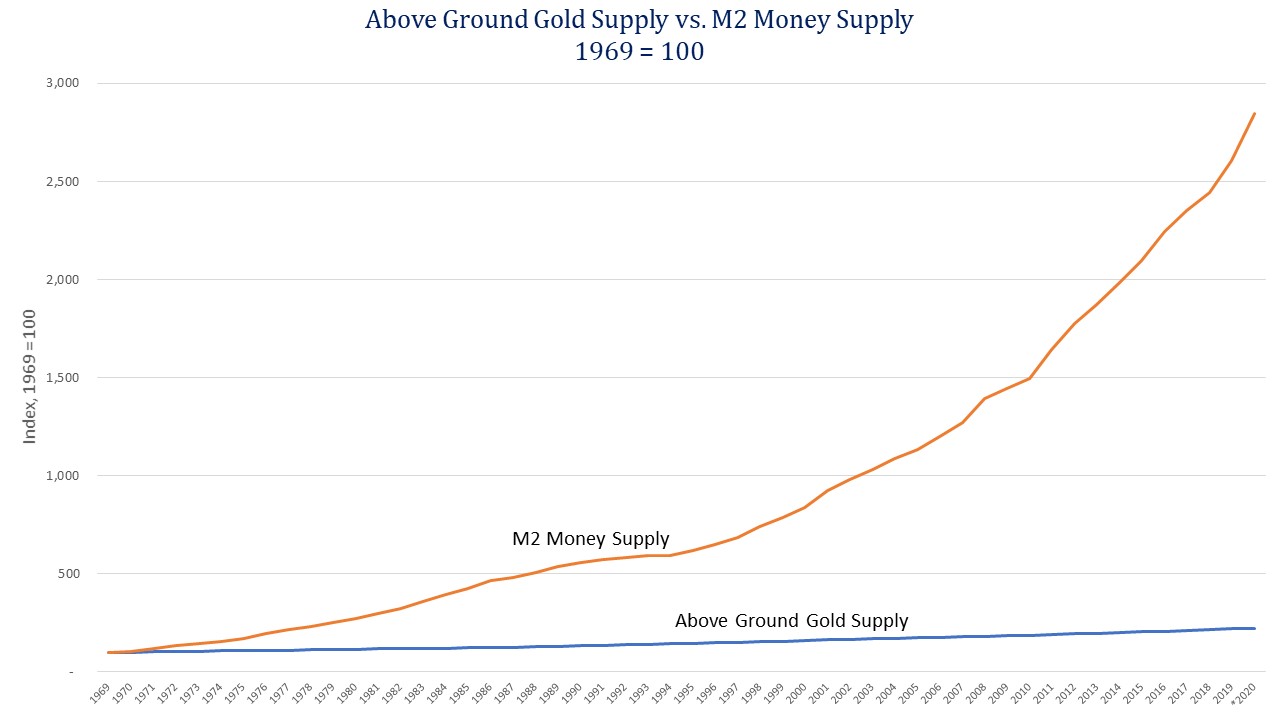
P.P.S. Did you know that over the last five decades, the above-ground supply of gold has compounded at about 1.6% per year? Over the same period, the monetary base has compounded at 8.1%, with growth since the last financial crisis averaging nearly 14% per year. M2, a broader measure of money supply, has compounded at 6.75% since 1969 and 6.2% since the last financial crisis began. A visualization may help. Looks like a bullish signal for gold prices over the long run.

P.P.P.S. We recently updated both Part 2A and Part 2B of our annual SEC Form ADV. This document provides information about the qualifications and business practices of Richard C. Young & Co., Ltd. If you would like a free copy of the updated document, please contact us at (401) 849-2137 or email cstack@younginvestments.com. As you were notified in October 2019, since Part 2A of Form ADV was last issued on March 18, 2019, Richard C. Young & Co., Ltd. has added a new investment management program and updated the descriptions for its existing investment management programs. Each updated description includes an increase in the asset allocation range, allowing for greater equity exposure.


Investing With Comfort During Retirement

February 2020 Client Letter

A recurring theme surfaced as I was counseling several clients last week: how to maintain a consistent level of comfort with their money during retirement. If you are in or approaching retirement, you are keenly aware that the gig is up in terms of future earning potential. What you have earned and saved must last, potentially for several decades.

Several decades is a long time in retirement. By example, think of the number of news cycles, headlines, and presidential elections you will have to endure. Those without an investment plan and discipline could become susceptible to emotionally charged investment decisions. As Benjamin Graham wrote, “The investor’s chief problem—and even his worst enemy—is likely to be himself.”

Graham is considered one of the greatest investors ever and was well known as a finance professor at Columbia, author of several books including The Intelligent Investor, and a mentor to Sir John Templeton and Warren Buffett.

Less commonly known are the broad areas of knowledge Graham possessed. He was a Greek scholar and, before entering Wall Street, he was offered teaching positions in the subjects of English, mathematics, and philosophy.

Graham was also a student of psychology and appeared to be ahead of his time with regard to behavioral economics. In The Intelligent Investor, Graham cautions investors on the differences between investing and speculating. Right out of the gate in Chapter 1, he writes, “In most periods the investor must recognize the existence of a speculative factor in his common stock holdings. It is his task to keep this component within minor limits, and to be prepared financially and psychologically for adverse results that may be of short or long duration.”

At Richard C. Young & Co., Ltd., our goal is to help you maintain a degree of psychological and emotional comfort during your retirement years. One way we try to achieve this is to develop portfolios that attempt to limit volatility when markets take steep declines.

Gold has historically done a decent job of rising in price when other asset prices drop. We saw an example of this on February 24 when stocks tumbled on fears of an escalation of the spread of COVID-19 (aka coronavirus). As the Dow dropped nearly 900 points one day, the value of GLD climbed 1.8%.

Gold Is Off to the Races

Gold is off to another solid start in 2020 (+8%) after rising more than 18% in 2019. Headlines of rising geopolitical tensions, plunging interest rates, and the coronavirus have been driving the price of gold this year. The bullish price action has some analysts projecting gold will make a new all-time high sometime in 2020. While we aren’t in the business of projecting where the price of gold will be this week, this month, or this year, we do agree that gold’s chart looks encouraging.

Gold broke out of a more than seven-year trading range, as indicated on the chart, and the price has continued to sail through resistance levels.

Helping to fuel the gold rally is continued buying by central banks. Central banks purchased over 650 metric tons of gold in 2018 and 2019. For all the ridicule gold gets from mainstream economists, it is interesting that the institutions charged with maintaining the value of the world’s paper currencies are buyers of gold.

A Major Indicator Sending a Concerning Signal

Any time the price of gold is rising, investors should perk up and be on the lookout for seen and unforeseen risks. That is doubly true when government bond yields are plunging. For the first six weeks of 2020, gold prices were rising,Treasury yields were falling, and the dollar was strengthening.

If you gave me just those three facts, I would have told you that the stock market was probably falling; but, in fact, the opposite was true up until a few days ago. And underneath the performance of the headline indices were speculative rallies reminiscent of the dotcom era. As one example, shares of Virgin Galactic, a firm that hopes to commercialize space travel, had a YTD gain of 223% at its high. The company’s market value reached over $8 billion. Revenues for all of 2019 were $3.7 million.

Quality Being Eschewed

There are, of course, always areas of speculation in the stock market, but the speculative feeling today seems to be pervasive across most sectors and most asset classes. Likely contributing to the fearlessness of investors in 2020 is the rear-view mirror. The 2010s were kind to U.S. stock market investors. There wasn’t a single bear-market (down 20% from peak to trough) in the U.S., and stocks compounded at double-digit rates.

The Big Driver of Stock Returns in the 2010s

The problem with the strong gains in the 2010s was that the biggest driver of those returns may have been the distortive monetary policy pursued by the world’s biggest central banks. When the price of money is held at zero (negative in some countries) for nearly a decade into an economic expansion and the balance sheets of the big three central banks balloon almost fourfold (from 2008), distortion is almost inevitable.

Distortion in Markets is Pervasive

The distortion has manifested itself across all asset markets and in corporate behavior, where cheap debt has been used to finance stock buybacks.

In a recent interview with Barron’s, economist David Rosenberg explained the unique drivers of stock prices during this bull market. (Emphasis is mine.)

Well, what has made this cycle unique is that the correlation between gross-domestic-product growth and the direction of the S&P 500 index has only been 7%. Historically, it has been 30% to 70%. The stock market is telling you nothing about the economy anymore. Economic fundamentals have never mattered as little for the stock market as has been the case during this 11-year bull market. The stock market is behaving more like a commodity than anything else, in that it’s trading on simple supply and demand.

Barron’s asked: Why has that relationship broken down?

“It’s perfect symmetry. We have had $4 trillion of quantitative easing matched perfectly by $4 trillion of corporate share buybacks, to the point where the share count of the S&P 500 is down to its lowest point in two decades. You would normally believe that a powerful bull market in equities would have been reliant on a strong economic backdrop. But that’s far from the case. We have never before seen such a stock-market performance in the face of what has been in the last 11 years the weakest economic expansion of all time. We haven’t even had one year of 3% or better real GDP growth in the U.S. since 2005.

Investors who have captured the full gain in U.S. stocks over the last 10 years may have 1) an extremely high-risk tolerance, 2) a poorly diversified portfolio, or 3) a serious affinity for speculation.

Why speculation?

Based on our internal estimates, about 40% of the return on stocks in the 2010s was driven by investors’ willingness to pay an ever-increasing price for the same stream of earnings. And that 40% doesn’t take into account that earnings per share were boosted by debt-financed buybacks and lower interest expense from the Fed’s ultra-low interest rate policy. Both factors show up in higher earnings per share growth (normally a fundamental driver of stock prices) but have little to do with company fundamentals.

Realized Returns Out of Step with Fundamentals

The table below compares the compounded annual return of the S&P 500 each decade with an internal measure we use to gauge long-term total returns. Our gauge does a decent job of getting within a percentage point or two of the realized return for each decade, with two notable exceptions: the 1990s and the 2010s.

In both periods, the returns realized for the decade were significantly higher than our gauge signaled at the start of the decade. In the 1990s, the dotcom bubble drove the market far above fundamental value. In the 2010s, it was a prolonged period of ultra-loose money that drove returns much higher than would be expected based on company fundamentals.

In the decade after the dotcom bust, the giveback was wicked. The S&P 500 lost money over a 10-year period, with two nasty bear markets that cut the index in half on both occasions.

What Will the 2020s Bring for Stocks?

After a decade of distortion in the 2010s that drove returns far above levels indicated by underlying fundamentals, will the 2020s be a repeat of the 2000s, with a similarly dismal outcome for investors?

While it is possible this time is different, if you are retired or on the verge of retirement, the prudent thing to do is to prepare for lower returns and the prospect of another major downturn within the next decade.

How Do You Prepare for the Prospect of Another Stock Market Debacle?

No retired or soon-to-be-retired investor wants to get whacked with the 50% haircut right out of the gate that would come with an all-stock portfolio. Remember, you need a 100% gain to recover from a 50% loss.

To prepare for a decade of potentially below-average stock market returns, we favor balance and dividends. Bonds, even at today’s low yields, provide ballast in a bear market. In the decade of the 2000s, when stocks lost about 1% per year, the Vanguard Balanced Index earned an annual average return of 2.64%—not great, but it was up enough to maintain purchasing power.

A better approach in the 2000s would have been to favor dividend-paying stocks on the equity side of the portfolio. Long dry spells occur for stock prices. Our favored solution to dry spells is to craft a portfolio of stocks that pay relatively high dividends today and offer the potential for dividend increases tomorrow.

Stocks such as IBM, with a 4.6% dividend yield, are the type of firms we favor for the potentially lower return environment ahead. IBM has paid a dividend every year since 1916. How many tech firms have been around since 1916? IBM has also increased its dividend for 23 consecutive years. Over the last five years, the dividend has risen at an 8% compounded annual rate. IBM may not be as sexy a company as Virgin Galactic, trading at 1,650X sales, but buying IBM at 10.5X earnings (not sales) provides a slightly larger margin of safety.

The Bottom Line

The bottom line is that a portfolio of blue-chip dividend-payers, gold, and high-quality bonds can be a way for investors to have confidence in their portfolio, even during periods of uncertainty or volatility. Having confidence and a solid understanding of what you own and what your investment strategy is may help you avoid making financial decisions that disrupt your long-term investment success.

Have a good month. As always, please call us at (888) 456-5444 if your financial situation has changed or you have questions about your investment portfolio.

Warm regards,


Matthew A. Young
President and Chief Executive Officer

P.S. Lowe’s is the second-largest home improvement retailer in the U.S. Lowe’s offers a complete line of products and services for decorating, maintenance, repair, and remodeling. The company’s reported financial results for the fourth quarter came in below analysts’ expectations, and the shares were predictably sold down. The fundamentals of the business remain solid, in our view. Lowe’s shares yield 1.94% today, and over the last five years the company has increased its dividend at a 19.6% compounded annual rate. Over the next five years, we would not be surprised if the dividend doubled.

P.P.S. This month you may have read that Larry Fink, CEO of BlackRock, the world’s largest asset manager, announced the company would be turning its back on investments in oil and gas for environmental concerns. While Fink may mean well, the industry is still a necessary part of the world’s energy portfolio. BlackRock isn’t the only company making the decision to jettison investments in oil and gas. The downward pressure from news of those defections and recent events surrounding the coronavirus outbreak, has beaten up oil and gas stocks which now make up less than five percent of the market cap of the S&P 500. That’s the lowest level since 1990. Despite being in a rough patch, however, energy demand is not going away.

Energy companies, especially big integrated ones, have much to offer prudent investors today. For starters, their yields are historically high, and many of the integrated energy companies have records of regularly increasing their dividends. Despite the ongoing push toward more solar and wind in the world’s energy portfolio, they aren’t replacing oil and gas any time soon.


Three Decades of Helping Investors Like You

January 2020 Client Letter

Last year completed our 30th year providing investment counsel to investors like you who are retired or saving for retirement. As many of you are aware, the foundation of our investment strategy was formed by my dad during decades of researching and writing financial newsletters. His most widely circulated letter, The Intelligence Report, focused investors on the benefits of diversification, patience, and compound interest. He would often cite the knowledge he gained from Benjamin Graham, Wellington Management Company out of Boston, MA, and Jack Bogle.

The Intelligence Report encouraged readers to adopt an investment strategy focused on one’s own personal objectives and risk tolerance, not recent performance figures. IR also looked to simplify the investment process and concentrated on time-tested basics. Here are five of those strategies we use at Richard C. Young & Co., Ltd. to help investors achieve their long-term investment goals.

Your Money is Always Working

One of the easiest and most powerful investment strategies is harnessing the positive effects of compound interest. The compounding of money can significantly increase portfolio value. Compounding is done through the reinvestment of dividends. Our equity strategy emphasizes dividend-paying securities, allowing for the compounding process to take effect each year. Compounding can allow for portfolio growth even when stock market returns are modest.

You Receive Annual Pay Raises

We invest in blue-chip stocks with a history of paying dividends. A focus on quality companies paying out cold, hard cash each year is comforting for those relying on their portfolio for cash flow. But annual dividends are not the whole story. We also target companies that raise their dividend each year. Annual dividend increases are critical in helping offset the nasty effects of inflation—one of the most significant risks retired investors face.

Predictability in an Uncertain World

We all face the uncertainty of wondering whether markets will go up or down. A company with a long track record of annual dividend payments offers no guarantees. But these companies prefer to keep their streak intact. Many investors take comfort knowing it is likely they will receive dividend income year after year.

Lower Volatility Can Lower Anxiety

In most portfolios, we include a high-quality bond component, which helps reduce volatility. Yes, yields are low today. But many investors like to incorporate the concept of return of principal more than a return on principal. Bonds, falling under the category of return of principal, can lower volatility and help you sleep at night, knowing your entire portfolio is not linked to equity markets.

Comfort from 30 Years of Consistency

While our strategy has evolved, our basic investment tenets have remained constant—diversification, patience, and compound interest. It can be frustrating to invest in a fund, insurance product, or annuity that you do not understand. Most individuals intuitively understand the benefits of diversification, the need for patience, and how dividends provide the fuel for compound interest to work. Implementing these concepts can give you confidence that your hard-earned savings are positioned well for decades to come.

Today’s Economic Environment Looks Good

The U.S. economy has been humming along. The unemployment rate recently hit a 50-year low, and underemployment (considered a better measure of labor conditions by some economists) is the lowest on record. Anybody who wants a job in the U.S. should be able to find a job today.

Alongside low unemployment, wages are increasing at the fastest rate this century. In 2019, median hourly wages increased by an impressive 5.5%.

With such a strong labor market, it’s no surprise that in December 2019 retail sales reached their highest value ever at $464.5 billion.

Services Sector Still Strong

The Institute of Supply Management’s (ISM) Non-Manufacturing Index has been holding steady above 50, indicating continued growth in the services sector of the economy. In the most recent survey of services companies by ISM, respondents reported shortages of workers for construction for the 45th month in a row and a shortage of temporary labor for the 6th consecutive month. The number of Americans working in construction is the highest it has been since October of 2007 and is only 175,000 workers away from its peak of April 2006.

The services side of the economy has become much more important over time. There are now over 108 million Americans working service jobs.

Trade Tensions Cooling

Investors have also taken comfort in what appears to be a cooling off in tensions between China and the United States. On January 15, President Trump and Chinese Vice-Premier Liu signed the first phase of a trade deal that aims to reduce tariffs and barriers created during the trade war and to address previous trade-related concerns.

Election Cycle Tailwind

In addition to a solid economic picture, stocks have the election cycle at their back. Historically, stocks do best in the third year of the election cycle, but election years also tend to be positive for the market. As I pointed out last month, during the previous 17 election years the stock market has only fallen twice.

The Good Environment Doesn’t Mean There Aren’t Risks

Despite all the good news, some areas could be troublesome. Corporate earnings growth for 2019 is likely to come in around 1% or less. Not exactly the standard of a roaring economy. Without a recovery in earnings, stock prices may come under pressure.

Another risk to the market is continued softness in the manufacturing sector. As best we can tell today, the weakness in the manufacturing sector has a lot to do with Boeing’s 737 Max problems and trade policy uncertainty, but it would be a mistake to ignore the weakness. The manufacturing sector has historically been a good barometer of broader economic conditions. If manufacturing conditions don’t improve, other sectors of the economy may start to weaken.

Fed Encouraging a Bubble-Bust Cycle

A weak manufacturing sector and trade policy uncertainty are two of the reasons the Federal Reserve has maintained a very accommodative monetary policy. While pumping liquidity into the financial system is often beneficial to stock market investors, it can distort markets and mislead investors.

Federal Reserve Bank of Dallas President Robert Kaplan recently commented on the market’s perception of the Fed’s liquidity purchases and the effects of that perception: “Many market participants believe that growth in the Fed balance sheet is supportive of higher valuations and risk assets.” He continued, “I’m sympathetic to that concern” and “I think it’s wise to acknowledge it and be cognizant of that concern as we think about our next actions.”

With the valuation on some stocks in the market at nose-bleed levels, merely turning off the money printing press could be all that is needed to cause a correction.

A Flash Point in the Middle East?

Another potential flash-point for financial markets is the Middle East. The recent exchange of hostility between the United States and Iran was taken in stride by investors; but a more severe outbreak of hostilities in the Persian Gulf region could impact the global price for oil, driving up costs for nearly all other activities.

ETFs Not as Diversified as Some Believe

The problem facing investors then is how to minimize their investment portfolio’s exposure to these risks. The first answer is diversification. For some, that might mean buying index funds; but, as we saw during the dot-com bust, index funds and ETFs tend to become concentrated in a limited number of pricier stocks.

Broad diversification simply doesn’t exist in most index funds. Among the eleven sector ETFs representing the S&P 500 sectors, three contain just two stocks that make up nearly 40% of the index’s market capitalization.

Even the broader-based S&P 500 ETFs lack the diversification we favor. Five holdings, Apple, Microsoft, Google, Amazon, and Facebook, represent 18% of every fund and ETF tracking the S&P. That’s higher than at any time on record, including during the tech bubble. Do you want almost 20% of your portfolio in a group of stocks offering an average dividend yield of only 0.44%?

How We Diversify for You

At Richard C. Young & Co., Ltd., we spread risk across industry sectors and individual holdings. Portfolios are built with a global view and a focus on dividends, dividend growth, stability, and staying power.

We also advise a healthy bond position for almost all investors. Bonds not only provide a steady stream of income, but they also tend to rise when stock prices fall. Our bond strategy eschews bond funds and ETFs where possible and instead favors individual bonds to mitigate the performance drag from spreads and fees.

Another component of the diversification efforts in most portfolios we manage is an investment in precious metals. We buy precious metals not with the idea that their value will soar, but to counterbalance risk. When precious metals, especially gold, rise in value, other types of securities are often losing value. Gold is an insurance plan for the unpredictable.

In fact, in response to the recent flare-up of tensions with Iran, gold rallied. Gold is now trading at over $1,550 an ounce. That’s around $100 an ounce more than just two months ago, and nearly $300 an ounce more than eight months ago. Gold tends to bounce during periods of unrest as investors move into safe-haven assets.

Have a good month. As always, please call us at (888) 456-5444 if your financial situation has changed or you have questions about your investment portfolio.

Warm regards,

Matthew A. Young
President and Chief Executive Officer

P.S. On December 20, 2019, President Trump signed the Secure Act. Much of the new law’s focus was on retirement plans, including a mixture of good and bad provisions. One provision that may affect many of our clients is the change to rules regarding required minimum distributions. Morningstar explains the new rules:

For any individual born after June 30, 1949, the required beginning date [of required minimum distributions] is April 1 of the year after the year in which such individual reaches age 72 (or, in the case of certain plans, if he or she is still working, after the year in which he or she retires if later). Previously, the trigger age was 70½. As a result of this change, no IRA owner will have a required beginning date in 2021.

One of the unfavorable provisions in the law is the elimination of the stretch IRA, which could force heirs of IRAs to pay significant upfront tax bills on their inheritance, rather than stretch those obligations out over time.

P.P.S. Donald Trump may not be your favorite individual. But for many workers and investors, the Trump administration has not produced the terrible results some expected. Writing for the National Review, Victor Davis Hanson explains:

• Paul Krugman: The Nobel Prize winner insisted that Mr. Trump not only would crash the stock market but also suggested that stocks might never recover.
• Larry Summers: The former treasury secretary envisioned a recession within a year-and-a-half [sic], thanks to Mr. Trump’s being elected.
• Steven Rattner: The former head of the National Economic Council predicted a market crash of “historic proportions.”
Yet, three years later, in terms of the stock market, unemployment, energy production, and workers’ wages, the economy has done superbly.

P.P.P.S. As I mentioned earlier, the Federal Reserve has been injecting liquidity into the financial system by printing money to buy T-bills, thereby expanding the size of its balance sheet. Over the last three months, the Fed has undone more than half of the entire balance sheet unwinding that began in 2017. Powell & Co. insist the balance sheet expansion is not quantitative easing (QE) but is instead a remedy for problems in overnight lending markets.

By the time quantitative and non-quantitative easing ends, the Fed’s balance sheet is likely to be back near a record. What was once supposed to be an emergency measure to stem losses during the financial crisis has become standard operating procedure at the Fed.

Central bank intervention in markets has been going on for so long now, many have become numb to it, but there is nothing ordinary about regularly distorting markets on a massive scale.

The payback is likely to be ugly when it comes; the sharp correction in stocks in the 4th quarter of 2018—the first time global central-bank balance sheets shrank since the QE expansion began—may foreshadow what lies ahead. Trying to time such an event is never a useful exercise, but adequately preparing your portfolio to weather a bust is indeed useful.


How Will Stocks Do in 2020?

December 2019 Client Letter

They will probably rise. Our forecast (it’s a guess really) is favorable not only because stocks rise in seven out of every ten years, but also because election years have historically been good for stocks.

Since 1952 the average election year performance of the S&P 500  (the 12 months from the first week of November in the preceding year to the first week of November in the election year) has been 8.2%.

Stocks Batting Almost .900 in Election Years since 1952

The only two election years in the 17 since 1952 when the S&P 500 fell were from November 1959 to November 1960 and from November 2007 to November 2008. That’s almost a .900 batting average.

Frequency isn’t everything, though. Magnitude matters as well. What do the magnitudes of the losses look like in election years?

In 1960, the S&P 500 fell a little over 4%; but if you add dividends back, the loss was under 1%.  The 2008 decline was a butchering. The S&P 500 cratered 37% as the financial sector imploded.

Could 2020 be another big down year like 2008? Indeed it could be, but here is a nugget that may put you at ease. On the two occasions when the stock market fell in an election year, there wasn’t an incumbent running. Eisenhower in 1960 and Bush in 2008 were both finishing their second terms in office. Opposition party candidates replaced both—Kennedy in 1960 and Obama in 2008. Trump is in his first term and, as things stand today, his prospects look good.

A Positive Outlook for 2020

So there you have it. Stocks are guaranteed winners in 2020! I am, of course, not being serious. There is clearly some data mining in my later point.

Without making any guarantees, it is our view that stocks will likely be up in 2020.

Economy Still OK

In addition to the tailwind from the election cycle, the economy still appears to be in decent shape. The jobs market continues to boom with unemployment at multi-decade lows, consumer spending is strong, and the Trump tax-reform package has helped the competitiveness of the U.S.

Negative Headlines a Nightmare for Long-Term Investors

Negative headlines can be an investor’s worst nightmare, as they can trigger imprudent emotionally-charged investment decisions. We weren’t on board with the recession focus in 2019, and our view today is that there is no recession yet, but the margin of safety has narrowed.

As my dad recently wrote: 

Conditions are still generally good with 3rd-quarter GDP growth having been revised up to 2.1% from 1.9% which comes despite a nasty 40-day GM strike and Boeing’s 737 MAX airliner debacle.

It would be helpful if the sensitive leading and coincident indicators (see chart below) still had the oomph of the early months of the long, long economic recovery; but given the length of the recovery, mismanaged Fed policy, and the headwinds noted earlier, no can do.

Remember, months of revision will follow. The cards we are initially dealt are never the ones played once revisions are complete.

No Recession Yet, Margin of Safety Slim

OK, no recession yet, but not much margin of safety either. I’ve been analyzing these things each month since early 1971. The best way to explain how I view the leaders and coincidents at year-end 2019 is, well, uncomfortable.

Two consecutive fully revised negative quarters for the coincidents will signal official recession (once the NBER concurs). The same progression applies to the leading economic indicators.

There has now been one pre-revision down quarter reported for the leaders, but none yet for the coincidents. The most recent monthly coincidents report was a zero for the coincidents. Although no big deal this early in the game, zero makes me uncomfortable matched with a negative quarter for the leaders.

It will most probably be eight months before the Fed, NBER, or an honest media could use the word recession.

What If We Are Wrong?

There’s always a chance the markets and the economy won’t play out exactly as we anticipate. In fact, that is our expectation. Proper portfolio management shouldn’t stake much on an unknowable outcome. That’s what differentiates our approach from that of many of the “financial advisors” at the big-brokerage firms.

Despite our positive outlook for 2020, we aren’t writing about an overweight of stocks or an underweight of bonds or an equal weight of cash, or whatever other jive is being pitched to big-brokerage firm clients. 

Your Time Horizon is a Decade or More

The fact is we aren’t managing your portfolio for the next 12 months. We are managing your portfolio for at least the next decade or two. Consider that men who are 75 years old today have a 30% chance of living another 18 years. If you and your spouse are both 75 today, there is a 30% chance that at least one of you will live to 97.

Temporarily boosting your allocation to the stock market 5 or 10 percentage points for 2020 is unlikely to make a lick of difference to your total return over the coming decade.

What is likely to matter for returns over the coming decade are today’s elevated stock market valuations. High valuations today imply lower prospective stock market returns. Based on current valuation levels, we would be shocked if stock returns over the next decade are anywhere near what they generated over the last decade.

Stock Market Strategy Focused on Quality, Dividends, and Dividend Increases

Among other factors, frothy market valuations are why our stock market strategy for the current environment remains focused on quality, dividends, and annual dividend increases.

Stock’s such as Procter & Gamble tell the story of our investment strategy.

Procter & Gamble

Procter & Gamble has paid a dividend since 1891. P&G has also increased its dividend every single year for 65 years. P&G is tied for first place with American States Water for most consecutive annual dividend increases.

What Is the Key to P&G’s More Than Six-Decade Record of Dividend Success?

In addition to operating in an industry unlikely to face big cyclical swings, P&G’s marketing and innovation have helped the firm achieve long-term dividend success.

After employee salaries and material costs, Procter & Gamble’s third-largest cost is advertising. Some financial analysts view advertising as an expense, but advertising done right can create enduring brand value as it has at Procter & Gamble.

Procter & Gamble Business Overview

P&G has operations in some 70 countries worldwide and markets its products in more than 180. It is the world’s largest maker of consumer goods for home and health. P&G breaks its business down into five segments: fabric and home care (33%); baby, feminine and family care (27%); beauty (19%), health (12%), and grooming (9%).

Procter & Gamble’s portfolio of consumer brands is unmatched in the industry.  P&G has about 65 brands in 10 different categories within the five segments listed above. P&G’s brands include Pampers, Always, Bounty, Tide, Gain, Pantene, Gillette, Crest, and NyQuil, among others. 

Building Durable Brands Not as Easy as It Used To Be

For many years, establishing brand value by outspending the competition was a sure path to success, but industry dynamics are changing. The Internet and social media platforms have lowered the barriers to mass marketing. Almost any firm can now get in front of consumers to explain why they offer the best shampoo or detergent.

Procter & Gamble and other consumer-branded companies still have an edge as they have the scale and ad budgets that can crush almost any startup. But it’s now more important than ever for the product to live up to the claims made in advertisements, or consumers will look elsewhere.

Most firms in the consumer-packaged goods industry have been impacted by these shifting industry dynamics, but not all have identified a strategy to stay on top.

Procter & Gamble believes it can maintain market leadership by truly creating value for consumers. P&G wants to be the preferred choice for consumers by offering superior products. That includes having the best product, the best packaging, the best advertising, the best retail strategy, and the best customer value.

Procter & Gamble’s Dividend Growth through the Decades

The table below shows the compounded annual dividend growth of P&G’s dividend by decade.

Bonds Still a Must-Own Asset Class

One of the benefits of investing in companies that pay reliable dividends is that even in a market with subdued broader prospective returns, a stream of rising dividends is still likely to result in positive returns for investors.

In addition to favoring dividend-paying stocks, we also insist on a bond allocation for most clients. In a bear market or recession, bonds can provide a powerful counterweight to falling stock prices.

Bond returns far exceeded our expectations in 2019 as both short- and long-term interest rates fell. If interest rates were to reverse course and rise significantly, bonds would likely give up some of their 2019 gains. Still, at least in the short-term maturities where most of our bond portfolios are positioned, we don’t anticipate an increase in 2020.

After cutting interest rates three times in 2019, the Fed’s current view (which should be taken with a grain of salt) is that short-term interest rates will not be increased until measured inflation at least meets their 2% target and stays there.

As for longer-term rates, we can envision a couple of scenarios where long-term interest rates would rise meaningfully over the medium term. I will expand on those scenarios and risks in future letters.

The big challenge we see for bond investors in 2020 is finding worthy choices to replace some maturing higher coupon bonds with bonds that offer decent yield and modest risk.

The only upshot I have to offer you is that it could be worse. While rates are low here in the U.S., at least, we are not facing the negative yields that exist in other parts of the world.

Have a good month. As always, please call us at (888) 456-5444 if your financial situation has changed or you have questions about your investment portfolio.

Warm regards,

Matthew A. Young
President and Chief Executive Officer

P.S. The world is aging. According to the World Health Organization, the percentage of the world’s population aged 60 and over will nearly double between 2015 and 2050. And, in 2050, “80% of all older people will live in low- and middle-income countries.” Meanwhile, in OECD countries, the population of people over 65 years old will grow from 17% in 2015 to 28% by 2050. One of the hardest-hit countries will be China, where years of the “one-child policy” have created an inverted population pyramid that will leave many older Chinese for each younger one. Despite the demographic challenges many countries will face, there is good in this news because it means people are living longer. Lifespans in both the developed world and the emerging world are improving, and with that comes a higher proportion of older people. One reason that lifespans are lengthening is improved health care and greater access to it among people who haven’t had it. Elderly Americans need much more health care than younger generations, with Americans between 65 and 79 spending $811 a year on prescription drugs versus $124 a year for Americans aged 18 to 34. With a rapidly increasing elderly population, drugmakers can assume much higher demand for their products. Companies positioned to benefit from this trend that we own in client portfolios include Novo Nordisk, Walgreen’s, and Merck, among others.

P.P.S. As the world ages, an increasing number of fraudsters are looking to take advantage of the elderly. Kiplinger reports:

Financial exploitation is one of the most vicious kinds of abuse inflicted on seniors. It can range from petty financial crimes, such as stealing cash or forging checks, to more-elaborate deceptions in which the perpetrator manipulates an older adult into handing over money or control. Only one in 44 cases of elder financial abuse are reported, according to the New York State Elder Abuse Prevalence Study from 2011. Victims are hesitant to speak up because they are embarrassed, fear losing their independence or are reluctant to sever ties if the perpetrator is a loved one.

Financial abuse and elder fraud can do more than devastate an adult’s savings, credit or ability to pay for long-term care. Many victims suffer medical and psychological harm, and they experience higher mortality rates than seniors who are not abused.

“Older adults make great targets because they have accumulated assets over time and are living off their savings,” says Larry Santucci, who co-authored a report about elder financial victimization for the Federal Reserve Bank of Philadelphia. “Some are also very lonely or socially isolated, which makes them susceptible to exploitation.”

The FTC (877-438-4338), AARP (877-908-3360), and the IRS (800-366-4484) all have hotlines providing information, help, and reporting for fraud, identity theft, and tax scams. If you feel like you have been the victim of identity theft, fraud, or abuse, please seek assistance.

P.P.P.S. CNBC reports that Goldman Sachs sees a significant correction if Democrats sweep the 2020 elections. Goldman says S&P 500 earnings could tumble 12% if the 2017 tax-cuts are rescinded. Goldman is being modest in our view. A Democrat sweep, which increases the likelihood that many of the anti-business policies being discussed in the primaries are implemented, sounds like a recipe for recession. Earnings would likely fall much more than 12% in such a scenario.

P.P.P.S. Speaking of CNBC, I am honored to announce that Richard C. Young & Co., Ltd. was named in the Top 10 of CNBC’s 2019 Top 100 Financial Advisors ranking. We are one of only a handful of firms with listed offices in Florida or Rhode Island to make the list.


Buying the Highest-Yielding Stocks

November 2019 Client Letter

For investors who may be new to dividend investing, a tempting first place to look for ideas is with the highest-yielding dividend stocks. If dividends are the goal, the assumption is bigger dividends are better than smaller dividends.  

Take the S&P 500 as an example. The 10 highest-yielding stocks in the index have an average yield of almost 8% compared to less than 2% for an S&P 500 ETF. An 8% yield is surely better than a 2% yield reason some beginners. And with Macy’s yielding 10.3%  and L Brands (Victoria’s Secret, Pink, Bath & Body Works) yielding 7.1% among the group, the familiarity of these household names can lead to misplaced confidence in such a strategy.

What’s wrong with just buying Macy’s, L Brands, and the eight other highest-yielding stocks in the S&P 500 and calling it a day?

The problem with limiting your dividend portfolio to the highest yielders is they are often the companies most likely to cut their dividends. For example, four of the ten highest-yielding S&P 500 stocks at year-end 2016 have since decreased or eliminated their dividend. The average return of that group of stocks since year-end 2016 is -33%.

The Best Dividend Stocks

As most seasoned dividend investors would likely tell you, selecting the best dividend stocks isn’t as simple as buying the highest-yielding companies. The chart below compares the long-term performance of five different dividend-investing strategies.

The first strategy, represented by the column to the far-right, ranks all U.S. stocks by dividend yield and then invests in the highest-yielding 10% of stocks. All stocks are re-ranked, and the portfolio is reformed annually. The second strategy, represented by the second column in from the right, buys companies in the second-highest 10% as ranked by yield. The other three portfolios follow suit.

The Best-Performing Dividend Investment Strategy

As our dividend strategy chart illustrates, investing in the highest-yielding stocks hasn’t delivered the best returns. The best-performing dividend investing strategy out of the five shown here is the portfolio that invests in dividend-paying stocks in the third-highest 10% of stocks ranked by yield.

Proper Dividend Investing Weighs a Range of Factors

This doesn’t mean you should buy only stocks in the third group when ranked by yield, but it does mean you should weigh a range of factors when crafting dividend portfolios. A juicy yield is certainly one consideration, but dividend safety and dividend growth are others that may be even more important.

Our dividend-focused Retirement Compounders® program takes into account dividend yield, dividend growth, dividend consistency, and dividend safety, among other factors.

Our goal is not to craft a portfolio with the highest yield. We instead seek to craft portfolios that generate a sustainable and rising income stream that harnesses the profound power of compounding.

Dividend Stocks Help You Stay the Course

Investing in companies that pay a steady stream of income can help investors in or nearing retirement to stay the course.

During bull markets, many investors have an easy time riding though the minor ups and downs; but when bear markets begin, investing becomes much more difficult. Bear markets can be frightening. For starters, the losses can come with staggering velocity.

Historically, bear markets move from peak to trough more than twice as fast as bull markets move from trough to peak.

Last year was a good example. A New York Times piece in December 2018 titled “Investors Have Nowhere to Hide as Stocks, Bonds, and Commodities All Tumble” captured the mood.

For the first time in decades, every major type of investment has fared poorly, as the outlook for economic growth and corporate profits is dampened by rising trade tensions and interest rates. Stocks around the world are getting pummeled, while commodities and bonds are tumbling—all of which have left investors with few places to put their money.

If this persists or grows worse, it could create a damaging feedback loop, with doubts about the economy hurting the markets, and trouble in the markets undermining growth.

From its September 20, 2018, high, the S&P 500 lost 19.8% through its December 24 low. That three-month loss wiped out all of the index’s capital appreciation of the prior 20 months.

This year, the fear of recession has been replaced by the fear of missing out. In a survey of fund managers, Bank of America found in its latest monthly survey that institutional investors deployed the most cash since President Trump was elected in 2016. Today, cash on hand at funds is at its lowest level since June of 2013.

Risk and Reward

If you find yourself wanting to sell all your stocks when markets are caving in and all your bonds when stocks are rallying to capture a little more upside, it may be time to reevaluate your risk tolerance.

Determining how much risk you can afford to take and how much risk you are comfortable taking is key. Many investors are willing to forgo some amount of return to reduce the potential for loss. 

The “efficient frontier” concept, created by economist Harry Markowitz in 1952, measures the efficient diversification of investments that delivers the highest level of return at the lowest possible risk.

Investors must consider the trade-off between risk and reward in their portfolios. You can see on the chart below an efficient frontier line representing risk vs. reward for a portfolio allocated between different proportions of stocks and bonds.


On the vertical axis is the return earned by the portfolios, and along the horizontal axis is a measure of how much risk was taken to earn those returns. As you can see by comparing the portfolio of 75% bonds and 25% stocks to the portfolio of just bonds, as portfolios take on a small number of stocks, diversification lowers risk and increases reward.

Anything above the line is unachievable because no portfolios earning those returns are available at the corresponding risk levels. And any portfolios that fall below the line can be outperformed with the same amount of risk or have their returns matched with less risk.

But to achieve higher returns along the line, investors adding more stocks to their portfolios are taking on ever-greater amounts of risk. A portfolio of 100% stocks has a standard deviation of 17%.

The higher the standard deviation of a portfolio, the greater the potential for loss. For example, during the last two bear markets, an all-stock portfolio (as measured by the S&P 500) would have lost more than half of its peak value.

Buying Bonds for Ballast

As the efficient frontier illustrates, adding bonds to a stock-only portfolio can help reduce risk. Even at ultra-low yields, bonds have counterbalancing benefits. Take the hypothetical example of a 10-year bond yielding 1.50%. If interest rates were to decline one percentage point because stocks were crashing, the price of that 10-year bond would rise by 9.75%.

In 14 of the 15 years when the S&P 500 has been down since 1950, intermediate-term government bonds advanced. We would, of course, rather hold bonds at higher yields than at lower yields; but even at low yields, bonds are ballast for a portfolio.

Gold Has Counterbalancing Benefits Too

Gold is another asset we favor for its counterbalancing benefits. It doesn’t always behave as desired in a down market; it does, however, provide a hedge against some of the low likelihood, high-impact risks that can devastate portfolio returns. Those risks include a significant rise in inflation, a collapse of the dollar, geopolitical turmoil, and financial system upheaval, among others.

The Best Way to Buy Gold

We have long favored gold ownership via exchange-traded funds (ETFs). Gold ETFs are an easy and economical way for most investors to buy physical gold.

Since the SPDR Gold Shares ETF (GLD) debuted in 2004, it has been our go-to ETF for physical gold investing, primarily because GLD was the only game in town.

More recently, competition has emerged in the physical gold space, and the SPDR Gold Shares ETF is no longer our favored gold ETF.

Gold ETFs Are a Commodity

Unlike some equity ETFs that may cover value stocks or growth stocks by tracking an index that measures growth and value differently, the seven gold ETFs traded in the U.S. all purchase physical gold. Whether you buy the SPDR Gold Shares ETF (GLD) or the iShares Gold ETF (IAU), the assets held by each fund are essentially identical.

Expenses and Liquidity Are Key to Choosing a Good Gold ETF

Expenses and liquidity are the primary factors we focus on when selecting a gold ETF for investment. All else equal, we prefer a heavily traded gold ETF with a low expense ratio over a small infrequently traded fund with a high expense ratio.

SPDR Gold Shares ETF (GLD) is by far the largest and most liquid gold ETF. GLD has the greatest dollar volume of the seven ETFs traded in the U.S. and the lowest bid-ask spread. The average bid-ask spread of GLD is .01%, or one basis point. The next closest competitor is seven times as expensive as GLD.

The problem with GLD and the reason we have moved away from the ETF is the expense ratio. GLD charges investors a 0.40% expense ratio—more than double some of the low-cost options now available.

For investors with a multi-year time horizon, GLD’s sector-leading liquidity and transaction costs aren’t enough to make up for the high expense ratio.

By example, if an investor plans to buy and hold a gold ETF for three years and is deciding between the SPDR Gold Shares ETF (GLD) and the SPDR Gold MiniShares ETF (GLDM), his average costs over the three-year holding period will be 40.3 basis points for GLD and 20.3 basis points with GLDM: a savings of 20 basis points per year for almost the exact same investment.

SPDR Gold MiniShares ETF Now Best for Investors

SPDR Gold MiniShares ETF (GLDM) has become our favored gold ETF for new money. GLDM has one of the lowest expense ratios among the gold ETFs traded in the U.S., and it has critical mass as well as a competitive bid-ask spread.

To take advantage of the lower expense ratio, we recently swapped GLD for GLDM in all tax-deferred accounts. We still own the SPDR Gold Shares ETF (GLD) in many taxable portfolios, as the position is held at a large gain. With new deposits and in new portfolios we are also now buying GLDM instead of GLD.

Have a good month. As always, please call us at (888) 456-5444 if your financial situation has changed or you have questions about your investment portfolio.

Warm regards,

Matthew A. Young
President and Chief Executive Officer

P.S. Sarah Nassauer reports in The Wall Street Journal that American consumers are showing no signs of being held back by tariffs, as they push Walmart sales to a five-year growth streak. She writes:

American consumers showed no signs of belt-tightening in sales results from Walmart Inc., offering comfort to retailers worried about fallout from the trade war and the health of the global economy as the holiday shopping season nears.

Walmart said its U.S. comparable sales, those from stores and websites operating for at least 12 months, rose 3.2% in the period ended Oct. 25, marking a five-year streak of quarterly sales gains. Its e-commerce sales in the U.S. rose 41% from a year earlier, bolstered by grocery orders.


The Royal Road to Riches: Blue-Chip Dividend-Paying Stocks

October 2019 Client Letter

Several years ago, the Wall Street Journal reported the investment success of Vermont resident Ronald Read. The story recounted how Read accumulated an estate valued at almost $8 million. Mr. Read, who passed away at age 92, made a modest living pumping gas for many years at a Gulf gas station in Brattleboro.

How a Vermont Gas Station Attendant Turned a
Blue-Collar Job into Millions

How did Read manage to become a multi-millionaire? He invested in dividend-paying blue-chip stocks. As Anna Prior wrote in the WSJ, Mr. Read received the actual stock certificates and “left behind a five-inch-thick stack of stock certificates in a safe-deposit box.” At his passing, Mr. Read owned over 90 stocks and had held his positions often for decades. The companies he owned paid longtime dividends. And when his dividend checks came in the mail, Read reinvested in additional shares. Apparently, he was a master of the theory of compound interest. Not surprisingly, his list of stock holdings included such seasoned dividend-payers as Johnson & Johnson (dividend since 1944) Procter & Gamble (dividend since 1891), J.M. Smucker (dividend since 1949 ), and CVS Health (dividend since 1916 )—all names we follow and own for clients. No highfliers for Ronald Read, and certainly no speculative, unseasoned technology names.

At Richard C. Young & Co., Ltd., our investment strategy is also focused on seasoned blue-chip dividend-paying firms with a record of increasing dividends regularly. We further favor companies with durable competitive advantages that operate in industries with high barriers to entry.

Risk Should Always Come Before Return

Like most investment managers, our goal is to make money for our clients; but, unlike some, we are focused first on risk and then on return. Returns are important, but the strategy used to achieve those returns and especially the amount of risk taken to earn those returns is critical.

Getting Lucky With Netflix

Take Netflix by example. Over recent years, some investors have earned exceptional returns by “investing” in companies like Netflix. Over the last decade, Netflix shares have compounded at almost 45%. Any investor who bought and held shares of Netflix for the last decade (easier said than done) has likely done well. But how much risk was taken to earn those returns?

In 2009 Netflix was just getting into streaming, and it still had a big DVD-by-mail business. Netflix generated no original content to speak of and was up against formidable competitors such as Comcast in distribution and Disney and HBO in content creation. If streaming was Netflix’s future, a prudent investor might have reasoned the company would have a tough row to hoe.

Netflix circa 2009 was essentially a nice-looking user interface and some licensing agreements. What’s more, even if Netflix was successful, it would be faced with a wholesale transfer-pricing problem. What is a wholesale transfer-pricing problem? In the case of Netflix, the problem has to do with licensed content. Content creators hold all the cards. As soon as Netflix started to earn profits, content creators could take substantially all of those profits by increasing the price to license content.

Of course, as we know now, things turned out much better for Netflix than they could have. The problem is that there is no reliable or repeatable strategy for identifying the source of Netflix’s success. Gross incompetence from cable providers and an extremely slow move into streaming from content creators were perhaps more responsible for Netflix’s success than the company’s own strategy and execution.

Disney Will Make Life Tough for Netflix

And not for nothing, but many of the issues Netflix faced in 2009 still lurk as major risks for the company today. Content providers are pulling their top shows off Netflix, and Disney, HBO, Apple, and Comcast all have competing streaming services that start rolling out next month. The Disney+ service launches November 12 for $6.99 per month and will be free for a year to many Verizon customers. Free will be hard for Netflix to compete against.

Betting that a company with almost no competitive advantage will succeed because of poor strategic decisions on the part of competitors probably isn’t a prudent strategy.

Our Focused Strategy For You

At Richard C. Young & Co., Ltd., we favor the tried and true. Our focus on seasoned dividend-paying companies provides a more reliable and repeatable stream of investment returns than trying to pick the next Netflix. We want to buy firms with competitive advantages, and we want those firms to pay a stream of cash to shareholders.

It’s not a complicated formula. It is unlikely to yield results anywhere near the results Netflix shareholders earned over the last decade, but it is a higher-confidence approach than trying to pick out the one or two needles that may be in the haystack.

Young’s Retirement Compounders© Program

For our equity purchases in the Retirement Compounders© (RCs) program, we focus on individual stocks. The RCs is our globally diversified portfolio of dividend- and income-paying securities. Our goal with the RCs is to buy dividend stocks with safe and growing payouts. We take a portfolio approach to achieving this objective. Some of the stocks in the RCs have modest yields but strong dividend-growth prospects, while others have high yields but modest growth prospects.

Microsoft and Verizon

Microsoft shares offer a yield of only 1.50% today; but over the last five years, the dividend has compounded at 10.4%. Microsoft’s dividend payout also appears safe. Over the last year, MSFT generated over $38 billion in free cash-flow compared to dividends of $13.8 billion. Even if Microsoft’s free cash-flow remained flat, the company could increase its dividend at a 10% annual rate for another decade and still have excess cash-flow.

Verizon is a firm that falls into the high-yield and modest-growth category. Its shares yield 4%, and we expect the dividend to increase at about 2% per year in the medium term.

For several years now, we have favored a portfolio of individual stocks as opposed to funds.

What Has Gone Wrong with the Mutual Fund and ETF Industry?

For starters, some of our favored mutual funds have gotten so big that their investment universe has shrunken significantly. The Dodge & Cox Stock fund is a mutual fund we used to buy for clients that falls into this category. Today, Dodge & Cox Stock is a lumbering $70-billion behemoth. If Dodge & Cox wants to take a 2% position in a stock, it has to deploy $1.4 billion. A 4% position requires a $2.8-billion investment. If D&C fund managers want to stay under the 5% ownership threshold that requires additional regulatory filings, the fund can only choose from about 120 stocks.

Limited Customizations

Crafting fund portfolios also limits customization for clients. We have clients who don’t want to hold a specific security because they have a legacy holding outside of our management, or they want to avoid tobacco stocks, for example. It is easier to accommodate requests like these with an individual security approach than with funds and ETFs.

Tax Efficiency of Individual Stocks vs. Mutual Funds

Tax efficiency is another significant advantage of investing in individual stocks instead of mutual funds. The tax-loss harvesting opportunities with a portfolio of 40 to 50 stocks are greater than they are in a portfolio of five or six mutual funds. And mutual fund investors must pay taxes on distributed capital gains annually and again at the time of sale. The former is true even if your mutual fund is held at a loss by the investor.

Your Fellow Shareholders Are a Problem

The performance of mutual funds and the tax liabilities that mutual funds generate are also dependent (to an extent) on other shareholders in the fund. Outflows can be a problem for shareholders who don’t redeem, and the mutual fund industry has been plagued by regular outflows for more than a decade now. The chart below shows the cumulative outflows from equity mutual funds since year-end 2006. Equity funds have lost $1.3 trillion in assets, with an acceleration of those outflows starting in 2015.

To meet redemptions, fund managers may be forced to sell high-conviction ideas or positions with large unrealized gains. Neither option bodes well for shareholders who decide to stick around. These problems can be magnified during sharp market corrections when other shareholders in a fund may panic and redeem shares.

Why Pay Twice for Financial Advice?

One of the other big benefits of an individual security approach is cost. Mutual funds can be expensive, adding an unnecessary second level of fees. An advisory firm charging a 1% management fee, and investing in a portfolio of mutual funds with an average expense ratio of 1%, costs the end investor 2% per year.

The Overdiversification Problem With
Advisor-Managed Mutual Fund Portfolios

Investing in a portfolio of mutual funds can also lead to overdiversification. Owning three large-cap mutual funds, for example, may result in owning every stock in the large-cap universe. Building a portfolio stock by stock allows an investor to buy big enough positions of his best ideas to make a difference without taking on too much concentration risk.

Risk of Concentrated Positions

Most investors with some experience in markets have likely heard that diversification is “the only free lunch in investing.” Despite what is a universally accepted tenet of investing, some choose to believe they are more like Jeff Bezos or Warren Buffett than a passive investor. Yes, it is true that some of the wealthiest people in the world became rich by owning one stock, but many more lost a fortune by staying too concentrated.

The risks of a concentrated portfolio are many and varied. There is industry risk, which we have seen with the energy sector in recent years. There is management risk, with which GE shareholders should be familiar. There is company-specific risk, of which GoPro, BlackBerry, and Eastman Kodak are examples. And then there is the risk of outright fraud, which can take down even large firms such as Enron and Worldcom.

At Richard C. Young & Co., Ltd., we diversify portfolios across sectors and industries as well as individual firms. By example, we are currently purchasing eight stocks in the healthcare sector. Most are drug companies. Why don’t we just try to buy the top stock in pharma? The pharmaceutical industry has certain low-probability, high-impact risks that can result in big losses if realized. Spreading assets across different stocks reduces the risk that one of these unpredictable events will have an outsize impact on the overall portfolio.

Have a good month. As always, please call us at (888) 456-5444 if your financial situation has changed or you have questions about your investment portfolio.

Warm regards,

Matthew A. Young
President and Chief Executive Officer

P.S. It can be easy to dismiss stock-market risk during periods of a rising market. 2019 has been a solid year for stocks. Today’s bull market is in its 11th year, which puts the financial crisis further in the rear-view mirror. But market risk still exists and requires thoughtful consideration. If you have a risk-seeking personality and tend not to become concerned during bouts of volatility, you may not seek to craft a portfolio that limits losses during bear markets. But, if market panics and volatility are a bother, ensuring your portfolio is tailored to your risk profile may be the most important investment decision you make. Remember, during the 2007–2009 bear market, the S&P 500 Index lost 55%. When your portfolio loses 50% you need to make over 100% to just get back to even. If you lost 55% during the financial crisis, that required a 122% gain to get you out of the red. Meanwhile, during that 2007–2009 period many bond-holdings were up 6%; and GLD, which is considered a counter-balancer, was up 20%.

P.P.S. If you drive through Tate, Mississippi, today and fill up your car’s gas tank, you’ll pay about $2.059/gallon. Meanwhile, if you fill your vehicle nearly anywhere in California, you’ll pay over $4. Why the disparity? The Wall Street Journal offers some indication of the cause, writing: “California gas prices have been increasing relative to the other 49 states for years. The disparity especially widened in 2013 when the state’s cap-and-trade program took effect and in 2018 after Democrats raised the state gas tax. Last year California’s gas prices tracked about 77 cents higher than the U.S. average.” If you are living on a fixed income, these sorts of cost-of-living increases can erode your disposable income and reduce your standard of living. Other areas that retirees must consider are property taxes, utility costs, taxes on retirement income, and sales taxes. These are all quiet reducers of disposable income that must be taken into consideration.

P.P.P.S. Have you met your 2019 required minimum distribution (RMD)? Do you plan on making a charitable donation from your IRA in 2019? To help us facilitate the processing of your RMD by year-end, we recommend you submit a completed distribution form before December 1. If you haven’t satisfied your RMD and don’t have a distribution plan in place, please contact our office as soon as possible. Submitting your request early will allow us to address any problems before year-end. If you fail to take your RMD by the December 31 deadline, a 50% penalty may be assessed on the amount you are required to take.

P.P.P.P.S. Each year, Barron’s ranks the nation’s top independent advisors. Richard C. Young & Co., Ltd. has been recognized on this list for eight consecutive years.*

* Rankings published by magazines, and others, generally base their selections exclusively on information prepared and/or submitted by the recognized advisor. Rankings are generally limited to participating advisors and should not be construed as a current or past endorsement of Richard C. Young & Co., Ltd. Barron’s is a trademark of Dow Jones & Company, Inc. All rights reserved.


Should You Be Concerned about a Recession?

September 2019 Client Letter

It’s easy to declare a recession is on the horizon. The economy, like the markets, is cyclical, and eventually, our economy will go from a growth path to one of contraction. But today there are few signals that our economy is heading into negative territory. Despite a significant lack of recessionary evidence, some continue to beat the recession drum. By example, last month the Washington Post gave us this: “Most economists believe the United States will tip into recession by 2021.”

I’m not too concerned yet about a recession for the following reasons: For starters, trade negotiations with China could eventually get resolved. If the U.S. gets a deal with Beijing, ending the tariffs and uncertainty, then the economy could gain momentum. Secondly, current monetary policy is not aggressively tight. When rates are too high, the economy often slows. Thirdly, the leading economic indicators have yet to show the persistent monthly declines that often precede recession. Lastly, I hesitate to make any economic predictions beyond 2020 until we know the outcome of next year’s elections.

Your Bigger Concern

As reported in The Wall Street Journal,

Earlier this month, Mr. Powell cited Fed policy this year as an important reason the U.S. economy has proved resilient despite increased headwinds. Officials pivoted first from raising rates to putting them on hold, and then to cutting them as conditions shifted. His comment implicitly acknowledged how failing to deliver now on markets’ expectations of another rate cut could damage the outlook.

I think we can hold off on mailing the Fed a thank-you card for saving the day. In our view, bigger government is not the answer. Nor should we look for it to be. The Fed would be more helpful if it cited the real reasons we have a resilient economy, which include corporate tax cuts in the U.S. and less regulation.

Years of low and negative interest rates have done little to create sustained and robust global economic growth, but they have forced many investors into taking on more risk.

However, if I look on the bright side of low-interest rates, the drop in yields has made dividend- and income-focused stock portfolios fashionable again. Some sectors benefiting from the decline in interest rates include utilities, real estate, and consumer staples. We own positions in all three.

Fortis

Not only have low rates improved sentiment toward utility stocks such as Fortis, but they have also been a boon for Fortis’s capital-intensive business. Fortis has increased its capital spending by $1 billion to $18.3 billion for the next five years. The additional capital spending will allow Fortis to modernize its grid, deliver cleaner energy, and invest in its U.S. and Caribbean businesses. Fortis also plans on expanding its liquified natural gas (LNG) facility at Tilbury, British Columbia, which is used to store and ship LNG. Tilbury is one of only two LNG facilities on Canada’s west coast. The other, Mt. Hayes, is also owned by Fortis. Alongside these valuable capital expenditures, Fortis is celebrating its 46th consecutive year of dividend increases. Fortis’s management has confidence that the company will maintain its investment-grade credit rating and deliver on its plan for 6% annual dividend growth.

American Tower Corp.

The capital-intensive mobile technologies industry is another area that may benefit from lower interest rates. Buying property and building towers costs a lot of money. Mobile data traffic grew at a rapid 87% compound annual growth rate from 2 petabytes back in 2006 to 3,570 petabytes in 2018. Carrier investment in wireless capex and spectrum has been increasing with each new technological enhancement. From 2000 to 2005, as the industry transitioned from 2G to 3G, it spent an average of $17 billion a year. During the 3G expansion years that lasted from 2006 to 2010, it was $23 billion annually. And in the 4G network expansion years from 2010 to 2018, it was $30 billion each year. Now, as the industry rolls out 5G, another significant expenditure will be needed. American Tower can use low-interest debt to expand its operations to accommodate its customers’ 5G rollouts.

Kimberly-Clark Corp.

A combination of strong second-quarter results and favorable capital markets are likely behind Kimberly-Clark’s plan to make what management called “growth investments” behind its brands. The brand portfolio that Kimberly-Clark is backing is filled with winners. The company has five so-called “billion-dollar brands,” which generate revenue of a billion dollars or more each year. Those include Huggies, Kleenex, Kotex, Cottonelle, and Scott. Other great Kimberly-Clark brands include Pull-Ups, Andrex, Depend, WypAll, and more. The company’s brands touch nearly a quarter of the world’s population each day in over 175 countries. Kimberly-Clark maintains first or second position in 80 of the countries in which it competes.

Gold

Gold is also benefiting from the low-rate environment. Gold, which tends to perform well during uncertain times, has surged this year. Much of gold’s positive return can likely be attributed to a lower-interest-rate environment as compared to concerns about the U.S. economy.

Gold is a Unique Holding

Gold is a unique holding within your portfolio. It is one of the few positions we own that pays no interest or dividends. Gold is also the only position we hold where we hope the price goes down. Today, jewelry is the primary use for the metal. But investors’ demand is what dictates the price of gold. And that demand is often driven by fear: fear of war, inflation, a currency crisis, or some other troublesome event.

We view gold as an insurance policy for your portfolio. For much of the last five years, gold has experienced little price movement; but, since the end of April, gold is up significantly compared to a modest rise in the S&P 500.

Jack Bogle and Dick Young

With gold rising, the China trade headline, and next year being an election year, many are expecting a higher degree of uncertainty and volatility compared to the last couple years. We believe it is wise to have an appropriate plan for your financial goals and your risk tolerance. With a solid plan in place, you will be in a better position to ride out market volatility and avoid panicking and the dangers of trading in and out of the market.

In his last interview for CNBC, Jack Bogle, as always, offered sound advice on why timing the markets never works.

The bad years, the crisis years, the Dow dropped by about 50% and people panicked and got out of course at the lows and now we are back. I think the gain from that level is maybe 200%. So, it shows you that when you act on the emotions of the marketplace, you’re making a big mistake.

I always have said stay the course, and don’t let these changes in the market, even a big one that was a 50% decline, don’t let that change your mind and never, never, never be in or out of the market. Always be in it at a certain level and you may want to be 50% stocks like I am. You may want to be 75% or 25%. That’s probably a decent range. But never be out and think you can get back in because your emotions will defeat you totally.

My dad had similar advice to subscribers of his monthly investment newsletter, Richard C. Young’s Intelligence Report. Back in March 1996, he urged readers to abandon the strategy of market timing.

I want to startle you, shock you, and convince you beyond any doubt that market timing is a bankrupt strategy whose time has never come.

Here’s the only example you’ll ever need to never market-time again. T. Rowe Price put these numbers out a year or so ago. The original research was done by Towneley Capital Management.

If you invested $1 for a 31-year period (1963–1993), your $1 grew to $24.30 at year-end 1993. But if you missed just the 10 best trading days out of the 7,802 trading days, your $1 investment grew to only $15.40. That’s right, by missing just 10 days, your return was slashed by 37%. Do you know what percentage of the trading days we are talking about here? Less than one-quarter of one percent (0.128%).

Now then, if instead of only 10 days you missed the best 40 days of 7,802 trading days, your $1 grew to only $6.50. By missing just 0.51% of the total trading period, your return was slashed by an unimaginable 73%. How’s that for missing the boat?

OK, what if you missed out on just 1.15% of the trading days? Well, by missing just 90 of the total 7,802 trading days, your $1 made a glacier-like advance to $2.10. You would have been head-faked out of 91.4% of your long-term profits.

Still with me? The news gets worse—a lot worse. In-and-out trading necessitates not one, but two correct buy/sell decisions. It does no good to get out of the market advantageously unless you can also get back in advantageously—and both are low odds, big “ifs.”

Have a good month. As always, please call us at (888) 456-5444 if your financial situation has changed or if you have questions about your investment portfolio.

Warm regards,

Matthew A. Young
President and Chief Executive Officer

P.S. Retirement Compounders® (RC) is our globally diversified portfolio of dividend- and income-paying securities. Currently, the RCs offer yields of approximately 3.1% or 80% more than the current rate of inflation. Aside from an attractive yield, we also prefer our stocks to maintain annual dividend increases. Recent increases were announced by Microsoft (+11%), Kroger (+14%), Clorox (+10%), American Tower (+20%), and Lowe’s (+14%).

P.P.S. Some of you will notice a change in your gold holdings. In many tax-deferred accounts, we recently sold shares of SPDR Gold Shares (GLD) and purchased shares of SPDR Gold Minishares (GLDM). State Street manages both funds, and both invest in physical gold stored in London vaults. The primary difference between the two funds is the expense ratio. The Minishares fund has an expense ratio of 0.18% compared to an expense ratio of 0.40% for GLD. We continue to hold GLD in accounts where a sale would generate a taxable event, and in accounts where the transaction costs would eat up the potential savings from a lower expense ratio.  

P.P.P.S. Recently in The Wall Street Journal, former Senator Phil Gramm and hedge fund consultant Mike Solon detailed some terrifying aspects of Sen. Elizabeth Warren’s plan to tax wealth. The writers noted the difference in the average $1.1 million of wealth held by Americans aged 65 to 74, and the average of $288,700 held by those aged 35 to 44 is the product of a lifetime of hard work and savings. But Warren’s plan only sees inequality in those differences. Most retirees have at least some of their wealth invested in stocks. Warren’s plan would diminish the value of their savings. The authors write:

Several Democratic congressmen and presidential candidates have proposed to limit stock buybacks, which are estimated to have increased stock values by almost a fifth since 2011, as well as to block dividend payments, impose a new federal property tax, and tax the inside buildup of investments. Yet among all the Democratic taxers and takers, no one would hit retirees harder than Sen. Elizabeth Warren.

Her “Accountable Capitalism Act” would wipe out the single greatest legal protection retirees currently enjoy—the requirement that corporate executives and fund managers act as fiduciaries on investors’ behalf. To prevent union bosses, money managers or politicians from raiding pension funds, the 1974 Employee Retirement Income Security Act requires that a fiduciary shall manage a plan “solely in the interest of the participants and beneficiaries . . . for the exclusive purpose of providing benefits to participants and their beneficiaries.” The Securities and Exchange Commission imposes similar requirements on investment advisers, and state laws impose fiduciary responsibility on state-chartered corporations.

Sen. Warren would blow up these fiduciary-duty protections by rewriting the charter for every corporation with gross receipts of more than $1 billion. Every corporation, proprietorship, partnership and limited-liability company of that size would be forced to enroll as a federal corporation under a new set of rules. Under this new Warren charter, companies currently dedicated to their shareholders’ interest would be reordered to serve the interests of numerous new “stakeholders,” including “the workforce,” “the community,” “customers,” “the local and global environment” and “community and societal factors.”

Eliminating corporations’ duty to serve investors exclusively and forcing them to serve political interests would represent the greatest government taking in American history.


Yields Below Inflation

August 2019 Client Letter

On August 15, the 10-year Treasury note offered a yield of 1.52%. The S&P 500 offered a yield of 1.83% and the NASDAQ composite a measly 0.97%. Think those yields are low? More than $15 trillion of government bonds worldwide now trade at negative yields, with 10-year German government bonds recently hitting a low of -0.71%.

Over the last year, inflation in the United States has averaged 1.8%, creating a dreadful environment in which investment income generated is less than the rate of inflation. If investors cannot find decent-yielding investments, they must rely on capital appreciation to keep pace with inflation. I’ve always been of the mind that relying on capital appreciation requires someone (a greater fool perhaps) to buy your appreciated asset at a higher price than you paid. Such an approach has more in common with speculation than investment.

The Retirement Compounders® Solution

Low dividend-yields and appalling valuations during the dotcom bubble were the catalysts for establishment of the Retirement Compounders® program. Retirement Compounders® (RC) is our globally diversified portfolio of dividend- and income- paying securities. When valuations are high, as they were then and as we see them today, stock prices can remain depressed for long periods. It took the S&P 500 more than 13 years to convincingly surpass the high it had reached in March of 2000. It took the lower-yielding Nasdaq composite 16 years to achieve the same feat (see charts below).

Investing in stocks that pay dividends and regularly increase those dividends can offer a solution to prolonged dry spells in the stock market.

The total return of the S&P 500 from March 2000 to March 2013 was 2.27%. Over the same period, the Bloomberg Barclay’s T-bill Index earned 2.25%. In March 2000, the RCs didn’t exist, but the Nasdaq Broad Dividend Achievers Index and the S&P Dividend Aristocrats Index did. Both pursue similar dividend-focused strategies to our Retirement Compounders®. The Dividend Achievers Index was up 4.9%, and the Dividend Aristocrats Index was up 9% over the same 13-year period. Dividends and dividend growth helped boost the total return of both indices relative to the S&P 500.

A Yield 80% Higher than Inflation

Today, the Retirement Compounders® portfolios we are crafting for clients offer yields of approximately 3.2% or 80% more than the rate of inflation. What’s more, when inflation rises, the profits and dividends of firms tend to increase.

Beat Inflation with Dividends

An example will help illustrate this essential point. Let’s assume I own an ice cream parlor. We’ll call it Matt’s Sweet Treats. Matt’s Sweet Treats did revenue of $10,000 last year (OK, so maybe the ice cream isn’t that good). The cost of making the ice cream and paying a couple of employees to serve it was $9,000. That left me $1,000 in profit. If inflation this year runs hot at 10%, I will increase my prices because I know my costs are also likely to go up 10%. A 10% increase in price will give Matt’s Sweet Treats revenue of $11,000 this year. A similar 10% increase in expenses will drive costs up to $9,900. That leaves me with a profit of $1,100. Voila, my profits are precisely 10% more than they were last year.

While my example is admittedly simple, and not all firms have the pricing power to pass on higher costs from inflation, over more extended periods, profits and dividends have kept pace with inflation. The chart below shows dividends of the S&P 500 vs. the U.S. Consumer Price Index used to calculate inflation. Both series are set equal to 100 at year-end 1949. Over the last seven decades, dividends have outpaced inflation by a wide margin.

Pricing power is an important lever in a company’s ability to maintain and raise its dividend. By example, if inflation heats up and costs soar, a high-end yacht manufacturer may have a harder time passing on higher costs than a firm that provides lower-priced consumer essentials.

The term “essentials” means different things to different people, of course. If you ask my teenage daughter, life’s essentials would include a cell phone and an unlimited data plan from AT&T.

If the cost of providing cellular service rises 10%, my daughter won’t let me cancel her AT&T plan. As a result, firms such as Verizon and AT&T shouldn’t have trouble passing on higher costs from inflation. Both telecommunications firms feature prominently in our Retirement Compounders® portfolios.

AT&T’s 5.8% Dividend Yield

AT&T is currently the higher-yielding of the two. The stock sports a yield of 5.8%, one of the highest-yielding names in our universe. With the acquisition of Time Warner, AT&T is a telecom and entertainment powerhouse. The company used debt to acquire Time Warner, which has made some investors hesitant on the stock; but we believe AT&T’s cash-flow profile makes both the debt and dividend serviceable.

Over the last 12 months, AT&T generated almost $30 billion in free-cash-flow. Free cash-flow is the cash left over after paying all cash expenses, including interest expense, and making investments to maintain and expand the company’s asset base.

AT&T Dividend Safety

AT&T’s $30 billion in free-cash-flow covers the firm’s annual-dividend payments twice over and leaves an additional $15 billion for debt reduction. Dividend growth is likely to be limited while the firm pays down debt, but we anticipate modest annual increases over the next few years. AT&T has an impressive record of 34 consecutive annual-dividend increases that we believe the firm will be reluctant to abandon.

Not only do firms like AT&T and Verizon pay good yields, but both firms offer investors a measured way to gain exposure to 5G.

AT&T and 5G

5G is the fifth generation of wireless telecommunications networks that promises significantly faster speeds. 5G networks may be up to 100 times faster than today’s 4G networks and competitive with cable internet. You will be able to download a 3 Gigabit movie over a 5G wireless network in under a minute compared to a half-hour using 4G and an hour using 3G. Will consumers still bother with wired cable and internet once 5G proliferates? 5G also has low latency, which makes it useful for applications in the internet of things, including self-driving vehicles and robotics. It’s possible that entire new markets will open for AT&T and Verizon as 5G spreads.

Kudlow’s King Dollar

Before being selected to serve as President Trump’s Director of the National Economic Council, Larry Kudlow was the economics editor at National Review Online and the host of CNBC’s The Kudlow Report. If you’ve spent time reading and watching Larry, you may remember his frequent arguments for a strong dollar. King Dollar is how Larry referred to it.

Writing in NRO back in March 2015, Kudlow quoted Economics Editor John Tamny as saying, “When investors invest, they’re hoping to get back the dollars they invested, plus an additional dollar return.”

Said another way, investors invest for a return of their capital and a return on their capital.

Investors risk their money in hopes of getting back the dollars they invested. Getting your money back is never a guarantee in investing, but it is the hope and belief of many. The fact is, businesses fail, currencies collapse and markets crash. Earning a return on capital would not be possible if there wasn’t the risk of capital loss.

To minimize these risks, it is necessary to craft a diversified portfolio. Putting all your eggs in one basket—or relying too heavily on any one company—is, in our view, a recipe for ruin. While diversification may seem to be a basic tenet of investing, not everyone agrees on its benefits.

Diversification vs. Concentration

Some professional investors eschew diversification. This crowd tends to subscribe to the philosophy that you should carefully pick the best eggs and watch them closely. But how many best eggs (ideas) can one have? The problem we see with this approach is today’s best idea may turn out to be tomorrow’s biggest loser. That isn’t a problem specific to concentrated portfolios. There is often a disaster or two in every portfolio (even the ones we manage!). The trouble is you don’t know which are the disasters ahead of time, and in a concentrated portfolio, a single wipeout can result in financial devastation.

Consider that, just before the turn of the century, a concentrated stock manager may have considered Enron, Bear Stearns, Lehman Brothers, General Motors, and GE to be his best-ideas portfolio. All were Fortune 500 companies at the time; but looking back today, four went bankrupt, and one has lost 80% of its value.

Proper diversification is essential to earning a return of capital and a return on capital. At Richard C. Young & Co., Ltd. we craft portfolios focused on cash flow. We diversify geographically and across industries, sectors, and asset classes in an effort to achieve both the return of capital and a return on capital.

Proper Portfolio Management is More than a Best-Ideas List

Our best ideas make it into your portfolio, but proper portfolio management is not just picking the securities that offer the highest return potential. Putting together a portfolio is a craft. All the pieces of the puzzle must be put in place, monitored regularly, and evaluated for change.

By example, let’s say you have an abundance of best ideas in the banking sector. That’s fine and well, but unless you have both the willingness (few do) and the ability (better not need to make any withdrawals) to take significant risk, putting all your assets in financials could lead to trouble. A savvy portfolio manager would likely complement a portfolio heavy in banks, which tend to fall when interest rates decline, with stocks or bonds that rise when interest rates drop.

Have a good month. As always, please call us at (888) 456-5444 if your financial situation has changed or if you have questions about your investment portfolio.

Warm regards,

Matthew A. Young
President and Chief Executive Officer

P.S. With more than $15 trillion in negative-yielding debt globally, the options for income investors are narrowing. The 30-year Treasury yield hit an all-time low of 1.97% in August. If a sub-2% yield on 30-year Treasuries doesn’t tickle your fancy, the indexing crowd can offer you a 1.8% yield on the S&P 500 or a .97% yield on the Nasdaq. Alternatively, if you have concerns about the future global yield environment, as we do, you may find comfort in our Retirement Compounders® equity portfolio. It offers a yield of 3.2% today and comes without the second layer of fees and hidden costs prevalent in the ETF and fund portfolios that many advisors peddle.

P.P.S. We include gold in your portfolio as a counterbalancer. Gold tends to zig when other assets zag, but that isn’t always true. Year-to-date, gold is up 17%. Stocks are up a comparable amount, and bonds are also having a solid year. Why is gold up when stocks and bonds are also rallying? Maybe the better question is why are stocks up when bond yields are crashing to new lows and gold prices are soaring? What do investors in bonds and gold (traditional safe-haven assets) see that stock-market investors are missing?

P.P.P.S. There are at least some investors in the stock market who see risk. The WSJ recently pointed out that defensive areas of the market have been rallying as some fear faltering economic growth. Our defensively positioned portfolios have benefited from the rush to safe-haven assets. Consumer staples stocks are up 20.6% YTD and 1.3% so far in August. The more cyclically sensitive consumer discretionary and technology shares are both down in August.


4,000-Year Low in Bond Yields

July 2019 Client Letter

You may have concerns about today’s environment and how a variety of risks could impact the long-term health of your finances. One of the biggest concerns we all face is interest rates that have been so low for so long.

Jim Grant writes in his Grant’s Interest Rate Observer newsletter, “almost $13 trillion in debt world-wide is priced to yield less than nothing. Mostly, it’s just a little less than nothing, but, still, a little less than nothing isn’t much to retire on.” He calls this a 4,000-year low in bond yields.

What kind of investor would buy negative yielding bonds? Writing in Barron’s, Grant points the finger at passive bond investors:

Peter Chiappinelli, a portfolio strategist at GMO, Boston, says he has given it considerable thought. In a sense, the buyer is the aforementioned Global Agg index, though the index hardly buys itself. The mystery buyer, Chiappinelli says he has come to see, “is anybody who owns a passive mutual fund tied to the Global Agg. Or anyone who might now own a passive ETF tied to a global bond index. Or anyone who owns a popular target-date fund that has passive exposure to global bond indexes. In other words, millions of Americans.”

Good Policies—Not Easy Money—Are
What Help the Economy and Your Portfolio

Can you believe how much attention is paid today to the Federal Reserve and central banks around the world? Does anyone really think the Fed is the reason the economy does well, or falls apart? Certainly, the Fed can cause problems by raising rates too high and choking off growth. But for the most part, the Fed is not the reason for a healthy economy. Some primary drivers for a healthy economy are creating and maintaining an environment where individuals can easily form businesses and be free to innovate.

The Fed is one of the last places to look for help bolstering long-term growth potential or raising America’s standard of living. By example, look back at the financial crisis. Many believe the $700-billion Troubled Asset Relief Program (TARP) coupled with quantitative easing (QE) by the Fed were responsible for our rescue. TARP was signed into law in early October 2008 while QE was announced in November 2008. From the period TARP was signed, through March 9, 2009, the S&P 500 fell 38%, the S&P Financials Index fell over 60%, we saw a decline in GDP, and the unemployment rate increased.

In our view, the turning point for the crisis came in early March 2009, when Barney Frank, chair of the House Financial Services Committee announced there would be a hearing on mark-to-market accounting on March 12.

As Brian Westbury explained in a 2013 blog post, changes in the rules for mark-to-market accounting in 2007 created a negative feedback loop that turned what might have been a big problem into a disaster (emphasis—underlined below—is ours).

It wasn’t until early March, when FASB finally agreed to change M2M accounting that things turned around. The reason for this is simple. As long as assets were priced to illiquid market prices, the banking system would continue to contract because lower marks would lead to less capital, which would lead to more selling and less liquidity, which would lead to lower prices. It was a vicious, and unstoppable, downward spiral. Private investment money dried up. Both TARP and QE were designed to fill the hole left by this ill-advised accounting rule.

To put this in perspective, AIG, the poster child for those who believe in the conventional wisdom, had a $550-billion portfolio of credit default swaps. When marked to the market in the winter of 2008–09, this portfolio had a massive hole (loss) of more than $100 billion. However, once the economy settled down, mark-to-market rules were relaxed and liquidity returned, this hole disappeared, prices increased, and the portfolio actually turned a profit.

It was the accounting rule itself that dried up liquidity in the winter of 2008/09. Even if cash was flowing, just the idea that it could stop pushed prices down. As a result, M2M accounting rules kept investors away because they threatened a vicious downward spiral in the financial system.

Milton Friedman explained in his book “The Great Contraction” how mark-to-market rules, not bad loans, caused bank failures in the early 1930s. In 1937, FDR eliminated M2M accounting. Between then and 2007, the economy has avoided panics and depressions. We do not believe this is a coincidence. Some argue that with no strict rules, banks can hide losses. But this is not true. A bad loan is a bad loan, and more than 2000 banks and S&L’s (sic) failed between 1983 and 1994 without having strict M2M rules.

At the hearing, Congress told the leadership of the Financial Accounting Standard Boards, in no uncertain terms, that they (FASB) needed to make significant changes to the mark-to-market accounting rules or Congress would step in.

The chart below shows the timeline of events related to TARP, QE, and the change in mark-to-market accounting rules. Anybody arguing it was TARP or QE that turned the tide during the financial crisis may need to take another look at the evidence.

A Disappointing Development for Income Investors

Unfortunately, our wishes for sound money and prudent monetary policy are the way we want the world to be, not the way the world operates.

Much to our dismay and most likely yours, the Fed looks set to cut rates again, and with those cuts come a more challenging environment for bond investors. This is a disappointing development. As of the fourth quarter of 2018, yields appeared to be rising and we hoped we were beginning to claw our way back to a more-normal yield environment.

You, like many investors, most likely look to your bond allocation as a way to generate income and reduce overall portfolio risk. This is certainly our strategy. Bonds provide a vital counterbalance to equity markets during times of stress. In 14 of the 15 years that the S&P 500 has declined, intermediate-term government bonds have advanced. A hypothetical portfolio invested 50% in intermediate-term Treasuries and 50% in the S&P 500 in 2008 would have declined 12% compared to a 37% loss for the S&P 500. Those approaching retirement who are investing in an all-stock portfolio are rolling the dice. A market down 37% one year before retiring requires a major downgrade in one’s retirement standard of living.

Bond Investing in a Low Interest Rate Environment

Bonds are “must own” even in a low-rate environment, but navigating the bond market when yields are in the tank is a tall order. The temptation is to reach for yield in low-grade bonds, but 10 years into an economic expansion is no time to pile on credit risk. What’s more, diving into the highest-yielding bonds with no regard for proper portfolio construction can backfire.

Do You Know Which Bonds Go Best With Stocks?

In the hypothetical example I provided above, if instead of purchasing Treasuries the investor purchased high-yield bonds, the 50-50 portfolio would have fallen 32% in 2008, with the bond portion cratering 26%.

High-yield bonds act more like stocks in a down market, which makes them a poor complement to an equity portfolio most of the time. There are, however, occasions when high-yield bonds make sense. And in this low interest rate environment, knowing when to take the risk in high-yield bonds and when not to take that risk can make a world of difference.

Over a Million Bonds to Choose From

Just like with stocks, not all bonds are created equal. There are over one million bonds in the Bloomberg database to choose from for the U.S. alone—all with varying terms, features, and risks.

Sifting through the database, let alone crafting a portfolio that generates a stream of interest income and the proper amount of counterbalancing power for every stage of the economic and credit cycle, is a whole other matter.

The Bonds We Are Buying for You

Our focus in fixed income at this stage of the cycle is a mix of Treasury securities and higher-grade corporates with a short-to-intermediate-term all-in maturity structure. We are extending maturities somewhat in corporates, and shortening somewhat in Treasuries. The longer-term corporates offer more compensation relative to government bonds than short-term corporates. The table below shows the spread or additional yield relative to Treasury bonds for four A-rated Merrill Lynch U.S. corporate bond indices. Note the longer the maturity the greater the yield above Treasuries.

Bonds That Bounce

Longer maturity bonds, if of a high-enough quality, also have the benefit of offering a greater counterweight to stock prices in a down market. The current economic expansion is now the longest on record. That doesn’t mean it can’t continue; but, at some point, this expansion like all other expansions before it, will end. And when it does, prices of risky assets are likely to fall sharply as they have in past recessions. Owning bonds that can bounce in such a scenario may moderate portfolio losses.

Quality Dividend-Payers

With a rate cut from the Fed all but guaranteed for July, dividend stocks are back in favor with some investors. Dividend stocks are always fashionable in our view, but Wall Street’s fickle sentiments can result in shifting relative performance for the dividend investor.

Dividend stocks become more attractive to some income investors when bond yields fall, but companies that pay the highest dividends may not be the best dividend stocks to own today. A decade of ultra-low interest rates has encouraged some companies to binge on debt. In an economic downturn, companies with weak balance sheets are more likely to cut their dividends than those with strong balance sheets.

Leuthold Group, an investment research firm, estimated that during the last recession and bear market, companies that cut their dividends underperformed those that didn’t by double digits. Leuthold also reports that over the last three decades, higher-quality dividend-payers have outperformed the S&P 500 by over four percentage points per annum, and did so with less volatility.

We don’t define quality in exactly the same way as Leuthold and are not interested in whether or not our equity portfolio is outperforming broader market indices. Our goal is to craft a portfolio of higher-quality dividend-payers with strong balance sheets that can provide you with a steady stream of income in good times and bad, to meet your personal financial goals. That is the very essence of successful investing.

Have a good month. As always, please call us at (888) 456-5444 if your financial situation has changed or if you have questions about your investment portfolio.

Warm regards,

Matthew A. Young
President and Chief Executive Officer

P.S. In a recent interview on Bloomberg TV, Rob Arnott from Research Affiliates explained, “If you count up the whole roster of FANMAG companies, that’s the Fang stocks plus Apple, plus Microsoft, their aggregate market value exceeds every market in the world except Japan and the U.S. That’s strange. That surmises that these companies will be world-straddling superpowers in their industries for the foreseeable future and will grow rapidly for the foreseeable future.” That is strange. The idea a few tech firms are worth more than the entire stock markets of the U.K., Germany, or China is nearly unbelievable.

P.P.S. Disney has been having an amazing month, breaking numerous film industry records. The most significant may be that Avengers: Endgame, the epic conclusion of a long arc in Disney’s Marvel Studios’ series of films, became the highest-grossing film of all time, unseating James Cameron’s Avatar. Also in July, a remake of The Lion King grossed $185 million in its opening weekend, breaking the record for July opening weekends, and for films rated PG. Those films followed major financial successes from a remake of Aladdin, Toy Story 4, and Spiderman: Far From Home. The House of Mouse is on a roll.

P.P.P.S. There’s something akin to a bank run happening at some bond ETFs. Despite the easily traded nature of ETFs, when the underlying assets they represent aren’t very liquid, redeeming shares can be a real problem. Bloomberg’s Rachel Evans and Emily Barrett report:

In other words, are exchange-traded funds the ATMs many managers believe them to be? Or will they fail to sell quickly enough and at sufficient prices during a crunch to fulfill customer demands?

“We’ve taken a bunch of semi-liquid securities, put that into an equity wrapper, said now you’re an equity and now you’re liquid,’’ said Deshpande, currently head of fixed income quantitative investments and research at T. Rowe Price Group Inc. “It doesn’t always work that way.’’


Mid-Year 2019 Update: Grading the Investment Environment

June 2019 Client Letter

The first half of 2019 is over, and the current investment environment appears more uncertain today than it was at this time last year. While it’s difficult to judge how the remainder of the year will play out, we’ve decided to hand out letter grades to some of the current storylines that may impact financial markets and your investment portfolio.  

Trade Negotiations

For the past two years, trade has been a focal point for markets. A trade deal with the Chinese that looked nearly complete a month or two ago has broken down. As a result, President Trump raised tariffs to 25% on $200 billion of goods imported from China. If the 25% tariff is left in place, it may have a greater impact on the U.S. than the 10% tariff put in place last year. The difference this year is China has not offset the higher rates by depreciating its currency.

Tariffs aren’t a pro-growth economic policy, but the president has used them effectively against China. The Chinese have taken advantage of the U.S. for years via currency manipulation, intellectual property theft, and subsidizing Chinese companies. Reform has been a long time coming. President Trump maintains that he remains open to a trade deal with China, but all indications suggest the deal must have teeth to win his support.

U.S. multinational firms are likely to feel the bite of Chinese tariffs, but the broader U.S. economy should be able to weather the storm.

The more concerning trade issue was President Trump’s threat to use tariffs as a tool against Mexico to achieve non-trade-related objectives. The tariffs were never instituted, but the president’s willingness to use trade as a weapon for non-economic means likely sent a chill down the spines of many global business CEOs. 
Trade policy grade: B

Iran

Events in the Persian Gulf are evolving rapidly. As of the time of my writing, Iran had shot down an American drone and President Trump had pulled back on a military response that would have taken 150 Irani lives. Then the president authorized a non-lethal cyber-attack on some of Iran’s military infrastructure. That was a wise choice by the president. A disproportionate response could have sent the entire region into war.

According to some reports, the president is engaged in a debate with National Security Advisor, John Bolton, over the idea of military engagement with Iran. Trump seems wisely inclined to avoid another quagmire in the Middle East, but Bolton presses for deeper engagement against Iran, which is something he has pursued for many years.

There could be few things more destabilizing to world economic markets than a war centered in the Persian Gulf.  War with Iran would likely lead to cross-Gulf attacks aimed at crude oil tankers leaving Saudi Arabia and other Gulf states. That could shut down seaborn oil shipments, and prices for oil would probably climb rapidly, hurting economic growth not only in the United States, but around the world. John Bolton’s grade on Iran: F

The Federal Reserve

Fed policy has been a major disappointment for income investors in 2019. In 2018, the Fed lifted short-term rates back above the rate of inflation for the first time in a decade and signaled more normalization of interest rates and the balance sheet were planned for 2019. Unfortunately, Powell & Co. caved as stock market volatility picked up late last year. The financial markets are not the economy, but the Dow Jones Industrial Average has become a leading indicator of Federal Reserve policy.

At its latest meeting, the Fed all but guaranteed a rate cut this summer, with another likely in the fall. With unemployment near a record low, GDP expanding at 3%-plus, the stock market near a record high, credit spreads at normal levels, and interest rates still far from restrictive, the Fed’s desire to cut rates is rather disturbing. The only upshot to the Fed as guardian of the stock market is that the equity side of your portfolio could have another tailwind at its back. Federal Reserve grade: F

U.S. Economy

The U.S. economy still looks pretty good. GDP for the first quarter came in above 3%. It was a low-quality 3% with inventory-build inflating the headline number, but some one-time factors also dragged down the growth rate. The consumer remains healthy with solid wage growth, low unemployment, and high consumer-confidence readings.

Some trouble spots in the economy bear watching, but nothing to panic over at this stage. As you can see in the following chart, the ISM Manufacturing Index has fallen to its lowest level in more than two years. Readings above 50 signal expansion in the manufacturing sector. Core capital-goods-orders growth has also fallen to its lowest level in more than two years, and CEO confidence has dropped sharply over the last year. Both measures have likely been impacted by trade policy uncertainty. But while CEOs of major companies are pessimistic, small businesses remain optimistic. U.S. economy grade: B

Yields and the Bond Market

The yield environment has gotten much more challenging over the last six to nine months as the Fed pivoted from signaling more rate hikes to rate cuts. In early November of last year, 10-year treasury notes offered a yield of 3.20% and 2-year treasury notes offered a yield of 2.80%. Today, 10-year treasury notes yield 1.98% and 2-year treasury notes yield 1.71%. Yields on corporate bonds have also fallen sharply since last year. For investors who own bonds, the drop in yield has provided a nice bump in price and solid total returns YTD. The problem with falling yields is  all of the income on bonds and principal on maturing bonds must be reinvested at today’s lower interest rates. Bond market grade: C

Small victories are the name of the game in fixed-income portfolio management today. One area of fixed-income markets where we see opportunity that probably won’t last is in certificates of deposits (CDs). Yup, we recently purchased FDIC insured bank CDs with yields 0.50% to 0.70% higher than those on comparable-maturity treasury notes. The FDIC is backed by the full-faith-and-credit pledge of the U.S. government. We were essentially able to purchase fixed-income securities in your account with the same credit risk as the risk in Treasury securities, but with a yield that was 0.50% to 0.70% higher. CDs are less liquid than Treasuries, but our intention is to hold to maturity. I won’t grade our CD purchase, but I hope you will agree with me in viewing this as a solid buy.  

Gold Market

You buy gold with the hope it declines in value. I first heard this from my dad many decades ago. Gold should be looked at as an insurance policy for your portfolio. We buy gold and hope its price goes down because often when gold is falling everything else in your portfolio is rising. How is gold doing today? Last December when the stock market cratered more than 9%, gold prices rose 4.90%—I would say gold is holding up its end of the bargain. Gold is also up in 2019, along with stocks and bonds. Our chart shows gold is on the verge of breaking out of a six-year trading range. YTD the SPDR® Goldshares fund is up almost 10%. Can’t ask for much more than that. Gold grade: A

Stock Market

After falling for the first full calendar year since 2008, the stock market has boomed YTD. The Federal Reserve’s flip-flop on monetary policy has been a big driver of stock prices and may continue to encourage risk-taking. Through the first half of the year, you are sitting on double-digit gains in your stocks. And this is from a stock portfolio about 20% less risky (as measured by standard deviation or beta) than the S&P 500. I don’t often talk about the lower volatility of the dividend stock portfolios we manage for you, but I want to share some arithmetic that highlights the benefits of an approach focused on downside protection.

The Asymmetry of Gains and Losses

Let’s compare two hypothetical portfolios. Portfolio A is an investment in the SPDR S&P 500 ETF. Portfolio B can be thought of as a low-risk stock portfolio—think high dividends, low relative volatility, and a beta or sensitivity to changes in the broader market of about 0.70. What that 0.70 beta means is that for every one-percentage-point increase in the S&P 500, the portfolio with a beta of 0.70 will increase by 0.70% (assuming 0% alpha and 0% short-rates). The same is true on the downside.

OK, stay with me. Let’s see how the portfolio performs through a full cycle. Say the S&P 500 returns 200% over a period of nine years. At the end of year nine, a $10,000 investment in Portfolio A (the S&P index fund) would be worth $30,000, and a $10,000 investment in Portfolio B would be worth $24,000. (0.70 beta times 200% equals 140% return.) 

Now let’s consider year 10, which we will assume is a big down-year for the market—a real big down-year with the S&P 500 plunging 50%. What is likely to happen to Portfolio A and Portfolio B?

The $30,000 value of Portfolio A will be cut in half, to $15,000. At the end of year 10, Portfolio A will be up 50% or 4.1% on a compounded annual return basis. Portfolio B is likely to lose 35% of its value in the year-10 bear market (0.70*-50% =-35%). At the end of year 10, Portfolio B will be worth $15,600, for a total return of 56% or a 4.5% compounded annual return. Yes, as surprising as it may be, Portfolio B ends up ahead of Portfolio A through the full market cycle, and it does so with less volatility and a smaller peak-to-trough decline. On the way up, things didn’t look so spectacular for the investor in Portfolio B; but on the way down, the lower-risk approach helped preserve capital.

While I can’t make any assurances that our common-stock portfolios will mimic the returns of Portfolio B in a downturn, I can say the beta of the portfolios we manage is much closer to the beta of Portfolio B than of Portfolio A. Stock market grade: A

 Why Our Approach Tends to Be Lower Risk

The portfolios we manage for clients tend to have lower risk because we invest in securities that pay dividends, and we focus on those that make regular annual dividend increases. We are also value conscious and favor businesses with durable competitive advantages. All of those attributes help limit losses during times of distress. Two dividend-payers included in many of our clients’ portfolios today are CVS and American Tower.

CVS

CVS is the largest pharmacy healthcare provider in the U.S.—with over 9,600 pharmacies and 1,100 walk-in medical clinics—and a leading pharmacy benefits manager, delivering services to 93 million plan members. Seventy-six percent of the U.S. population lives within five miles of a CVS pharmacy. CVS has a dedicated senior pharmacy care business serving more than one million patients each year. The number of Americans aged 65 and over is expected to increase by 18% over the next five years and 38% through 2025. This older demographic uses twice the prescriptions of the under-65 population. Increased utilization, combined with growth in specialty medications, is expected to fuel a 6% rise in prescription spending annually over the next decade. CVS is down year-to-date, but patient investors can enjoy the shares’ yield of over 3.75% while they wait for prices to rebound.

American Tower

American Tower’s business is basically just what it sounds like: towers, specifically those that hold communications equipment. American Tower leases its tower space to wireless communications companies. The business’s global portfolio comprises over 170,000 sites in the U.S., Mexico, most countries in South America, India, France, Germany, and some of Africa’s fast-growing cellular markets. American Tower went public in 1998 after being spun out of CBS/Viacom, when the media conglomerate took over American Radio, which had built American Tower as a subsidiary. In 2012 American Tower became a REIT and began paying regular dividends to shareholders. In every year afterward, American Tower’s board has increased dividend payments per share.

Have a good month. As always, please call us at (888) 456-5444 if your financial situation has changed or if you have questions about your investment portfolio.

Warm regards,


 Matthew A. Young
President and Chief Executive Officer