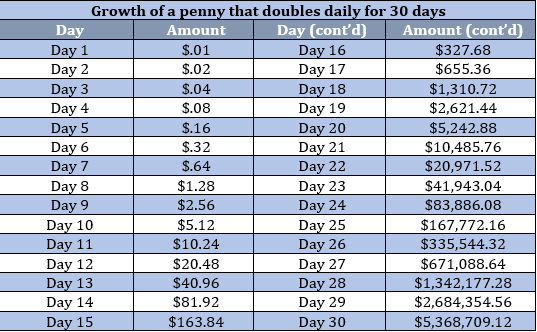
Would You Rather Have $1 Million or a Penny That Doubles Daily for 30 Days?
May 2019 Client Letter
Would You Rather Have $1 Million or a Penny That Doubles Daily for 30 Days?
Long-time client Tom recently emailed me the following question and answer. I have seen various versions of this in the past, and I always enjoy rereading it. This piece appears to have been from the company Grow, www.grow.acorns.com, which has partnered with CNBC to deliver educational features on developing successful money habits.
At first glance, it’s an easy choice: $1 million is a lot of money, and pennies aren’t even worth the copper they’re minted from. But if you pick the million dollar payout, you’d regret it.
Why?
On day 1, things are bleak: You’ve got one cent, and you’re down $999,999.99. It’s not even until day eight that you break $1. Half a month in, and you’re still only in the $100 range. Now you’re sweating, and if someone offered you $500,000 in exchange for your doubling penny, you might be tempted to take it.
But hold on, and the real magic happens in the last week of the month, when you go from a little more than $80,000 to $5 million.
In a world without magic pennies, who cares?
While the odds of getting 100-percent returns on anything are pretty slim (at least in the short term), there is a very real force at play that got that penny to more than $5.3 million in a month: compounding.
That’s when the interest or returns on your money start earning interest or returns of their own, and so on. In other words, anything you earn on top of the original amount of money is added to the base and reflected in all future returns. Let’s say you earn 10 percent on $100; that becomes $110. If you earn another 10 percent, your compounded return is $121, instead of just $120. Over time, those extra earnings add up.
We see compounding at work in both good and bad ways: It’s the reason why interest adds up so quickly on our credit card balances and how we can grow our money significantly through investing.
How can I get some of that?
By giving it time. If you’d cut and run and traded your magic penny for $500,000 in the middle of the month—or even sometime in the final week—you would have missed out on the majority of gains you’d eventually have.
The same goes for investing in stocks. Though you are very unlikely to double your money overnight, and there may be times when you’re down, the S&P 500-stock index has averaged nearly 10 percent annual returns over the past 90 years. That means money invested in a fund tracking the 500 index would have doubled in value about every 7.5 years. No magic required.
Three Takeaways from the $1 Million vs. 1 Penny Story
The first and most obvious takeaway is the success that can be had when you compound money. I wrote last month how the act of continually reinvesting dividends creates a snowball effect in which your initial investment grows exponentially. The hypothetical scenario above is compound interest on steroids. Obviously no investment can double daily for a month, but the example demonstrates the impressive power of compounding.
One of the main contributors to successful compounding is time. Early on, the results are not as robust. But over the years, things really kick in. In the example above, look at the massive gains made in the last several days.
The Double-Edged Sword of Compounding
Another takeaway is how compounding can be your enemy. Think of this as reverse compounding. Carrying a credit card balance guarantees a reverse compounding effect. I suspect not many of you carry a balance, but perhaps your kids or grandkids do. There may be times when carrying a balance is necessary, but it’s no way to build wealth and should be avoided whenever possible. Inflation is another example of reverse compounding. Annual price increases of goods and services slowly but surely make the grocery bill or nights out at your favorite restaurant much more expensive in future years. As time passes, the purchasing power of your savings begins to erode. This is one of the primary reasons we all invest—to keep pace with inflation. The negative impact of inflation is also why we focus so hard on buying stocks that raise their dividends annually. Those annual increases help us keep pace with rising costs.
Do You Have the Right Return Expectations?
The third takeaway has to do with return expectations. Keep your return expectations for stocks on the more modest side. Although the S&P 500-stock index has averaged nearly 10 percent annual returns over the last 90 years, not many of us have that much time. We have much shorter horizons with periods of market chaos and ongoing liquidity needs.
Would You Trade a 50% Loss for a 10% Return?
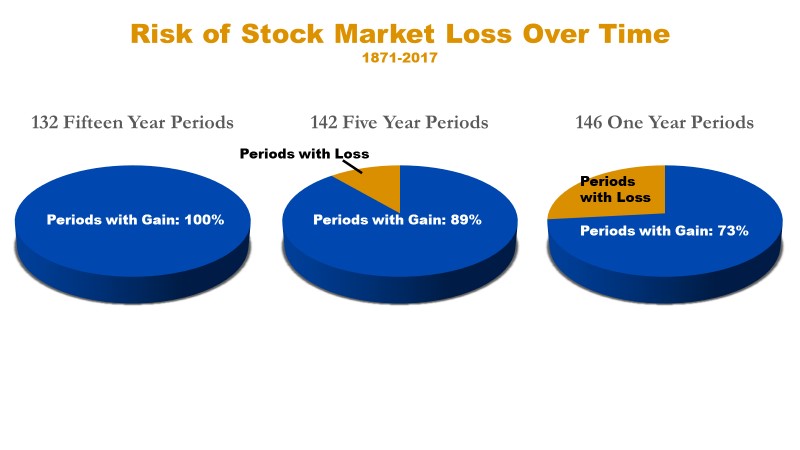
Over shorter time horizons, investors have to deal with significant market declines. According to a recent article at Marketwatch, stock market investors can expect to lose half or more of their money about every 18 years. Over the last two decades, there have been two 50%-plus loss episodes.
Losses of 20% or more (the accepted definition of a bear market) happen even more frequently. According to Marketwatch, a correction of at least 20% has occurred 15 times over the last 126 years—about once every eight and a half years.
A decision to go all-in on stocks in hopes of earning double-digit long-term returns presents significant risks to those looking to draw on their portfolio in the near term (retired and soon-to-be-retired investors). The following hypothetical example can illustrate this.
Too Much Risk Can Ruin a Retirement Plan
Assume an investor with a $1,000,000 portfolio retires today and plans to withdraw $40,000 per year from his portfolio during retirement. Sounds reasonable. But observing the historical 10% returns on stocks vs. the 2.5% return available in Treasury securities today, this investor reasons, the stock market is a better opportunity—so he goes all in.
Unfortunately for our hypothetical investor, in the first year of his retirement, the stock market plunges 50%. At the beginning of year two, he would be left with $460,000 ($500,000 loss plus the $40,000 distribution). Would he stick with this all-stock portfolio or liquidate in a panic?
Even if he stayed the course, the probability of his money lasting the balance of his retirement drops significantly. A $40,000 annual draw in year two of retirement would be equal to 8.7% of his $460,000 portfolio—more than double the initial 4% draw.
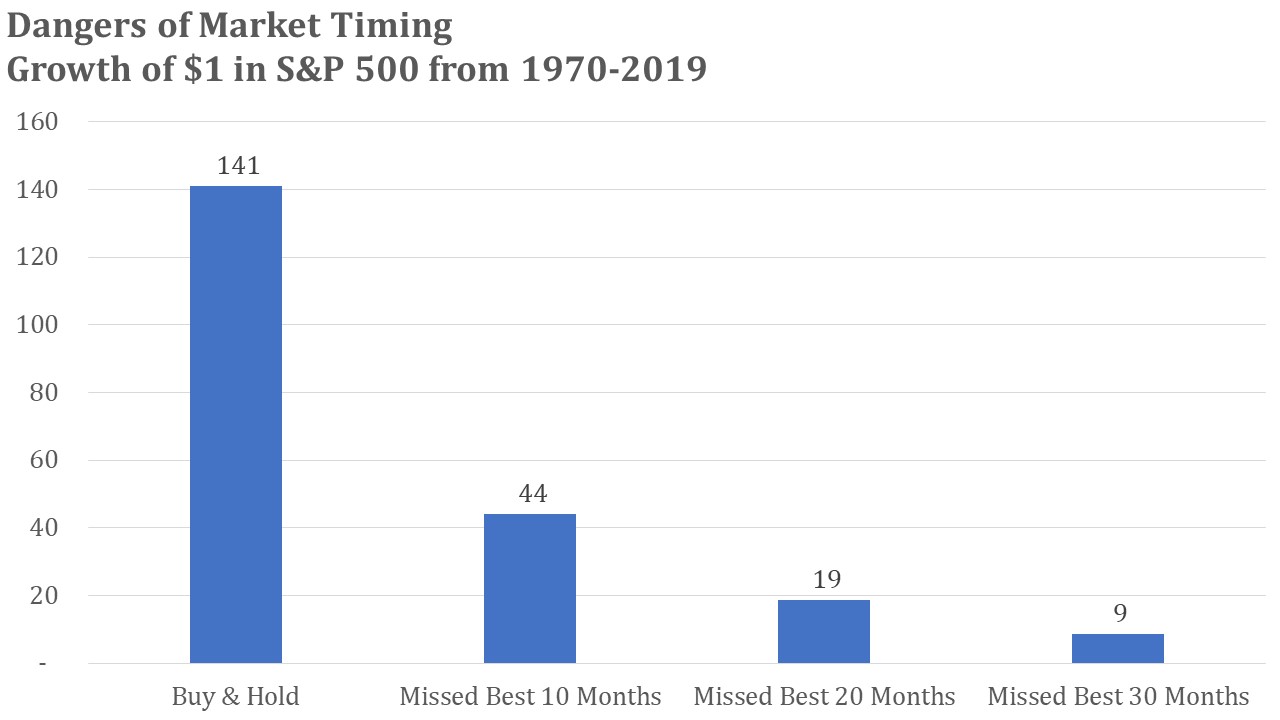
Even for those investors with time horizons of 20, 30, or 40 years, the prospect of earning a 10% average annual return is more difficult to achieve in practice than in theory. Studies by Dalbar and others have shown the tendency of many investors to make emotionally charged investment decisions that lead to poor outcomes. Last month my letter included a chart that showed how missing the best 10 months in the stock market over a 50-year period wreaked havoc on wealth accumulation.
The Worst Week of 2019
Until recently, 2019 has witnessed a serene market. Volatility was mild and returns were impressive. A breakdown in trade-talks between the U.S. and China has changed that dynamic. Stocks had their worst week of the year last week.
As the business and financial cycles mature, volatility may increase. It is during these periods that dividend stocks such as those included in our Retirement Compounders portfolios tend to become more desirable. The WSJ recently ran a piece highlighting the benefits of a dividend-focused investment approach.
While most investors buy dividend stocks for the steady income stream, that isn’t the only benefit these investments offer, financial experts say. Indeed, research shows that dividend stocks often outperform their non-dividend-paying counterparts over longer periods.
From 1958 through 2018, a portfolio with the top 20% of S&P 500 companies ranked by dividend yield and weighted by market capitalization outperformed the overall S&P 500 by 2.13 percentage points annually, according to Chicago-based Greenrock Research.
That’s partly because dividend payments account for a substantial portion of the stock market’s total return….
Dividends are inherently a relatively stable and important part of total return,” says Chris Litchfield, a retired hedge-fund manager who is now a private investor in Greenwich, Conn.
The S&P 500 currently yields 1.92%, and Mr. Carter says Lenox has been purchasing stocks with yields of about 4%. He and others stress that investors shouldn’t seek yields much higher than that. Extremely high yields often signal a company in trouble. Yield is calculated by dividing the annual dividend by the current stock price, so a very high yield could simply be a sign that the company’s share price has dropped sharply due to, say, weak earnings.
“High dividend yields often reflect that the dividend is uncertain and may be cut,” Mr. Litchfield says. “More money has been lost chasing yield than any other investment strategy.” A 6% yield or higher should give investors pause about pursuing a stock, he says.
Investors also want to make sure a company isn’t devoting too much capital to its dividends, because it might not be able to afford it without borrowing….
What investors should look for is stocks with a history of dividend increases, as this is generally a sign of financial strength. Research shows that companies that initiate or increase their dividend historically outperform other stocks, including other dividend stocks, and have done it with lower volatility than the other stocks, according to Michael Sheldon, chief investment officer at RDM Financial Group – HighTower, in Westport, Conn.
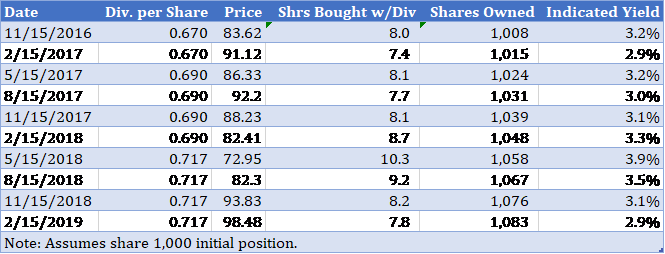
There is sound advice in the WSJ article. We also favor dividend-paying companies that regularly hike their dividend and eschew the highest yielders prone to dividend cuts in the portfolios we manage.
Hershey: Dividends Today and More Tomorrow
Hershey is a modest yielder, offering investors 2.26% today; but the dividend has compounded at 8.5% over the last five years, and we project mid-single-digit dividend growth over coming years. Hershey is ubiquitous in the U.S. Nearly everyone has eaten a Hershey’s bar or Kiss or a Reese’s Peanut Butter Cup. Founded by the famous Milton Hershey 125 years ago, Hershey today employs 18,000 people around the world. The company maintains over 80 brands, including Hershey’s, Reese’s, Hershey’s Kisses, Jolly Rancher, Almond Joy, Brookside, , Kit Kat®, Lancaster, Twizzlers, Whoppers and York . Hershey’s has moved beyond confectionary snacks with brands like SkinnyPop, Krave, and Popwell. Hershey’s brands are sold through a diverse variety of store channels including mass merchandisers, convenience stores, grocery stores, and others, with no channel representing more than 31% of its mix.
Union Pacific a Dividend Growth Stalwart
Union Pacific is another dividend growth stalwart. UNP has increased its dividend for 12 consecutive years at a compounded annual rate of over 20%. Union Pacific offers its customers “the most efficient, environmentally friendly transportation solutions available today.” The railroad’s network covers 23 states stretching along the entire West Coast, and heading eastward through America’s heartland, ultimately stretching alongside the Mississippi River from New Orleans northward, on into the Great Lakes region and Chicago. Union Pacific employs nearly 42,000 full-time employees on its trains and in its vast network of distribution centers, intermodal terminals, ports and border crossings. The employees navigate over 8,000 locomotives pulling 62,200 freight cars across more than 32,200 miles of track.
A 56-Year Record of Dividend Success
On Dutch Street, in the bustling New York City of 1806, William Colgate opened a soap and candle “manufactory.” Soon the factory would be joined by a starch factory in Jersey City. After Colgate’s death, his son Samuel kept the business going. He expanded the business into new areas, including toothpaste in 1896. Today, after many mergers and much innovation, the Colgate-Palmolive company is celebrating over 200 years of history and its success in over 200 countries. The company sells its products to hundreds of millions of customers worldwide. Colgate shares yield 2.42%. Colgate has increased its dividend for 56 consecutive years.
Have a good month. As always, please call us at (888) 456-5444 if your financial situation has changed or if you have questions about your investment portfolio.
Warm regards,

Matthew A. Young
President and Chief Executive Officer
P.S. “The gift that keeps on giving to low-tax states.” That’s how The Wall Street Journal’s editorial board described Connecticut in a May 7 piece titled “Connecticut’s Tax Roulette.” Politicians in the state want to add a 2% surcharge to capital gains earned by those residents with the highest incomes. For years Connecticut attracted hedge fund managers and bankers from New York looking for lower taxes. They were a major benefit to the Nutmeg State’s economy, and now Hartford is turning them into an ATM from which to fund poorly managed policies. In CNBC’s annual state business rankings, Connecticut ranked 47th for infrastructure, 46th for cost of doing business, and 45th for economy.
P.P.S. Connecticut isn’t the only place capital gains are being targeted. Senator Ron Wyden (D-OR) is using his perch as the ranking member on the Senate’s Committee on Finance to propose taxing unrealized gains in investment assets every year at income tax rates. In other words, if Wyden’s proposal is passed, and you own a stock which had its price increase, even if you don’t sell it, you’ll need to pay taxes on that gain. As Richard and Gabriel Rubin write, implementing such a plan would necessitate the “need to figure out how to value complex assets, handle declines in value, deal with people without enough cash to pay the tax and address illiquid investments such as closely held businesses and real estate.” Wyden’s proposal isn’t going anywhere in the Senate soon, but it opens the door for similar proposals in the future.
P.P.P.S. Recently, the Defense Department released a threat assessment of China’s economic and military capabilities. Front and center in the report is the $50 billion of damage China does to America’s economy each year. Andrew Erickson reports for The National Interest , “In keeping with the Trump Administration’s outlook and priorities, there is greater emphasis on economic issues than in earlier years of the report. This year’s iteration highlights the U.S. Trade Representative’s conclusion that PRC government policies cause ‘harm to the U.S. economy of at least $50 billion per year.’”
P.P.P.P.S. We recently updated both Part 2A and Part 2B of our Form ADV as part of our annual filing with the SEC. This document provides information about the qualifications and business practices of Richard C. Young & Co., Ltd. If you would like a free copy of the updated document, please contact us at (401) 849-2137 or email cstack@younginvestments.com. Since the document was last updated in March 2018 there have been no material changes.