What’s Going On With Interest Rates?

June 2018 Client Letter

In my January letter, I commented on how it would not be a surprise to see the Federal Reserve raise the Federal Funds rate four times in 2018. When the year started, the Fed indicated it would look to target a total of three hikes this year. In mid-June, as expected, the Fed raised rates for a second time in 2018, bringing the Fed Funds target rate up to 2%. The two additional rate hikes should come in September and December.

How many more times will the Fed raise interest rates before stopping? Many variables go into the Fed’s interest rate decisions; but, historically, short-term interest rates have been as much as 1.5 percentage points higher than the rate of inflation. With today’s Fed Funds rate at 2% and consumer prices rising annually at about 2.2% (as measured by core CPI), the Fed still has significant room to raise rates without overdoing it, even assuming moderate economic growth.

During an economic boom like the one we are witnessing today, the Fed could raise rates higher than 1.5 percentage points above inflation. When the economy gains strength, the Fed gets concerned about overheating and inflation. By raising rates, the Fed increases the cost of money, which slowly but surely feeds its way through the economy and dampens the pace of growth. By example, when short-term rates increase, automobile loan rates rise and consumers buy fewer or less expensive cars. When business loan rates increase, fewer investment projects are undertaken, and when mortgage rates rise, activity and prices in the real estate market tend to slow.

Today’s economy is the strongest we have experienced in years. One of our favorite economic releases is the NFIB small business survey. Small businesses are the life-blood of the American economy. Most new jobs are created by small businesses and almost all big businesses were once small businesses.

The most recent edition of the NFIB small business survey came with welcome news for employees across the country. The highest net number of firms in over three decades are raising pay. A net 35% of small businesses polled report raising compensation over the last three months. This job market is cooking.

You can see it in the Labor department’s jobs numbers as well. The unemployment rate matched a more-than-four-decade low in May. And for the first time on record, there are more job openings than unemployed Americans to fill them.

Job vacancies rose to a fresh record of 6.7 million in April, according to the Job Openings and Labor Turnover Survey (JOLTS), released by the Labor Department. More importantly, upward revisions to the prior month made it the first time in government data going back to 2000 that job openings exceeded the number of unemployed. That gap of 48,000 in March grew to 352,000 in April and is poised to keep widening, as the number of unemployed has already dropped further in May.

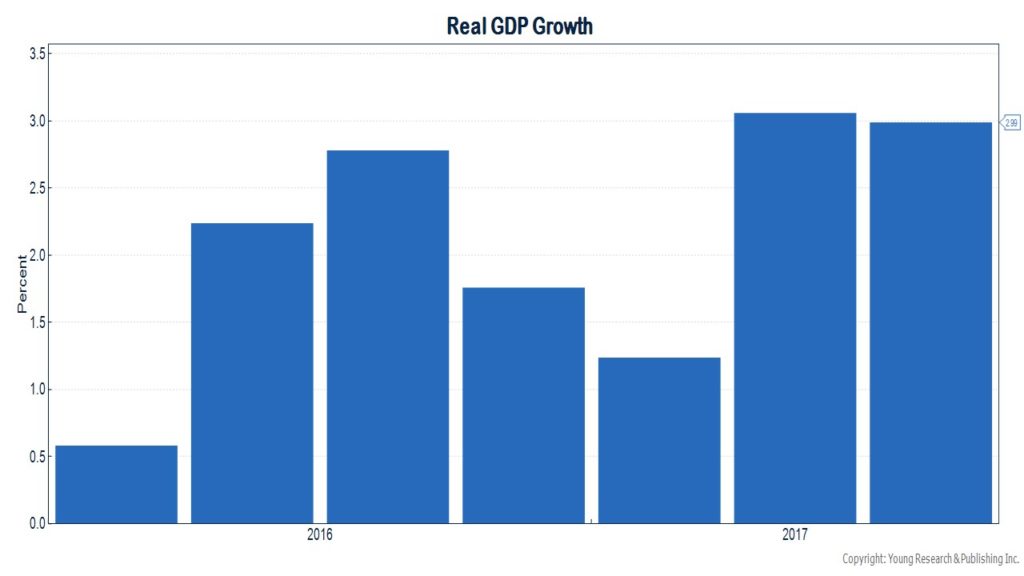
Business investment and new building permits (both leading indicators) continue to gain strength even while interest rates rise. Growth in retail sales has accelerated in recent months, and second-quarter GDP growth may come in at a blistering 4.7%—a rather impressive feat more than nine years into an economic expansion.

Given the strength of the economy and the still-low level of short-term interest rates, we would like to see the Federal Reserve raise rates at least another 1.50%. And the sooner the better.

Bonds are a necessary component of a balanced portfolio, but most investors would agree they aren’t as sexy as stocks. When is the last time you got a bond tip at a cocktail party or heard about the exciting profits your golfing buddies are making in bonds? Bonds can appear dull and complex.

So when you read or hear about interest rates impacting bond prices, it is useful to recognize what interest rate is being discussed and how different interest-rate changes impact the prices of the bonds you hold in your own portfolio.

Short-term and long-term rates are not the same. When I write about the Federal Reserve raising the Federal Funds rate, I am referring to short-term interest rates. The Federal Funds rate is an overnight rate earned and paid by and to banks. The Fed directly controls short-term interest rates, but only indirectly can it influence long-term interest rates.

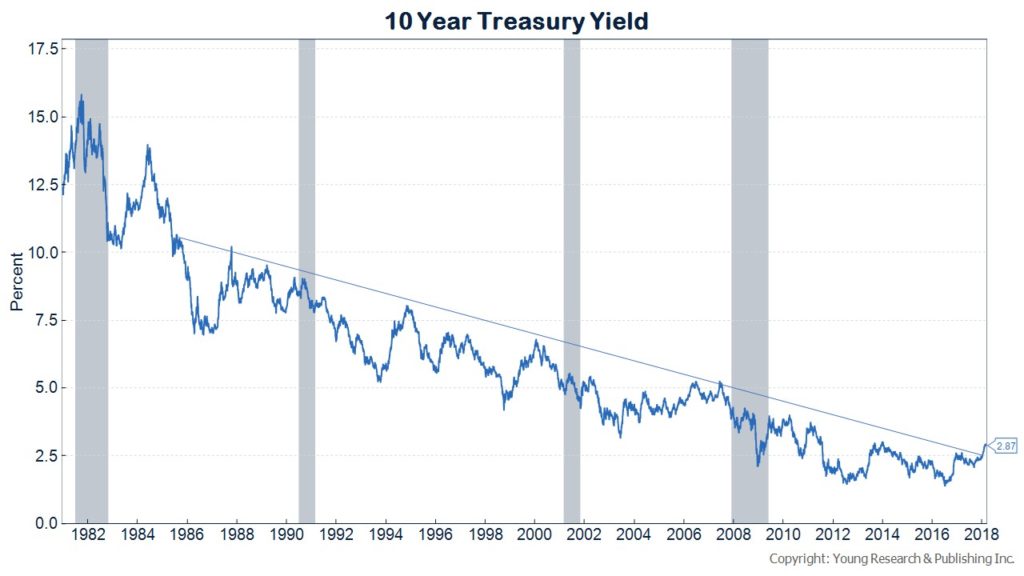
When the Fed increases short-term interest rates, there is no guarantee long-term interest rates will rise as much as short rates, or even at all. The Fed’s first interest-rate increase during the current cycle was in December of 2015. At the time, the 10-year Treasury rate was about 2.25%. Since early December of 2015, the Fed has increased short-term interest rates by 1.75 percentage points. During this period, long-term interest rates have increased only 0.65 percentage points.

Short-term interest rates are important for asset markets and the economy, but long-term interest rates are where the rubber meets the road. Asset prices and economic growth tend to be more sensitive to long-term interest rates.

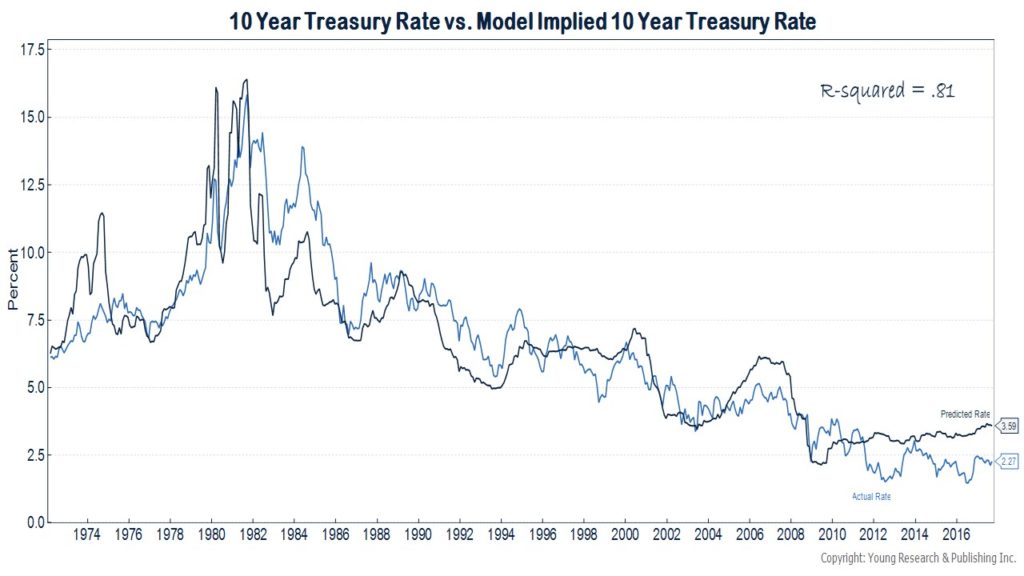
We keep a close eye on the 10-year Treasury rate. It broke above 3% earlier this year but has been stuck around 2.9% since. The still-low level of long-term interest rates is at odds with strong economic growth and rising short-term interest rates. Our back of the envelope model for long-term interest rates indicates the 10-year rate should be north of 4% today.

What is holding down long-term interest rates? There are many theories as to why long-term rates remain low in the face of strong economic growth, but we believe global central bank bond-buying has played a leading role. The Fed has been winding down the size of its balance sheet for almost a year, but the pace has been glacial, and European Central Bank and Bank of Japan bond-buying have thus far offset the impact of the wind-down. However, as the year progresses, the ECB will begin winding down its bond-buying program, and the Fed’s balance sheet should begin to shrink at a faster pace. We look for the combination of both factors to push longer-term interest rates higher.

Will the Bond Bubble Crush You?

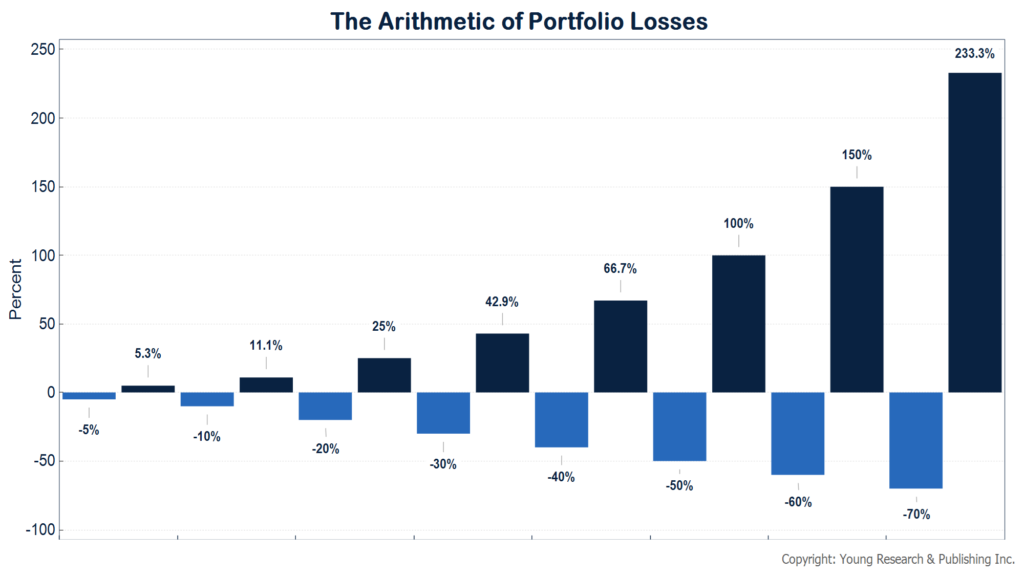
The financial press, and even some pundits who should know better, like to make blanket statements about the impact of rising rates on bonds. “There is a bond bubble that will crush all investors who own bonds” are common words of wisdom from this crowd. Some bond investors will indeed get crushed. By example, if you own 30-year zero coupon U.S. Treasury bonds, a one percentage point increase in the long bond rate will result in about a 30% drop in the price of that bond. That is one ugly return. But compare that to getting crushed in short-term bonds. Since September of last year, the yield on the Bloomberg Barclay’s 3-5 Year Corporate Bond index rose by 1.3 percentage points, but the index is down just 1.8%. Oh, the horror! That is one of the weaker periods for the index this century; but if that is getting crushed, there is no reason to panic. And if rates increased another 1.3 percentage points over the next year, we would expect 3-to-5-year corporates to end the year flat on a total return basis. With rates now higher, there is more interest income to cushion the blow of a drop in bond prices.

Our strategy in corporates is to roll maturing bonds into higher-yielding and longer-maturity bonds as interest rates rise. That isn’t something that is possible with bond mutual funds.

Saying Goodbye to Vanguard GNMA

With interest rates now at more reasonable levels, we have decided to close our position in the Vanguard GNMA fund. Vanguard GNMA has been fine, but we decided to move the position into Treasuries with maturities of two, four, and five years. With rates on Treasuries and GNMAs now more comparable, we like the increased flexibility Treasuries afford, as well as the better counterbalancing properties of Treasuries.

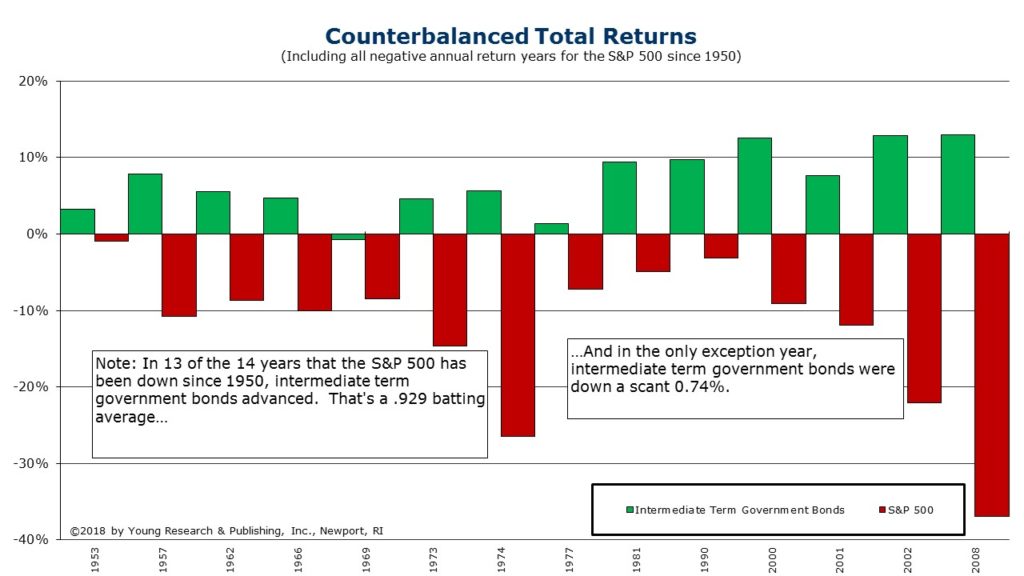
Treasuries tend to rise more than GNMA bonds when stocks fall. Since March of 1976, the average annualized return of the Bloomberg Barclay’s Intermediate-term Treasury index in down months for the S&P 500 is 5.74% compared to 2.9% for the Bloomberg Barclay’s GNMA index—a difference of 2.84 percentage points. In months when the S&P 500 was down 3% or more, intermediate-term Treasuries outperformed by an annualized 5 percentage points.

Some of the other advantages of Treasuries over GNMAs are that Treasuries are free of state and local tax, whereas GNMA bonds are not. There are no mutual fund expense ratios to worry about with Treasury notes, and a Treasury note portfolio provides more flexibility to better manage opportunities and risks in the bond market throughout the business cycle.

Portfolio Diversification

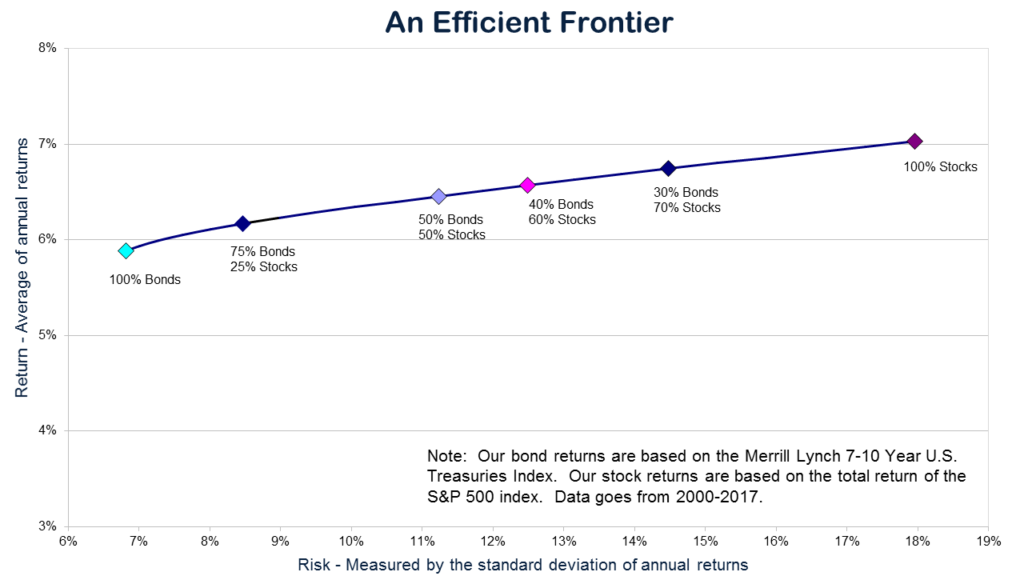
Counterbalancing is at the core of portfolio diversification. Owning assets that don’t move in lockstep tends to lower risk and/or provide a greater return for the same level of risk. Our Efficient Frontier chart below shows the trade-off between risk and return for different balanced portfolios. The returns are for this century and assume annual rebalancing. Moving from left to right, an all-bond portfolio provided the least amount of risk, but also the lowest return. The all-stock portfolio provided the highest return, but it also had the highest amount of risk. Compared to a portfolio with 30% in fixed income and 70% in stocks, the all-stock portfolio earned an additional 0.29% per year, but with 30% more volatility. Retired investors and those approaching retirement may be best served by portfolios inside the two extremes.

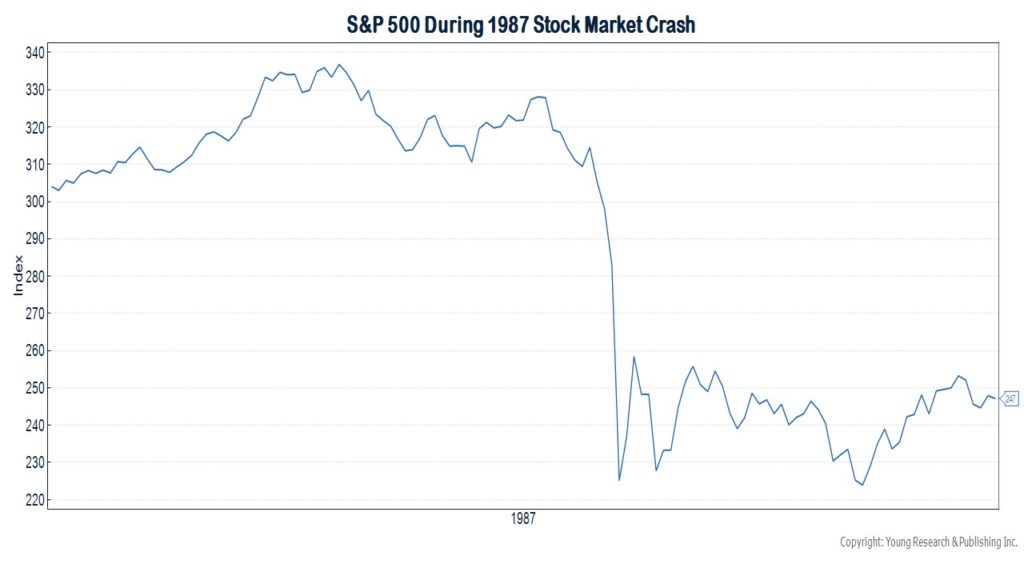
It is true that if you shorten the time period to include only the last 10 years, an all-stock portfolio may have delivered a much better return than a balanced portfolio, but don’t forget that markets go through cycles. And the stock market cycles this century have been volatile. From peak to trough, the S&P 500 has fallen by more than 50% twice.

Cycles are also part of the global equity market landscape. Earlier this month The WSJ ran a headline asking if value investors face an existential crisis.

Previously, The New York Times featured a piece on the difficulties of value investing:

Think value investors have it tough these days? Just ask William J. Nasgovitz, portfolio manager of the Heartland Value fund, whose own mother recently tried to pull her money out of the fund.

“My mom wanted to buy Walgreen at 50 times earnings and sell out of the value fund after making six times her money,” Mr. Nasgovitz said. “It’s a great company, but it isn’t worth 50 times earnings.”

He eventually persuaded his mother to stay put. Recently, however, his son Will admitted to buying an index fund. “Another little dagger,” Mr. Nasgovitz said.

And there are many more. “Clients, consultants, and advisers are all tired of talking value,” he said. “They want action.”

“Action” in this case really means one thing: big growth companies and the funds that invest in them.…

But that has lately brought grief for their shareholders, as stocks relatively cheap by traditional measures continue to be clobbered by the big growth companies that have paced the enormous run-up in the Standard & Poor’s 500-stock index….

Some managers think that with the advent of a new, technology-driven economy—where economic cycles are far longer than they have been in the past—it could be many years before value stocks return to favor for an appreciable period…

Growth stocks were driven up further, they say, by what is sometimes called ”closet indexing”—the purchase of the largest-capitalization stocks in, say, the S.& P. by active fund managers. Some managers moved into these big growth stocks simply because they grew tired of missing out on the market’s momentum…

“As always, when a strong trend has been in place for a few years, there is no lack of people who rationalize why what has been true will continue to be true—in other words, that value, and particularly small value, will never come back,” Mr. Eveillard said [our emphasis added]. “If I thought so, I would retire.”

You may recognize that The NY Times article was written almost two decades ago, in April of 1999.

What motivated The NY Times to write a piece like that near the height of the dotcom bubble? We would assume it was the same thing that motivated The WSJ to write a similar piece early this month—a misguided focus on relative performance. Investors who abandoned value in April of 1999 to chase growth looked smart for a few months; but over the subsequent seven years, value shares crushed growth shares. Over the long run, we believe a value-conscious approach is likely to beat a strategy based on glitz and glamour.

Have a good month. As always, please call us at (888) 456-5444 if your financial situation has changed or if you have questions about your investment portfolio.

Warm regards,

Matthew A. Young
President and Chief Executive Officer

P.S. Amazon has an amazing business, but the retail operation so many Americans are familiar with isn’t it. There is, of course, no denying Amazon is one of the most dominant forces the retail world has seen in decades. But from a profitability perspective, Amazon’s retail operation is marginal. Over the last 12 months, Amazon retail has made only a single cent in operating income for every $1,000 in sales. That translates to $188 million in operating income on $174 billion in sales.

Contrast that with Amazon Web Services, Amazon’s cloud business. Web services made $4.8 billion in operating income on just $19.2 billion in sales. Only 4% of Amazon’s operating income over the last year came from the retail business. The other 96% came from Amazon Web services.

Investors buying Amazon because it is a dominant e-commerce business might want to reconsider their thesis. Based on its profitability, Amazon is first and foremost a technology business. And a damn pricey one. Amazon shares trade at 265X earnings.

P.P.S. According to the annual Rich States, Poor States report, over the last decade, 3.5 million Americans have moved from the country’s highest-tax states to its lowest-tax states. Arthur Laffer and Stephen Moore, who both worked on the report, told readers of The Wall Street Journal in an April op-ed that the 2017 tax reform will probably accelerate that migration. While 90% of taxpayers won’t be affected by the law’s changes, it will hit the wealthy in high-tax states particularly hard because their state and local income taxes will no longer be deductible at the federal level. Laffer and Moore say this will be a boon for low-income tax states such as Texas and Florida, popular destinations for tax refugees. They write:

Since 2007 Texas and Florida (with no income tax) have gained 1.4 million and 850,000 residents, respectively, from other states. California and New York have jointly lost more than 2.2 million residents. Our analysis of IRS data on tax returns shows that in the past three years alone, Texas and Florida have gained a net $50 billion in income and purchasing power from other states, while California and New York have surrendered a net $23 billion.
Now that the SALT subsidy is gone, how bad will it get for high-tax blue states? Very bad. We estimate, based on the historical relationship between tax rates and migration patterns, that both California and New York will lose on net about 800,000 residents over the next three years—roughly twice the number that left from 2014-16. Our calculations suggest that Connecticut, New Jersey and Minnesota combined will hemorrhage another roughly 500,000 people in the same period.


Good Economy, Strong Earnings, But Markets Struggle

May 2018 Client Letter

The unemployment rate matched an almost five-decade low of 3.8% in May. The only other time in the last 48 years unemployment has been this low was at the height of the dotcom bubble. We are experiencing a best-of-the-best labor market. Economic growth remains strong as well. According to the Federal Reserve Bank of Atlanta, GDP is forecasted to rise more than 4% in the second quarter. Industrial production is again humming, and corporate earnings are booming. Bloomberg data shows that, with 97% of S&P 500 companies reporting, earnings are up over 23% from the first quarter of last year.

It would be difficult to find an economic and earnings growth environment much better than we have today. And yet, on an annualized basis, the Dow and the S&P 500 are on pace for returns of -1% and +3.55%, respectively.

While the modest performance for stocks over the first five months of the year may seem at odds with the economic backdrop, it isn’t so shocking, in our view. Depending on which benchmark you use, this is either the second- or third-longest bull market on record. After nine years of a bull market, stocks are far from cheap, judging by a variety of metrics. And with the ultra-loose monetary policy that has helped extend this bull market past its natural expiration date coming to an end, further gains become more difficult.

Markets are Forward-Looking

What’s to come in six to twelve months matters more to markets than the headlines of yesterday. Just as stocks rose sharply last year in anticipation of faster growth, they may be languishing today as investors look for growth to slow. Rising interest rates, economic expansion that is likely in the late innings, potential political risk in November, some choppiness in global growth, and trade risk may be among the concerns holding markets back.

Dividends Account for 45% of Total Returns

That’s not a positive forecast for stocks over the balance of the year. Short-term forecasts are unreliable. We leave the monthly and quarterly predictions to the traders and speculators. We spend our efforts thinking about the long run and the factors affecting long-term returns. One of those factors is dividends. Our projections about the future focus on dividends and dividend growth. Areas where long-term predictability and accuracy are much greater.

Dividends and the reinvestment of dividends account for a significant portion of the return on stocks. Even during the last 20 years, when the dividend payment has fallen out of favor in many corporate boardrooms, dividends and their reinvestment have accounted for 45% of the total return on stocks.

Two companies we own in many client portfolios, Verizon and United Technologies, recognize the value of dividends:

Like all telephone companies in America, Verizon’s history starts in July of 1877 when Alexander Graham Bell formed the Bell Telephone Company. Soon Bell telephone systems were popping up in all the major cities in America and were linked by Bell’s long-distance calling operation. In 1996 the FCC deregulated local markets, allowing competition and setting the stage for what would become Verizon.

In its relatively short history, Verizon has been a pioneer of communications technology and infrastructure in America. Verizon introduced America’s first 3G network in 2002, started building a fiber-optic Internet system known as FiOS in 2004, and deployed America’s first large-scale 4G LTE network in 2010.

Today Verizon is continuing to work on its network by rolling out 5G wireless technology. Verizon says the 5G system has “about 50 times the throughput of current 4G LTE, latency in the single milliseconds, and the ability to handle exponentially more Internet-connected devices to accommodate the expected explosion of the Internet of Everything.”

Verizon and its predecessors have paid investors dividends each year since 1984. The company is also a Mergent dividend-achiever that has been raising its dividend each year for 12 consecutive years. Verizon shares yield 4.85% today.

In 1934, United Technologies was incorporated with a mission focused mainly on building products for the aerospace industry. Today the company owns a broad variety of businesses, including Otis, the world’s largest elevator and escalator manufacturer; UTC Climate, Controls and Security, the leading provider of heating, ventilating, air conditioning (HVAC), refrigeration, fire, security, and building automation products; Pratt & Whitney, a leading global provider of technologically advanced aerospace products among the world’s leading suppliers of aircraft engines for the commercial, military, business jet, and general aviation markets; and UTC Aerospace Systems, a leading global provider of technologically advanced aerospace products.

Among United Technologies’ better-known products are the F135 engine, which powers the F-35 Lightning II jet fighter, Carrier heating and cooling equipment, Kidde fire alarms, and Otis’s elevators and escalators. Though passengers may not know it, they are surrounded by UTC Aerospace Systems parts on nearly every large airplane they board.

Worldwide trends are driving United Technologies’ businesses. Urbanization, a growing middle class, and increasing commercial air travel are powerful tailwinds for the company. Fewer than 20% of the world’s population has flown in an airplane. Soon many more will be wealthy enough to afford that luxury. There are presently around 29,000 commercial aircraft in operation. By 2030 that number is projected to rise to 47,000.

The board at United Technologies is focused on returning value to shareholders. The conglomerate has paid shareholders dividends for over 80 years straight. For the last 24 years, United Technologies has raised its dividend each year. That includes through the dotcom bust and the financial crisis.

Not All Dividend-Payers on Solid Ground

Many investors focus primarily on yield when buying dividend stocks, but we consider a broader set of factors. The highest-yielding dividend stocks are often not the best dividend stocks. Why not? Outsized dividend yields may be a signal of an unsustainable dividend. In fact, if you invested $10,000 in the highest-yielding 30 stocks in the Russell 3,000 Index (top 3,000 U.S. stocks by market cap) in 2003 and rebalanced that portfolio annually, you would have $15,900 today. That same $10,000 invested in a Russell 3,000 Index fund 15 years ago would be worth about $40,000 today.

That is not to say that high-dividend yields always mean a dividend cut is imminent. There are qualitative and quantitative factors that should be evaluated to foretell the sustainability of dividend payments. We seek to strike the right balance between yield and dividend reliability when crafting portfolios.

Tweaking the Portfolio

Last month the Wall Street Journal profiled a report on retirement. Among suggestions from the interviewed professionals: Go stodgy with stocks and look outside the U.S. This group also advised a diversified approach and caution on rate-sensitive stocks. Our Retirement Compounders® program checks many of the boxes advised in the piece.

For starters, stodgy is right in our wheelhouse. Our Retirement Compounders® program favors established businesses in slower-growing industries with high barriers to entry, above-average dividend yields, and good dividend-growth prospects. We don’t swing for the fences. A company that pays a 3% yield today and increases that dividend at 5% annually for nine years will likely double your money. For investors in or nearing retirement, it doesn’t get much better than that.

Diversification is the cornerstone of proper portfolio management, but many investors over-diversify. Owning numerous large-capitalization exchanged-traded funds or mutual funds is probably overkill. Our equity portfolios are primarily made up of individual common stocks. We build diversified common-stock portfolios but don’t own so many positions that our best ideas become too diluted to make a difference. Our thought used to be that for a U.S.-only portfolio, 32 stocks would provide about as much diversification as one needed. That number has risen slightly over time. Today we build globally diversified (not U.S.-only) portfolios that include 40 to 50 stocks—enough positions to provide good diversification, but not so many as to over-diversify.

Global Investing

The international component of our common-stock portfolios tends to fluctuate between a quarter and a third of the portfolio. Many foreign markets have lagged U.S. markets over the last five years and offer values that are more reasonable than they are in the U.S. Foreign stocks also tend to have dividend yields that are much greater than those on U.S. stocks.

Interest-Sensitive Stocks

The cautionary warning from the Wall Street Journal on interest-sensitive stocks has been an ongoing challenge for dividend-investors over recent years. The Federal Reserve’s insistence on holding short-term interest rates at zero and pushing long rates down drove many investors into dividend-paying shares to earn income. This reach-for-yield dynamic has led to a greatly increased correlation between dividend stocks and interest rates. When rates rise, dividend stocks fall, and when rates fall, dividend stocks rise. While dividend shares have always had some sensitivity to rates, the effect has been amplified by orders of magnitude in recent years. Unfortunately, it is a dynamic that dividend investors may have to endure for a bit longer; but as rates normalize, we expect the correlation between rates and dividend stocks to lessen.

Emerging Markets

After a strong showing in 2017, emerging markets have become the favored asset class of many. EM stocks have been out of favor for so long that some investors are now anticipating a big payback period. That forecast may eventually come true, but we have remained cautious on emerging markets; they tend to run into trouble during periods of rising U.S. interest rates. While not all emerging markets are the same, some have stumbled as U.S. interest rates have risen. The currency channel is one of the big sources of volatility in emerging markets. The Turkish lira, Argentine peso, Brazilian real, and Russian ruble are all down between 10% and 30% YTD. The broader JP Morgan Emerging Market Currency Index is down 5% YTD and over 8% from its high earlier this year.


Falling currency values vis-à-vis the U.S. dollar has hurt investors’ returns in emerging market stocks. The MSCI Emerging Markets Latin America Index is down 8% YTD, and the MSCI Emerging Markets Europe Index is down 7% on the year.

Emerging markets are an area we have owned for clients in the past and may own again in the future, but the risk is often higher, and so we demand much higher prospective returns. Today we see more risk than reward in many emerging markets. Rising interest rates in the U.S. may continue to wreak havoc on emerging markets, especially in those countries with lots of foreign-currency-denominated debt and big current-account deficits.

Have a good month. As always, please call us at (888) 456-5444 if your financial situation has changed or if you have questions about your investment portfolio.

Warm regards,


Matthew A. Young

President and Chief Executive Officer

P.S. Last year, The Brookings Institute featured an article that began, “As released Thursday, President Trump’s ‘America First’ budget blueprint would actually put U.S. manufacturers and the national economy well behind their global peers.” The piece ended with “Trump’s budget, like much of his rhetoric, is fundamentally backward-looking. It attempts to support a 21st century economy with 20th century tools and ideas.”

Fortunately for America, the Brookings Institute appears to be off base—at least according to a recent report from the IMD Competitiveness Center in Switzerland that annually ranks countries by over 200 different factors to develop its global competitiveness rankings. For 2018, the U.S. improved three spots in the ranking and returned to first place. According to IMD, “The return of the United States to the top is driven by its strength in economic performance (1st place) and infrastructure (1st place).”

P.P.S. Not all bonds, and not all bond funds, are created equally. There are many varied degrees of risk in the bond market. You can take on maturity risk, credit risk, currency risk, political risk, prepayment risk, and extension risk, to name a few. Take a fund like famed Bond Fund Manager Bill Gross’s Janus Unconstrained Bond Fund. This fund can invest in a wide array of securities, including derivatives and foreign bonds. The fund can also take long and short positions in bonds. During a recent bout of political turmoil in Italy, the Janus Unconstrained fund was pummeled—falling by over 3% in a single day. Year-to-date the fund is down over 6%. A wrong-way bet on the spread between German and U.S. bonds cost the Janus fund dearly.

P.P.P.S. Our focus in fixed-income markets is on individual domestic bonds. Government bonds, government-backed mortgages, and investment-grade corporates with short-to-intermediate-term maturities are where we are concentrating purchases today. Our bond portfolio is designed to stabilize the volatility of stocks in our clients’ portfolios. There is minimal, if any, currency and political risk in our core fixed-income portfolios. Currency is not a risk we want here. Currency volatility can defeat the purpose of a fixed-income investment.

We do, as many of you know, venture overseas into foreign-currency-denominated bonds, but these are purchased strictly as a component of our currency portfolio and counted as higher-risk assets.


Predictability and Consistency

April 2018 Client Letter

Recently, I spoke to a long-time client who has been with Richard C. Young & Co., Ltd. since August 1995. When we have telephone conversations to review his portfolio, there is often no need for me to schedule the appointment on my calendar. That’s because for the past 12 years we’ve spoken on a Friday at 10:30 a.m. Naples, Florida, time and 7:30 a.m. Orange County, California, time.

While our phone appointments are both predictable and consistent, the markets have been anything but. During our last conversation, we discussed how 2018 is becoming a much different year than 2017. Last year, markets were consistent in that they were mostly up. But certainly not predictable, in that many investors expected volatility that never materialized. By example, in 2017 the Dow Jones Industrial Average didn’t experience a correction of even 3% for the entire year. Additionally, from 2017 to 2018, stocks lasted 404 days without a decline of even 5%.

Last year was an unusually calm environment and one we don’t expect will be repeated. While it’s nearly impossible to predict how the market will move, here is how it has historically behaved.

• At least five 2% daily dips per year
• About three 5% corrections each year
• One 10% or greater correction per year
• One 30% drawdown (decline from peak to trough) every five years

For the remainder of this year, we expect an environment more like early 2018 than 2017. Excess liquidity is draining out of the global financial system (albeit slowly) and the economic expansion and bull market are aging. It has been almost a decade since the last 30% drawdown in the stock market, and that may increase the probability of a more challenging period ahead.

Long-Term Investment Success

Our long-time client became aware of Richard C. Young & Co., Ltd. after having been a subscriber to my dad’s investment newsletter, The Intelligence Report (IR). IR was consistent with its investment strategy and forms the basis of how we invest for our clients.

Diversification and patience built on a foundation of value and compound interest is a phrase we use often and one you will see at the bottom of the first page of this letter. Compound interest is, if nothing else, predictable. If your portfolio is compounding, your portfolio continues to accumulate additional shares of the companies you own. The longer time you allow shares to compound, the greater your chance of investment success.

When our client joined our firm he would have received the August 1995 issue of The Intelligence Report. I looked back at that issue to see what type of strategy was being recommended at the time and found, to no surprise, it was similar to what we advise today. Here is an excerpt from page 3:

A Three-Point Guide To Long-Term Investment Profits

When you invest in or for retirement, I like you to think in terms of a three-point total return concept:

1. Look to current yield to fund day-to-day living expenses. It is a fact that over the long term, dividend yield accounts for approximately one-half of total return. Your minimum portfolio yield should be a yield at least 20% higher than the Dow or S&P 500.

2. After current yield, look next for annual dividend increases to help you neutralize the negative effect inflation has on purchasing power. If you are retired on a fixed income, your income will buy you increasingly fewer groceries at Winn Dixie as time passes. Your high-yielding stocks should give you average dividend growth of 3%–4%, which will pretty much cancel the negative effect of inflation.

3. Look for a long-term annual increase in the price of your portfolio stocks that matches the dividend growth of the shares included in your portfolio. If you plan on an average 3%–4% appreciation component for your high-yielding portfolio, you should be on target.

A History of Consistency

Another benefit of dividend payments is their predictability. While the direction of the stock market is unknown, we can usually predict dividend payments. Most often, blue-chip-type companies strive to maintain their dividend policy. Not doing so can be seen as a sign of weakness or concern. Hence, when we invest in blue-chip dividend-payers, we can take comfort knowing we are investing in a security where there is an element of predictability and consistency.

Kiplinger recently opined on the merits of a dividend-based investment strategy. Here are some of the highlights:

Companies with a long track record of consistent dividend payments are attractive, but dividend growth matters, too. Steady dividend hikes not only make a stock more alluring to new income investors but also reward existing investors with increasingly higher yields on shares purchased at lower prices in the past.

Dividend stocks that raise their payouts have appeal in an aging bull market, when the pace of shareholder-friendly stock buybacks and mergers can slow, according to Heidi Richardson, an investment strategist for BlackRock. Dividend growers, she adds, also can offer an edge when interest rates are going up: “Stocks with a history of consistently growing their dividends have historically tended to perform well and exhibit less volatility in a rising rate environment.” The Fed raised rates as expected on March 21, and Kiplinger thinks investors should brace for two more potential rate hikes later in 2018.

108 Years of Dividends

State Street is an example of a dividend-payer with a history of dividend increases. State Street is up for the year and has paid a dividend since 1910. From its founding 225 years ago, State Street has grown from a small maritime bank into a global financial institution now responsible for 10% of the world’s assets. State Street serves more than 100 markets and is the world’s third-largest asset manager, holding $2.7 trillion in assets under management at the end of 2017. State Street also provides custody services to other financial firms, and at the end of 2017 held $33.1 trillion in assets under custody. The business’s fee revenue alone exceeded $2.3 billion in 2017. State Street is also the world’s third-largest player in the ETF industry.

Harris Corp. is another long-time dividend-payer that has performed well year-to-date. Harris traces its roots back to 1890 when brothers Alfred and Charles Harris invented an automatic printing press feeder to speed up the traditionally manual process of paper feeding. By 1895 the two had incorporated and set up shop in Niles, Ohio. By the 1940s, Harris had become a leader in the printing press business by focusing on technological advancements. During WWII, Harris got the first opportunity to become the military supplier it is today by helping to develop an innovative sighting system that improved bombing accuracy. In 1949 Harris made one of its most important acquisitions, buying Farnsworth Radio and TV Corporation. Entering the radio industry would change the company forever. Today Harris is a leader in providing communications systems to the military personnel and first responders of the United States and many other countries. Harris also creates systems for electronic warfare, avionics, satellites, undersea systems, and much more. Harris has paid a dividend since 1941 and increased its dividend for 15 consecutive years.

Patience with Walgreens and General Mills

While I would like to think all of our stock selections demonstrate short-term positive performance, this is simply not how things always work.

Walgreens has had share price struggles, but it is one of two dominant pharmacies in the U.S. The retail pharmacy stocks have struggled from a perceived threat from Amazon, but we think Walgreens and CVS are more entrenched than others assume. We are also not paying much to own Walgreens. The stock trades at 11X 2018 estimated earnings. The shares offer a dividend yield of 2.46%, have increased dividends for 42 consecutive years, and we expect another 7% increase in the dividend this year. Over the last twelve months, Walgreens has returned over $12 billion to shareholders in the form of dividends, buybacks, and debt paydown. That is equivalent to almost 20% of the company’s current market value. That $12 billion is not a sustainable number, as Walgreens drew down cash to execute a portion of the capital return program, but it does send a signal of management’s confidence in the business. Notwithstanding the 20% capital return, investors have managed to find a reason to send Walgreens shares down both year-to-date and during the last year.

Unfortunately, Walgreens performance isn’t an isolated incident, but part of a larger trend among consumer staples stocks. Staples stocks are suffering from what one might call the market’s Wimpy Syndrome. Everybody remembers Wimpy from the Popeye cartoons. Wimpy was obsessed with hamburgers. He would regularly try to con others into buying him hamburgers today in return for payment in the future. His most famous line was “I’ll gladly pay you Tuesday for a hamburger today.”

In today’s environment, many investors seem to be falling for the Wimpy con. They are gladly offering the Wimpys of the corporate world (think Netflix, Tesla, etc.) capital today in hopes of getting paid back in the future. The companies that pay investors today in the form of dividends and big streams of free cash flow are being shunned by investors.

Take General Mills, for example. General Mills has its share of challenges, but over the last 12 months the company generated almost $2.3 billion in free cash-flow. The market value of the company is $26.6 billion for a free-cash-flow yield of more than 8.5%. The dividend yield is 4.4% at today’s price. General Mills has been around since 1866 and owns some of the world’s most valuable brands. Contrast that to Tesla. Tesla pays no dividend and burned over $3.4 billion in cash last year. Tesla operates in a fiercely competitive industry with established competitors. Tesla has a market capitalization of $47 billion, or about 1.8X greater than General Mills’.

As the Walgreens and General Mills examples show, sentiment toward the staples sector is poor, and the proliferation of factor-based investing and exchange-traded funds hasn’t helped the issue.

We can’t forecast how long staples stocks will remain out of favor, but as Ben Graham famously said, “In the short run the market is like a voting machine, but in the long run it is more like a weighing machine.” Over the long run, count on a recovery.

Is the Yield Curve Forecasting Recession?

Some economists, including members of the Federal Reserve, are sounding alarm bells over the flattening yield curve. Typically measured as the difference between the 10-year Treasury yield and the 3-month T-bill rate, the yield curve has historically been a good predictor of recession. When the yield curve inverts, that’s when long-term rates drop below short-term rates, recession often follows within the next 6–12 months. Today, the gap between long-term and short-term interest rates has narrowed significantly, and some pundits are worried the curve may invert if the Federal Reserve continues increasing short-term interest rates.

We would view an inverted yield curve as a concern, but the current cycle has some artificial elements that may weaken the signal’s significance. What’s artificial about the flattening yield curve? The Federal Reserve is putting upward pressure on short-term interest rates by raising the Federal Funds rate and allowing maturing treasuries to roll off its balance sheet. The U.S. Treasury is contributing to the upward pressure by issuing more short-term debt. Meanwhile, the Fed continues to own a significant portion of long-term Treasury bonds. The Fed is effectively engaged in yield curve management, where they are putting upward pressure on short-term interest rates and maintaining downward pressure on long-term rates.

So while an inverted yield curve should still be respected, central bank distortions of the yield curve make the signal of an inversion less reliable.

Have a good month. As always, please call us at (888) 456-5444 if your financial situation has changed or if you have questions about your investment portfolio.

Warm regards,

Matthew A. Young
President and Chief Executive Officer

P.S. Mark Mobius, the 81-year-old investment guru, believes the U.S. stock market is set for a 30% correction that would essentially wipe out the gains of the last two years according to MarketWatch, as reported on April 21, 2018.
“The market looks to me to be waiting for a trigger that will cause it to tumble. You can’t predict what that event might be—perhaps a natural disaster or war with North Korea.”

MarketWatch continues: “Mobius, who predicted the start of the bull market in 2009, has concerns that any fall would be amplified by the increasing use of exchange-traded funds, which account for nearly one-half of all trading in U.S. stocks. His fear is ETFs would trigger further drops once markets fall.”

P.P.S. Our favored PNC Financial Services one-ups State Street on dividend history, having paid since 1865. PNC is one of the largest banks in America, based on deposits and branches, and one of the country’s leading providers of credit to middle-market companies. PNC has a 19-state retail banking business, with asset management and corporate and institutional banking operations that serve all 50 states. PNC also has strategic offices in Canada, China, Germany, and the United Kingdom. But small businesses are only part of the PNC story. The bank’s customers also include more than two-thirds of the Fortune 500. PNC also owns a minority stake in BlackRock, the world’s largest publicly traded asset management firm.

P.P.P.S. IBM reported quarterly results recently that weren’t to Wall Street’s liking. The company beat earnings estimates, but Wall Street didn’t care. As is often the case in the tech sector, Wall Street is more focused on financial metrics that don’t translate into shareholder value. Revenue growth is where the brokerage community tends to focus, but it is free cash-flow, dividends, and share buybacks that create actual shareholder value. Over the last 12 months, IBM generated $14 billion in free cash flow, paid dividends of $5.6 billion, and repurchased $3.6 billion in stock. Today, IBM is trading at less than 10X last year’s free cash flow and offering a shareholder yield (dividends plus buybacks) of 6.7%. The dividend is well covered and has been increased annually for 21 consecutive years and, we estimate, by another 5% this year.

IBM has some work to do to transition from a company with legacy businesses into a firm with greater shares in faster-growing segments of tech, but the company is well on its way. The transition won’t be smooth as evidenced by Wall Street’s reaction to the latest quarterly results, but IBM is a firm with a long and storied history of making successful transitions as markets evolve. Don’t forget this company was founded in 1911 to make tabulating machines—decades before mainframes were invented.

We own IBM in many portfolios in modest size. We see potential for resurgence in the shares should the company successfully transition to faster growth with a valuation and yield that are not demanding in the event the company stumbles.


The Rise of Automated Trading and Fall of Fundamental Analysis

March 2018 Client Letter

Did exchange-traded funds (ETFs) cause the February stock market correction? “Nonsense,” is the response of many experts to that question. ETFs, provide access to baskets of securities that mirror indexes and can be bought and sold throughout the day, just like stocks. “ETFs are the future of investing. Just ask anyone!”

On the surface, it is hard to find fault with ETFs. Though they are new, ETFs aren’t far removed from the open-end and closed-end mutual funds that have been around for decades. Paired, however, with automated algorithmic trading (another of today’s innovations in finance), ETFs may not be as benign as many experts believe.

WIRED magazine recently opined on the role of ETFs and algorithmic trading in financial markets. Below are some highlights. (Emphasis is mine.)

… ETFs trade as units. If I own an ETF that mirrors all large US companies and I decide to sell, a tiny piece of every company in that basket gets sold. The same is true for traditional mutual funds, which have been around for decades, but mutual funds can only be traded once daily. ETFs are traded in fractions of a second, which means that every company with listed shares or bonds can also be traded in fractions of a second, as quickly as a computer program can process the data. Those programs, and the algorithms that drive them, are beginning to upend and distort the multi-trillion-dollar business of buying and selling stocks and bonds.

For nearly two years, global stock markets were calm. Eerily calm. Between February 2016 and February 2018, US stocks climbed steadily and never suffered a drop of more than a few percent. US politics were dramatic, as were global crises, but financial markets, after years of turmoil following the financial implosion of 2008, were placid.

In early February, the calm ended, in a spectacular fashion. In rolling waves of frenetic selling and buying, the Dow Jones Industrial Average moved up and down hundreds of points within hours, as did other major global indexes. For now, the frenzy seems to have subsided. But those weeks raised concerns that have been building for some time and are not yet understood.

Before ETFs, which have only become a substantial portion of the market in the past few years, there were certainly market panics and collapses. But the recent frenzy should be a wake-up call that technology is altering financial markets as dramatically as it has other segments of society, and we’d best figure how to understand and control it.

The result is that at any given time, a majority of the market is now determined not by humans making decisions but by computers trading with one another based on programs. There are no hard and fast numbers, though JP Morgan recently estimated that only 10 percent of trading now consists of people trading with people based on fundamental decisions about company A or company B.

With more money pouring into ETFs and more trading dominated by algorithms, the essential nature of stock and bond markets is morphing. For now, it isn’t clear into what. So far, the effect of the machines has been to speed up cycles of selling and buying, so that you can now have a stock market sell-off and recovery in days instead of weeks and months. That in itself is no big deal assuming that everything returns to some level of stability once those computer-generated storms have passed.

Anyone who has experience with technology may immediately feel some unease with the evolution WIRED describes. It may not happen often, but software and hardware don’t always work as designed. J.P. Morgan’s statistic that as much as 90% of trading is no longer generated by fundamental investors is rather disturbing, and may in fact contribute to the style of correction we saw in February. I say contribute because ETFs and algorithms probably weren’t the spark that ignited the correction, but rather the fuel that allowed the fire to continue burning.

The Spark

For the spark, we would look to the bond market. As I wrote last month, February’s volatility may have been caused by a shifting outlook for interest rates and inflation. The US economy and stock market have benefited from many decades of declining and low long-term interest rates. A move in the direction of higher interest rates will likely be a headwind for stocks.

3% Rates = Down Year for Stocks

If interest rates rise above 3%, stocks will end the year down. That is according to Jeffery Gundlach, manager of the widely followed Doubleline Total Return Bond Fund. Gundlach is in the business of selling a bond fund, so one should take his views on stocks with a grain of salt, but he may not be wrong. Three percent yields aren’t high by historical standards, but global central banks have kept rates so low for so long economies and asset prices may now be more sensitive to smaller changes.

If Mr. Gundlach is correct, the good news is 1) rising rates are creating pockets of value in an otherwise expensive market and 2) rates are rising (more on this later).

Value is undoubtedly difficult to spot in the market-capitalization-weighted exchange-traded funds like those that track the S&P 500. By example, Apple, Amazon, Facebook, Microsoft, and Google, the top five components of the S&P 500, have an average P/E of 84X and a median P/E of 29X. A simple way to think about P/E is as the number of years it would take to earn back your investment at the current rate of profit. We are all for long-term investing, but 84 years?

Worse than the elevated P/E of the S&P 500 and its top constituents is the average dividend yield of the top five. America’s five biggest companies pay an average yield of 0.64%. The median yield is 0%, as only two of the five even bother with dividends.

To find pockets of value in this market, you should watch the hot money and look in the opposite direction. Over recent years, the low-interest rate environment created a chase for yield in dividend stocks that were viewed as “bond substitutes.” That drove down yields and created an uncomfortable correlation between long-term interest rates and these “bond substitutes.”

The hot money now appears to be leaving that trade.

The FAANG-heavy (FAANG stands for: Facebook, Apple, Amazon, Netflix, and Google) consumer discretionary and technology sectors have managed to keep the S&P 500 in the black, but the highest-yielding sectors of the stock market are all down YTD. Real estate, utilities, consumer staples, and telecom stocks (the RUST sectors) have been bombed out and now offer select opportunities. We initiated a new position in the Canadian utility Fortis, which I profiled last month. I’ll have more to report as new positions are added to portfolios.

That is not to say that the RUST sectors won’t continue to be outdone by the more speculative areas of the market for a time. Over the last three years, the FAANG stocks (and other speculative shares) have risen at a rate seemingly unbounded by profits or dividends. Trying to predict the madness of when crowd sentiment will shift on these names is an unusually poor use of time.

The current environment has a feel similar to the late 1990s when speculation was dominant. To successfully navigate the environment then, my dad advised a focus on patience and compound interest. He recently wrote about it at Young’s World Money Forecast.

Compound Interest Is the Key

Legendary investor Phillip Carret used to say that investing genius consisted of one part patience, and one part compound interest. And Charlie Munger, Warren Buffett’s long-time partner, will tell you that he is rarely without a compound rate-of-return table. As Munger says, “Understanding both the power of compound return and the difficulty of achieving it is the key to investing.”

If you adhere to a base of value, keep your portfolio turnover low to cut costs and taxes, and rely on the miracle of compound interest, you will set yourself on the safest and surest course to profit both this year and in future years. Craft your portfolio with counterweight building blocks that allow you to ride out the vagaries of the marketplace.

Last year was the third consecutive year that growth stocks outran value stocks. But remember, growth and value tend to produce similar returns long term. One sector is ahead for a period, then the other has its day. Back in the two-tier market of the early 1970s, growth stocks had a field day at the expense of value stocks. But over the next decade, it was another matter. Value stocks clobbered growth stocks, and its value stocks that are cheaper now in 2000.

The same advice can be given today. Patience and compound interest never go out of style.

Higher Rates a Positive

Rising interest rates tend to be frowned upon by many market participants, but we take a different view. Higher rates may lead to lower stock and bond prices in the immediate aftermath of the increase, but they also provide an opportunity to earn higher yields. Investors who have been positioned properly for a move up in interest rates should be delighted at the prospect of a 3%+ long-term Treasury rate.

How Will Your Bonds Fare in a Rising Rate Environment?

Over the last 12 months when short- and long-term interest rates have risen, Vanguard Short-term Investment Grade fund and our favored Vanguard GNMA fund are up 0.87% and 0.59%, respectively. Nothing to brag about, but higher rates haven’t meant the end of the world for a properly positioned bond portfolio. If short- and long-term interest rates rise a similar amount over the next 12 months, the returns on both funds may be better than they were over the last 12 months, as today’s rates provide a greater level of interest income to cushion any price decline.
GNMA Yields North of 3%

The 30-day SEC yield on the Vanguard GNMA fund is now 3%. That is a 3% yield on an intermediate duration full-faith-and-credit pledge security. Vanguard GNMA invests in mortgage-backed securities (MBS) created by Ginnie Mae. Ginnie Mae doesn’t actually lend money itself or create MBS. Ginnie Mae guarantees, with the full backing of the U.S. government, the timely payment of interest and principal on mortgage securities created using loans from the Federal Housing Administration and the Department of Veterans Affairs, among other originators.

Why is the yield so high if the risk is so low? Though GNMA investors don’t have to worry about the risk of default, they do have to manage pre-payment and extension risk. Pre-payment risk is most associated with MBS. During the multi-decade interest rate decline from the late 1970s, Americans had an easy time refinancing their mortgages into lower rates, thereby paying off the original mortgage and sending an unexpectedly early chunk of money to the MBS holder. Today, with rates coming off multi-decade lows, investors should place more focus on extension risk. Extension risk is the opposite of prepayment risk. When rates rise, homeowners are less likely to refinance, which reduces the amount of principal repaid, thereby increasing the duration of the MBS.

On balance, we view a rising rate environment favorably. Any short-term price declines in the bond portfolios we manage are likely to be offset by higher interest payments over time.

Have a good month. As always, please call us at (888) 456-5444 if your financial situation has changed or if you have questions about your investment portfolio.

Warm regards,

Matthew A. Young
President and Chief Executive Officer

P.S. As recently reported in Bloomberg, home prices rose almost 9% on a year-over-year basis in February. That’s the biggest gain in four years. U.S. house prices are now 6.3% higher than their peak in July 2006. The ratio of house prices to income is creeping toward levels hit during the height of the last real estate bubble, yet housing affordability remains significantly better. What’s the difference between today and 2006?

One of the biggest differences is the level of mortgage rates. At a maximum 28% of gross monthly income (ignoring taxes and insurance) today’s median income family can afford a mortgage of $356,000. Raise those rates to 6.0%, which is what they averaged in 2006, and the maximum affordable mortgage falls about 20%.

According to Bloomberg, while sales were little changed amid the thin inventory, the median price across 172 large metropolitan areas jumped to $285,700, according to a report Thursday from brokerage Redfin Corp. It was the 72nd straight month of year-over-year increases since the market bottomed in 2012.

P.P.S. The WSJ recently reported that U.S. companies have announced $200 billion in share buybacks over the last three months. That’s double the pace of last year. Management teams love buybacks because they boost share prices, which in turn make executive stock options more valuable.

The problem with buybacks is that they are discretionary. And corporate boards and management teams have terrible timing. Buybacks tend to be highest late in the business cycle. During recessions, when share prices are at their most attractive levels, buyback activity falls as companies look to conserve cash.

Buying back more of your stock at higher prices and less at lower prices probably isn’t the savviest capital allocation decision.

P.P.P.S. Rail dividends: In February, Norfolk Southern increased its dividend by an impressive 18%. Confidence in the business and a lower tax rate, thanks to the tax package passed last year, motivated the dividend boost. Union Pacific, another of our favored rail names, also hiked dividends in February—the company’s eleventh consecutive annual dividend hike. The February hike came on top of a dividend hike announced last November. Union Pacific’s decision to increase the dividend again in February was attributed to the tax reform. UP’s dividend is up 21% over the last year.


Volatility Returns

February 2018 Client Letter

There Are No Guarantees in Investing

It’s wise to remember that investing in the stock market is not a strategy guaranteed to make you wealthy. In fact, the stock market at times can decrease your wealth. Twice over the last 19 years, once between 2000 and 2002 and again from 2007 to 2009, the stock market declined by more than 50%.

At the start of this century, a freshly retired couple was likely feeling pretty good. The economy was humming along nicely, 9/11 had not yet occurred, and the stock market was delivering some of its best returns ever.

Since then, the stock market has crashed twice, the economy has gone through two recessions, with one accompanied by a financial crisis, and the Fed took risk-free interest-generating investments out of the game for nearly a decade. Such an environment has tested the nerves of even the most seasoned investors. The problem for many is that, once you retire, you no longer have the security blanket of a regular paycheck to get you through volatile periods. For many investors, the primary source of income in retirement is an investment portfolio. Watching the source of your livelihood rise and fall by 50% is not a calming tonic.

Volatility and steep stock market losses often lead to the type of emotionally charged investment decisions that sabotage portfolio performance. I have referenced Dalbar many times in these monthly letters because their data is stark. For the 30-year period ending in 2016, the average investor underperformed the stock market by a staggering 6.18%, and the bond market by an equally disturbing 5.77%. Investors buy at the wrong time and sell at the wrong time. Volatility and emotion are often contributors here.

While risk can never be eliminated entirely from an investment portfolio, proper diversification can help cushion the blow of big stock market declines, allowing retired investors and those approaching retirement to stay the course.

I often find that once investors have crafted a diversified and balanced portfolio, volatility is viewed in a different light.

Volatility Returns

The stock market started 2018 strong with a 5.7% return in January. That translates to an annualized return of 85%. A show of hands by those who expect an 85% stock market return in 2018? It was clear stocks would either correct significantly or go through a period of time with minimal price appreciation. The former is, of course, what happened, but that has recently been followed by another rally.

As my dad recently wrote on his Young’s World Money Forecast website, the first step toward achieving investment success is to define your goals and determine how much risk you can and want to take to achieve those goals.

For over four decades, I have offered strategies and insights to help individual investors like you. My primary goal, whether in my monthly strategy reports, at investment seminars, or for current clients of my money management firm, has been helping investors achieve long-term investment success.

What you buy, what you sell, what price you pay, and which strategies you pursue all matter for your investment success, but they aren’t the most important steps in the process. Focusing first on what the “good buys” are is putting the horse before the cart.

What’s your goal? First, define what investment success means to you and your family. Next, determine how much risk you can or want to take in your portfolio to achieve that goal.

Does investment success mean doubling your money in five years, even if that requires a portfolio with neck-snapping volatility and nights awake in a cold sweat? Or are you like me—a more patient investor who is more interested in preserving wealth and letting the power of compounding work its magic over time?

Ask yourself how much risk you can take or want to take.

The success I want you to embrace comes from compounding and patience. I invest guided by the principles embraced through the decades by Benjamin Graham, Walter Schloss, and David Dreman.

Dividends Are Our Focus

Our stock market investment strategy is focused on companies that pay dividends and raise those dividends. Dividends are cold hard cash. Earnings and revenues can be faked and manipulated. Even the cash flow statement, which many investors believe is more difficult to manipulate than the income statement, can provide a misleading picture of a company’s health.

Paying a dividend requires actual cash. Boards and management teams are reluctant to cut dividends, which makes dividend hikes a signal of management’s confidence in the business’s prospects. Dividends also create a scarcity of retained earnings so only the best growth opportunities get funded.

Two companies in our clients’ portfolios that pay healthy dividends and have a record of making regular annual dividend increases are Fortis and UPS.

Fortis Inc.

Fortis Inc. is a diversified utility company that owns and operates regulated and unregulated utility assets in Canada, the United States, and the Caribbean. Fortis serves nearly 2 million electric customers and 1.2 million natural gas customers across its portfolio of regulated utilities. The company’s non-regulated power generation portfolio has a generating capacity of 391MW. In 2016, at peak demand, Fortis’s electric systems delivered 33,021 megawatts of power, and its gas system delivered 1,586 terajoules. Fortis is one of North America’s 15 largest investor-owned utilities (based on enterprise value).

Fortis holds the record for the most consecutive years of dividend increases by a Canadian company, 44 in total. The company’s management and board aim to keep increasing dividends each year by 6%. In the fourth quarter of 2017, Fortis raised its dividend by 7% to an annual rate of $1.60 per share. The shares yield 4.1% today.

UPS

UPS is the world’s largest package delivery company—an impressive statement for a company founded by two teenagers. UPS got its start in 1907 in Seattle when Claude Ryan and Jim Casey hired other teens to run errands, make drug store deliveries, and carry notes on foot or by bicycle. Their operation wasn’t the only one in town; but a commitment to courtesy, neatness and high ethical standards made them stand out from the competition.

In 2016 UPS delivered an average of 19.1 million pieces per day—that’s 4.9 billion for the year. To keep up with the current explosion in e-commerce demanding an ever-larger volume of package delivery services, UPS is upgrading its 30 processing hubs and adding more. It is also adding trucks and another 14 Boeing 747-8s to its already sizeable fleet of 657 owned and leased aircraft.

UPS has paid a stock or cash dividend every year since 1955 and has raised its dividend each year for the last nine years. In early February, the board of directors at UPS announced an increase of the quarterly dividend to $0.91, a nearly 10% boost. Dividends are “a high priority at UPS,” according to CEO David Abney. Since going public in 1999, the package delivery service has more than quadrupled its dividend. UPS shares yield 3.4% today.

Did Rising Rates Cause the Correction?

There were likely many reasons for the sharp stock market correction in February, but one some pundits have pointed to is a rise in long-term interest rates.

In September of 1981, 10-Year Treasury rates peaked at almost 16%. From that high, interest rates went on a three-and-a-half decade secular decline that colored every asset class in the world. Bond prices benefited from the decline in interest rates, but so did stocks, real estate, private equity, venture capital, and art, among other asset classes.

In July of 2016, the multi-decade bull market in bonds ended when the 10-year Treasury rate hit 1.31%. Rates moved up following the 2016 low, but only recently have they broken above their three-decade downward sloping trendline. The breakout may be one of the most consequential in your investing lifetime.

The end of the great bond bull-market signals the beginning of a new paradigm in financial markets. Bonds may be at the start of a bear market, but that isn’t the most important takeaway from the breakout in interest rates. The more important implication is that financial assets no longer have the tailwind of regularly falling long-term interest rates at their backs. Returns on a wide spectrum of assets are likely to be much lower looking forward than they have been looking backward.

Rates remain low by historical standards, but they have increased markedly over the last 18 months. In September of 2016 the three-month T-bill offered a yield of about 0.25%, the two-year Treasury note paid about 0.75%, and the 10-year Treasury rate was 1.6%. Today, you can buy a three-month T-bill with a yield of 1.64%, a two-year Treasury note with a yield of 2.25%, and a 10-year Treasury note with a yield of 2.92%.

Higher yields have caused investors to reassess the relative appeal of stocks and bonds. Holding interest rates at zero for nearly a decade, and pressuring long-term rates with quantitative easing, distorted financial asset prices of all kinds. Investors were pushed to reach for return. That has long been apparent in the high-yield bond market, where spreads are tight and yields are near historic lows.

The high-yield bond market, a sector that traditionally outperforms Treasuries when interest rates rise, has underperformed during the most recent leg-up in yields. Investors have started to bail out of the sector. High-yield is a sector of the market we have owned in the past and may own in the future, but at current yields, we don’t like the risk-reward trade-off.

Have a good month. As always, please call us at (888) 456-5444 if your financial situation has changed or if you have questions about your investment portfolio.

Warm regards,


Matthew A. Young
President and Chief Executive Officer

P.S. From its high of almost $20,000 in December, the price of bitcoin fell to $5,800 in early February—that’s a 70% loss over about eight weeks. The crypto-currency has bounced off of its low, but it remains at about half of its former high. How many mom and pop investors trying to strike it rich in bitcoin have been burned? Crypto-currencies and especially the shared ledger technology underlying them may be of interest, but in our view, they have no place in a prudently managed investment portfolio.

P.P.S. Ben Stein writing at the American Spectator recently opined on bitcoin and the recent bout of stock market volatility.

There is also a Godzilla monster lurking on the ocean floor, too. ‘Bitcoin.’ No one knows for sure what it is or why it has any value at all. It’s bound to go to close to zero, and when it does, it will take a lot of decent people with it. This will not help the national mood. I would feel differently about it if anyone had ever been able to explain to me what it is or why it had any value. No one has. Charlie Munger says it’s a fraud. I don’t think I want to bet against Charlie Munger. Neither should you.

So, my humble thought, which could be totally wrong: there is no general weakness in the economy. There is no 2009 financial system super catastrophe waiting to happen. The market just got way ahead of itself in an uncertain environment about inflation. The rout may continue for a while but it’s not the end of the world as we know it. At least that’s what I have to tell myself to sleep tonight.

P.P.P.S. Facebook is declining in popularity among U.S. teens. The platform has lost 10% of its users aged 12 to 17 according to eMarketer. Ben Rubin, a 30-year-old tech entrepreneur, has developed a group video chat app called Houseparty that is gaining in popularity with teens. Can Houseparty replace Facebook?

The FT recently reported on Rubin’s goals for his app:

Two years ago he landed on the idea for Houseparty, where groups of up to eight friends gather to chat, moving in and out of “rooms” and meeting friends of friends. It has already hosted half a billion chats. The average time spent on the app has gone from zero at launch in September 2016 to 51 minutes a day.

Many teenagers do their homework in there. It is, for the uninitiated, like a more casual version of a FaceTime call. Most users are in the US, with the UK in second place.

Mr. Rubin had been searching for “meaningful connection” for people online long before Mark Zuckerberg, Facebook founder, started talking about prioritizing “time well spent” early this year. It worries Mr. Rubin that teenagers are 40 percent less likely to hang out with their friends in person every day than the same age group just seven years ago, according to the book iGen, by psychologist Jean Twenge.

“Our kids are going to have the best emoji for conversation, but they won’t know how to wink,” he says. “And that’s not the world I want.”

P.P.P.P.S Traditionally emerging markets haven’t performed well in times of inflation in the United States. While most inflation predictions for the U.S. don’t put emerging markets in jeopardy, the latest inflation numbers and some predictions are raising red flags that all emerging market investors should be paying attention to. Steve Johnson reports in the FT:

Research by Daniel Salter, head of emerging market equity strategy at Renaissance Capital, an EM-focused investment bank, suggests that four of the five 30 percent-plus falls in the MSCI EM index since its inception in 1987 occurred within one month of US consumer price inflation hitting 3 percent.

While most forecasters are not penciling in such an eventuality in the foreseeable future, it should perhaps not be entirely ruled out in the wake of recent data showing year-on-year US wage growth of 2.9 percent in January, which seemingly provoked the current sell-off in global markets.


Do You Have an Investment Game Plan?

January 2018 Client Letter

History has a way of repeating itself. In early 1995 my dad wrote about a math professor named Tom Nicely, who worked at Lynchburg College. Nicely was examining prime numbers using a group of five personal computers. While four of the computers gave Nicely the correct answer to a problem, 1.2126596294086, the fifth turned up a slightly different answer, 1.212659624891157804.

The cause of the fifth computer’s error was its Intel Pentium processor. Nicely called Intel to explain but was given the cold shoulder. Next, he did something which, at that point, was still novel—he asked for help on the Internet. Others checked Nicely’s work and came back with the same results, confirming his conclusions.

Intel had already known about the problem since May when one of their own researchers had discovered it, but only after they had been backed into a corner by independent confirmation did the company acknowledge Nicely’s research. The chip maker even offered him a consulting job.

The bug was first reported in an industry journal known as Electronic Engineering Times, but when it was reported by the mass media on CNN on November 21, 1994, the stock dropped over 12.3% in a little less than a month. The stock only began gaining again after Intel offered a recall on December 20.

Today Intel is in a somewhat similar, though not exact, position. A group of researchers connected by the Internet have exposed a much larger flaw in Intel’s processors, and now the company needs to deal with the fallout.

The issues, known as Spectre and Meltdown, could potentially be used by hackers to attack computers using Intel processors. The news was again first reported in an industry journal out of the U.K., the Register. But in today’s rapid information world, it didn’t take much time to disseminate to the market. Intel’s share price dropped over 9.2% in eight days.

Only after CEO Brian Krzanich wrote an open letter to the tech industry explaining Intel’s next steps were investors willing to climb aboard Intel once more.

Do You Have a Game Plan?

We do not relay this story to you to shame Intel. What we want you to see here is that companies often undergo rough periods. The tech industry, in particular, is prone to volatility, thanks to complex products and low barriers to entry. The unexpected happens, and without a game plan, you may see a lot of your own money wiped off the board quickly.

In the stock market, our game plan has long been one laid out first by Ben Graham in The Intelligent Investor. Graham wrote, “One of the most persuasive tests of high quality is an uninterrupted record of dividend payments for the last 20 years or more. Indeed, the defensive investor might be justified in limiting his purchases to those meeting this test.” We would add to Graham’s astute analysis that focusing on companies dedicated to increasing dividends helps as well.

A Piping Hot Stock Market

To say that stocks are off to a fast start in 2018 would be an understatement. The U.S. equity market is piping hot. Melt-up is the word Wall Street seems fond of using to explain the performance. The Google Trends chart for the word “melt-up” has spiked to the highest level since Google started tracking data in 2004.

What is driving the so-called melt-up in U.S. stocks? A delayed reaction to tax cuts, a more favorable economic backdrop, and an overall pro-growth agenda from the government are presumed to be helping. But investor euphoria also looks to be a major contributor. The Credit Suisse Risk Appetite Index (a measure of euphoria) is at a record high—higher than the level reached at the height of the dotcom bubble. Ned Davis Research’s investor sentiment composite index, which aggregates many different sentiment indicators, is also at a record high (again exceeding dotcom levels). The ratio of bulls to bears in the Investors Intelligence sentiment poll is near its highest level on record. Bears have apparently gone into hibernation.

Memories (nightmares if you wish) of the rapid ascent in financial asset prices that preceded the dotcom bust and the financial crisis have some investors nervous. Based on the level of valuations and euphoria in markets, that caution may be justified. This has been one of the longest bull markets on record, and it has been aided by the lowest interest rates in 5,000 years of recorded history and the greatest amount of central bank intervention… ever.

In a recent WSJ op-ed, Martin Feldstein, a Harvard economist and former chair of President Ronald Reagan’s Council of Economic Advisers, commented on today’s financial landscape. Below are some of the highlights.

Stock prices rose much faster than profits did. The price/earnings ratio for the S&P 500 is now 26.8, higher than at any time in the 100 years before 1998 and 70% above its historical average. Although some of the market’s recent surge reflects improved expectations since the 2016 election, the P/E ratio just before the election was already 49% higher than its historical average.

The high price of stocks reflects the very low returns available on fixed-income securities. Though the federal-funds rate has been raised since 2015, its real value is still negative. The 2.5% yield on 10-year Treasury bonds approximately equals expected inflation over the next decade, implying a real yield of zero. Historically the real yield on 10-year Treasurys [sic] was about 2%….

In short, an excessively easy monetary policy has led to overvalued equities and a precarious financial situation. The Fed should have started raising the fed-funds rate several years ago, reducing the incentive for investors to reach for yield and drive up equity prices. Since it didn’t do so, the Fed now faces the difficult challenge of trying simultaneously to contain inflation and reduce the excess asset prices—without pushing the economy into recession.

Is a Major Correction in the Cards?

While the near-term outlook for stocks and the economy looks favorable, the long-term outlook doesn’t leave one as optimistic. As Mr. Feldstein points out, stocks are expensive and long-term interest rates are far below historic levels. The Shiller P/E ratio, which compares the price of stocks to the inflation-adjusted average of earnings over the past ten years (a method of normalizing profits), is at 33X. That compares to a long-term average of about 16.5X. Stock prices would have to fall by 50% to get back to average. The Shiller P/E ratio doesn’t adjust for new information, like the recent corporate-tax cuts, but even if you assume a 10% lift in profits to adjust for the lower taxes, stocks would still have to fall about 45% to get back to average.

The Risk of a Rise in Long-term Interest Rates

What could cause stock valuations to revert to their historic average? A significant rise in long-term interest rates might do it. Rising long-term rates is one of the biggest risks investors face. Low long-term interest rates have driven investors to reach for return in stocks, real estate, risky bonds, emerging markets, and probably even bitcoin.

A significant rise in long-term rates would act as a major headwind for stocks. Based on current rates of growth and inflation, we would peg the fair value of interest rates at something closer to 4% than the current 2.65%. A 1.35 percentage point increase may not seem like a big deal when the interest rate on your first mortgage was 10%-plus, but many assets have been priced on the basis of a continuation of today’s low level of rates. A change in that assumption could lead to a major repricing.

Bring on the Bear Market in Bonds

As balanced investors, we would welcome a rise in long-term interest rates. We have positioned portfolios to take advantage of higher rates. We hold a meaningful allocation in T-bills for many clients. Our corporate bond portfolios have a duration of two to three years. Our most interest-rate-sensitive position, barring a couple of preferreds, is Vanguard GNMA. And that sensitivity, we feel, is modest at best. Given an immediate one percentage point increase in interest rates, we would expect Vanguard GNMA to fall in price by about 5%. Extend that rise out for one year and the loss is closer to 1.5% as interest income could offset some of the price decline. Meanwhile, we would be investing maturing Treasuries and corporates into higher-yielding bonds.

Not only would higher long-term interest rates provide more income for clients, they would also yield greater diversification benefits.

Longer-term bonds tend to rise more than short-term bonds when stocks fall. In fact, as you can see in the chart below, since 1950, the S&P 500 has been down on fourteen occasions. In all but one of those years, intermediate-term government bonds rose. And the single down-year was a scant .74%. That’s a .929 batting average.

Diversification Part of the Game Plan

We view diversification as the cornerstone of a proper investment program. We diversify our clients’ portfolios globally and across asset classes. If the U.S. stock market experienced a bear market, foreign markets would fall as well, but the extent of the decline and magnitude of the recovery in foreign shares could differ from U.S. stocks. Stock valuations abroad are not as elevated as they are in the United States. That could provide impetus for a shallower bear market and/or a swifter recovery.

Rebalancing is Too

Rebalancing is another strategy we use to mitigate the risk of a major stock market decline. Rebalancing can be counterintuitive, as it often requires one to sell his winning asset classes and add funds to his losing asset classes, but rebalancing is an important risk management tool. We attempt to rebalance opportunistically while also attempting to minimize capital gains (not an easy task nine years into a bull market).

Investment Goals

After a big run-up in any major asset class in your portfolio, it is often a good idea to take stock of your goals. Many of our clients want a reduced level of volatility, a steady stream of income that keeps pace with inflation, and the comfort of investing in a portfolio of businesses that lets them sleep well at night. Those goals may not be the same goals that your friends and neighbors share. Every investor has a different willingness and ability to take on risk. Some rely on their portfolios to help pay for elderly parents or grown children. A more conservative portfolio may be desirable under these circumstances. Others may have a healthy pension income, significant assets, or a big inheritance waiting in the wings. Such circumstances may allow for a more aggressive portfolio, but that is not to say that investors who have the ability to take on more risk always want to.

As always, if your personal financial circumstances have changed or your ability or willingness to take on risk have changed, give us a call. Don’t wait for a major market downturn to decide you want to reduce risk. Now is the time to make that decision.

Warm regards,

Matthew A. Young
President and Chief Executive Officer

P.S. Expectations for a faster pace of interest rate hikes from the Fed are ramping up. The Fed has indicated a plan to raise interest rates three times in 2018, but we would not be surprised to see a fourth hike. Rising expectations for short-term interest rate increases is pushing up yields on short-term bonds as well as money markets. If the Fed follows through with its plans to hike rates, money market yields could exceed 1% by the end of the first quarter. It would still take you 72 years to double your money at that rate of return, but that’s better than the 288 years it would have taken when rates were 0.25%.

P.P.S. My dad started Young Research and Publishing forty years ago to publish Young’s World Money Forecast (YWMF). In its first iteration, YWMF was an economic, monetary, and currency report for institutional investors, corporate officers, and currency investors. At Richard C. Young & Co., YWMF’s economic and currency heritage runs through our global investment strategy. Our international equity holdings are shaded partly by our views on foreign currencies. And, unlike some advisors, we offer a dedicated currency component in portfolios. You will see it separated on your quarterly holdings report between your bonds and stocks.

Gold and silver are regular currency holdings, but periodically we also include more traditional currency positions. The British pound was our most recent position. We closed our pound position this month with a gain. All of our currency trades don’t work out as well as the pound trade did, but one thing we find appealing about currencies is that not all participants in the currency market are motivated by profits. Businesses are in the currency market to hedge or transact, central banks and governments are attempting to manage economic outcomes, and bond investors are most often looking to hedge currency risk without regard to currency levels. That creates opportunity for profit in our view. We closed our position in the pound because we felt after the recent rapid run-up that the risk-reward trade-off had become less favorable.

P.P.P.S. As I mentioned above, we treat gold as a currency. Gold has been used as money for thousands of years. We view gold as a counter-balancer, a hedge against currency debasement, inflation, and geopolitical turmoil. It is an insurance policy of sorts. While gold hasn’t matched the strength of the stock market, it is up almost 2% YTD—surprising, considering the strength in equities and the rise in interest rates. A weaker dollar seems to be the primary driver of gold prices today.


What to Expect from Stocks

December 2017 Client Letter

One of 2017’s surprising outcomes was the lack of stock market volatility. We are in the midst of the second-longest bull market on record and we haven’t seen as much as a 3% correction in the S&P 500 in over a year. That’s a record.

Heading into 2018, investors’ willingness to take on risk appears to be in full swing, supported by U.S. GDP growth on pace to surpass 3% for the third consecutive quarter (a feat not achieved in over a decade), business and consumer confidence bordering near multi-year highs, a major tax-cut now in the books, reduced regulations, investor sentiment at levels not seen since the late 1990s, and market volatility apparently on sabbatical. Risk has taken a backseat in the portfolios of many investors.

The stock market could have another double-digit gain year in 2018, but we are not as upbeat on the longer-term outlook for stocks. Stock price growth has far exceeded earnings growth during the bull market. The result is an environment where stock market valuations have once again reached levels that 1) risk a significant down year when the party finally comes to an end and 2) necessitate much lower long-term return expectations.

What may be reasonable return expectations when looking five to ten years out? In a recent Morningstar interview, Vanguard founder Jack Bogle commented on his expectations for the coming decade.

My reasonable expectations for the coming decade—as in my new book, The Little Book of Common Sense Investing, 10th anniversary edition just coming out—I’m pretty conservative. I look at the sources of returns, that’s all I do, and the fact that other people don’t do it that way doesn’t bother me in the slightest. I look at investment return and that’s today’s dividend yield, which is less than 2% for the S&P 500, and I look at future earnings growth. While future earnings growth has averaged 5% or 6%, I’m looking for a lower future earnings growth, say 4%. I got my 2% dividend yield, there’s no arguing about that, and I’m guessing the earnings growth will be slower. So, that gives me a 6% investment return from the fundamentals of the marketplace.
Now the other part of it is not investment return, but what I call speculative return. That is valuations. If a valuation goes from 10 times earnings to 20, that adds 7% a year over a decade. It’s kind of amazing. We’re not in anywhere near that extreme territory, but I think valuations will probably take 2 percentage points a year off that 6, getting to 4.

Where does that come from? Well, we’re looking at a price/earnings multiple on the S&P. By my standards, past reported earnings, not by Wall Street’s standards, future operating earnings—there’s a big difference between the two—so, I have the P/E at about 25 right now. If it goes down to 18, we’ll lose a couple of points in valuation, which will take that 6 down to 4.

A 4% return probably isn’t what many stock market investors are signing up for when they jump into a portfolio of index-based ETFs. It is of course possible that Bogle’s 4% return expectation may turn out to be too low, but our strategy has always been—and will continue to be—to favor a bird in the hand over two in the bush.

Investing in dividend stocks today that offer the prospect of higher dividends tomorrow is a timeless strategy, but it historically has the most appeal during long dry spells in the market. Dividend stocks offer a greater share of return in the form of regular cash payments. And those payments can be reinvested in more shares, generating even greater cash payments.

The Two Most Important Words in Investing

Dividends on dividends or interest on interest is the essence of compounding. The two most important words in investing are compound interest. Given enough time to work, compounding generates exponential profits. What do I mean by exponential profits? When you double the return on an investment, your profits more than double. By example, if you compound an investment at 2% for 20 years, your profit is 2.2X your profit when compounding at 1%. When you compound at 8% for 20 years, you have more than 3X the profit that you do when you compound at 4%. Double your return again, which is admittedly unrealistic over a 20-year period, and your profit is 5X your profit when compounding for 20 years at 8%.

In addition to favoring dividend payers, we also help clients manage risk and mitigate losses by taking a balanced approach. Mitigating losses is vital for retired investors and those approaching retirement. As the chart below illustrates, when your portfolio falls by 10%, you only need an 11% gain to get back to even. Increase the size of that loss to 25%, and you need a 33% gain to break even—high but doable. Now look at the gain needed to recover from a 50% loss and a 70% loss. To break even from a 50% loss you need a 100% gain, and to break even from a 70% loss—the NASDAQ fell 78% during the dotcom bust—you have to more than triple your money.

Retired investors and those approaching retirement may not have the time to recover from severe losses. A balanced portfolio helps tame volatility and mitigate losses. By example, during the last bear market when the S&P 500 fell 55% from peak to trough, a portfolio invested 50% in stocks and 50% in bonds cut that loss to 24%. If rebalanced at the market low, the 50/50 portfolio would have recovered all of its losses within seven months. It took the S&P 500 more than three years to recover from its losses.

Balanced portfolios may not keep pace with the stock market during the bull phase of a cycle, but the downside protection they offer helps many avoid the emotionally charged decisions that often decimate long-term returns.

Tax Reform Success!

After years of putting up with an inefficient and overly complicated tax code, we finally have improvement. The bill that was passed is far from perfect, but it is significantly better than the current system, especially with respect to business taxes. The corporate rate was dropped to 21% from 35% and pass-through business tax rates were also reduced. Businesses are now allowed to write off capital investments in the year they are purchased (a temporary provision), and the U.S. moved to a territorial tax system, which should no longer incentivize companies to move operations and intellectual property overseas to avoid punitive U.S. tax rates.

S&P earnings per share should get an added boost next year from the tax cut as well as a reduction in share count from repatriated money that is likely to be used for share buybacks. The benefits of the corporate tax cut will not be shared equally. For many companies, the boost won’t be as big as one might assume based on the 14-percentage-point reduction in the corporate rate. The effective tax rate of S&P 500 companies is only about 25%, so the reduction to 21% isn’t that big of a jump. Smaller firms and those that operate primarily in the U.S. are likely to benefit the most from lower corporate-tax rates.

As far as changes to the individual tax code, reforms were more marginal. And because of Senate budget rules, many of the individual changes are likely to expire in 2025.

Below I’ve summarized our understanding of some of the significant changes to the individual tax code.

Individual Rates and Standard Deduction

Individual rates and brackets were reduced across the board. The top rate was reduced to 37% on income in excess of $600,000 (married filing jointly). The standard deduction was nearly doubled to $24,000 and the child tax credit was increased to $2,000 with a phase-out threshold increased to $400,000 instead of the $110,000 level under current law.

State and Local Tax and Mortgage Interest Deductions

For those who itemize, the biggest deductions are often for state and local taxes, mortgage interest, and charitable donations. The charitable deduction is maintained. The new bill puts a limit of $10,000 on the deduction for state and local property, income, and sales tax.

The mortgage interest deduction will also be lowered starting next year. Individuals can now deduct up to $750,000 in mortgage interest, including both primary and second homes acquired after December 15, 2017. The limit on mortgage interest remains $1,000,000 if incurred before that date. The deduction for home equity interest was eliminated. Importantly, individuals who refinance mortgage debt of more than $750,000 (but less than $1 million) incurred before December 15, 2017, will still be allowed to take the full interest deduction as long as the principal balance does not increase.

Alternative Minimum Tax (AMT)

The individual AMT unfortunately survived. The exemption amount was increased to $109,400 for married couples who file jointly, and the phase-out threshold was boosted to $1,000,000. This should lower the number of tax-payers subject to the AMT.

Capital Gains and Dividends

Capital gains and dividend rates are essentially the same under the tax reform bill. For married couples filing jointly, if your income including dividends and capital gains is above $77,200 but below $479,000, you pay a 15% capital gains rate. Above $479,000, the capital gains rate is 20%. If you make over $250,000 as a married person filing jointly, your capital gains and dividend tax rate increases by an extra 3.8 percentage points. You can thank Obamacare for that peach.

529 Plans and Coverdell Savings Plans

One of the more interesting changes in the tax-reform bill was made to 529 plans. The tax bill expands the use of 529 savings plans to elementary and secondary schools. A maximum of $10,000 per beneficiary per year can be used to pay for qualifying expenses for elementary and secondary school. 529s are funded with after-tax money, but income and gains are not taxed, and distributions are tax-free when used for qualifying education expenses. The expansion of the 529 to elementary and secondary schools is likely to make the Coverdell savings account obsolete.

Estate Taxes

The estate tax exemption will be doubled to $11 million starting in 2018 and will be adjusted for inflation annually. The increased exemption expires starting in January 2026. Married couples will be able to pass on estates worth up to $22 million without paying estate tax. Unfortunately, the change was not made permanent and a higher estate-tax exemption isn’t something Democrats have historically favored.

Chained CPI

One big disappointment in the bill was the change Congress made in the way almost everything in the code is indexed for inflation. Instead of using the traditional Consumer Price Index (CPI), the IRS will make inflation adjustments using the chained CPI. The chained CPI has increased at a slower rate than the traditional CPI. The change will slowly and quietly result in higher taxes than would otherwise be the case under the traditional CPI. The primary difference between the chained and the traditional CPI is how substitutions are accounted for. Under the traditional CPI, if the price of steak increases, it is assumed consumers still want to buy steak. The chained CPI says that if the price of steak increases, consumers will buy less steak and more chicken, so the weight of steak in the index is reduced and the weight of chicken is increased, which effectively reduces the rate of inflation under the chained CPI.

With tax-reform complete, the administration and Congress have set their sights on welfare reform. The welfare system needs a major overhaul. Far too many programs and incentives are misaligned. As Michael Tanner of the Cato Institute recently wrote, the Nordics are leading the way on welfare reform. Michael writes:

Even the so-called “Nordic model,” long touted by advocates of the welfare state, is undergoing profound changes. Sweden long ago enacted significant reforms to its safety net, including the partial privatization of its social-security system. This August, Finland announced plans to increase the effective retirement age, cut payments to students, and reform maternity leave. And in Denmark, the government has said that the time has come to embrace the “modernization of the welfare state,” adding that the system “needs to prioritize things in a new way and create the best possible conditions for people to get a job.” In fact, the Danish government has already slashed the length of unemployment benefits from four years to just two.

Perhaps the last holdout, Norway, long buoyed by oil revenue, elected a new center-right government this fall on a platform that called for, among other things, cutting taxes, reducing bureaucracy, and reforming the welfare system to better encourage entrepreneurship. The new government has plenty of public support for its plans: A recent survey by Fafo, a Norwegian research foundation, reported 51 percent of Norwegians supported reducing welfare benefits in order to secure economic growth.

The Nordic region happens to also be one of our favored regions for investment. We invest in individual stocks from the region and gain exposure through The Fidelity Nordic Fund, which invests 80% of its assets in securities that are tied economically to the Nordic region.

The entire region continues to rank in the top 10 in the World Happiness Report. The 2017 report notes that Norway

moves to the top of the ranking despite weaker oil prices. It is sometimes said that Norway achieves and maintains its high happiness not because of its oil wealth, but in spite of it. By choosing to produce its oil slowly, and investing the proceeds for the future rather than spending them in the present, Norway has insulated itself from the boom and bust cycle of many other resource-rich economies. To do this successfully requires high levels of mutual trust, shared purpose, generosity and good governance, all factors that help to keep Norway and other top countries where they are in the happiness rankings.

Have a healthy and happy new year. As always, please call us at (888) 456-5444 if your financial situation has changed or if you have questions about your investment portfolio.

Warm regards,


Matthew A. Young
President and Chief Executive Officer

P.S. AT&T declared its 34th consecutive annual dividend increase on December 15. At the current dividend rate of $2 per share, AT&T shares yield a healthy 5.26%. AT&T looks like a winner if Jack Bogle’s 4% return expectations for the next decade become reality.

P.P.S. Boeing is another of our clients’ holdings that recently increased its dividend. In December, Boeing raised its dividend by 20% to $6.84 per share. Boeing doesn’t meet our most stringent test for dividend growth, as the company took a pause on hikes during the financial crisis. But since the crisis ended, dividends have compounded at an annual rate of 28%. This is an exception we are glad we made.

P.P.P.S. It has been suggested that the risk of us Southwest Floridians getting the flu increases during the winter as an increase of germ-ridden travelers visit the Sunshine State. Whether this is true or not, I do not take chances, and I follow along with what my dad has researched on the health and wellness front. In December my dad posted “Never Get a Cold,” by Chris Masterjohn, on his personal blog, which lists several essential cold prevention supplements. For more information on one of my dad’s favorite health researchers, click here.


Ben Graham’s Dividend Test for the Defensive Investor

November 2017 Client Letter

From September 1985 through September 2017, my dad spent each and every month diligently researching, preparing, and writing his monthly investment newsletter, The Intelligence Report (IR).

Readers of IR are aware of the high regard my dad has for Ben Graham, the father of value investing and one of the most successful investors of all time. My dad believes Graham authored the only investment book most investors will ever need. “If you have read The Intelligent Investor cover to cover, you are head and shoulders above the vast majority of the investing public. To this day, the amount of investing insight and wisdom packed into this single volume remains unmatched.” Some of Graham’s most valuable advice was to the defensive investor. For example, Graham wrote, “One of the most persuasive tests of high quality is an uninterrupted record of dividend payments for the last 20 years or more. Indeed, the defensive investor might be justified in limiting his purchases to those meeting this test.”

Two decades of uninterrupted dividend payments is indeed a test of quality. This is especially true with today’s mergers, acquisitions, spin-offs and other corporate restructuring activity. Only a minority of U.S. businesses survives for more than two decades in its same form, and an even smaller minority manages to make regular dividend payments for the entire period.

Dividends are not just for retirees looking to supplement their income. Dividends, when reinvested, provide the fuel for compound interest.

By example, it took 17½ years for the Dow to go from 10,000 to 20,000—4.2% compounded annual return, not including dividends. In fact, while, the index has returned 101% from March 29, 1999 (when it first closed above 10,000), when dividends are included, the total return becomes 205%. In other words, more than half of the return for investors during that time was delivered by dividends.

Another quote of importance from Graham came from his book Security Analysis. “It may be said with some approximation to the truth, that investment is grounded on the past whereas speculation looks primarily to the future… For investment, the future is essentially something to be guarded against rather than to be profited from. If the future brings improvement, so much the better; but investment as such cannot be founded in any important degree upon the expectation of improvement.”

A look toward the future would appear to be the primary motivation of those allocating monies to some of the Internet and information technology companies responsible for an outsize portion of returns in 2017.

The nose-bleed valuations of some companies in these sectors can only be rationalized with the hope of a bright future. Like Graham, we consider such an approach speculative.

That is not to say we don’t invest in any technology shares, but it has long been a sector where 1.) the probability of being displaced is high and 2.) companies that pay and have a history of increasing dividends are in short supply. The two factors are related, in our view.

We favor companies that pay regular cash dividends year in and year out, have a strong propensity for making annual dividend hikes, and, in our view, can ride out the ups and downs of the business cycle.

Some of the tech companies we do own include Harris Corporation, Analog Devices, and Visa (more of a financial, but classified as a tech company by S&P).

Harris Corporation

In 1890, annoyed by the slow speed of manually feeding paper into a press that was printing flyers for their jewelry business, brothers Charles and Alfred Harris built an automated feeder to speed things up. Harris Corp. would expand into numerous manufacturing areas and achieve many firsts, including a bombsight development in World War II that allowed precision blind-bombing from high altitudes. The innovation helped speed the end of the war. Today there are six “core franchises” at Harris Corp: Space and Intelligence, Air Traffic Management, Weather, Electronic Warfare and Avionics, Tactical Communications, and Geospatial Systems. Harris builds the critical advanced technology that helps run the government’s most important systems.

Analog Devices

Over five decades ago a couple of MIT graduates named Ray Stata and Matthew Lorber recognized a growing market for high-performance operational amplifiers, which precisely amplified and modified electrical signals. The two men founded Analog Devices and, within three years, sales reached $5.7 million. By the 1970s Analog Devices would expand its product lines, and its technology would travel to deep space with NASA. The company would participate in many of the major consumer technology trends of the ’80s, including desktop computers and CD players. Analog Devices hasn’t stopped innovating, with its technologies showing up in digital cameras, smart phones, and the Internet of things, among thousands of other applications.

Visa

In 1958 Bank of America launched the first consumer credit card for middle-class Americans and small to medium-sized merchants. The business grew rapidly, going international in 1974 and adding a debit card in 1975. In 1976 the Bank Americard became Visa. In 2008 Visa went public on the New York Stock Exchange. Today Visa operates the world’s largest consumer-payment system, with nearly 2.5 billion credit and other payment cards in circulation across more than 200 countries. Visa is the #1 player in the electronic payments industry, with a market share of nearly 60%. Visa connects and clears transactions between banks and merchants. The company’s vast network creates high barriers to entry and a durable competitive advantage.

A Global Approach

Our Retirement Compounders® is a global portfolio. We invest in domestic as well as foreign dividend-payers. Over 70% of the world’s publicly traded companies are located outside of the United States, and 40% of the revenue of S&P 500 companies is generated abroad. If you aren’t investing globally and following the global economic landscape, you don’t have the whole investment picture.

Investing globally tends to fall in and out of favor. Like most assets, sentiment regarding foreign issues tends to improve with past performance. When foreign markets are up, everybody is a global investor; but when foreign markets are down, global portfolios are frowned upon.

The savvy investor recognizes ahead of time that investing globally means his portfolio will not always be in sync with the U.S. market. From year-end 2013 through year-end 2016, foreign shares lagged the U.S. market by over 60 percentage points. YTD there has been a reversal, with foreign stocks outperforming the U.S. by about seven percentage points. The foreign stocks we manage for clients are up more than 23% YTD. (Individual portfolio performance will differ.)

The Emerging Markets Comeback?

Emerging markets have been one of the best-performing segments of foreign markets YTD. The MSCI Emerging Markets Index is up over 33% in 2017. The financial press is writing stories about the return of growth in the emerging world, how a global synchronized recovery is helping emerging market stocks, and how emerging shares are cheap relative to the U.S. We wouldn’t dispute any of this; but like its S&P 500 counterpart, MSCI Emerging Markets is a tech-heavy index. Information technology accounts for almost 30% of the MSCI index today. How have emerging market technology shares performed in 2017? The MSCI EM Technology Index is up 65% YTD. Some of the top technology stocks in the MSCI Emerging Markets Tech Index are Tencent, Samsung, Alibaba, Taiwan Semiconductor, and Baidu. Like the FAANG stocks, all five are highly priced on the expectation of significant future improvement. Take out technology and emerging market returns don’t look as impressive.

The foreign stocks we include in our Retirement Compounders® portfolios aren’t as sexy as Baidu or Tencent. We favor stodgy and predictable businesses, some that have been in business for a century or more.

Husqvarna Group

Take Husqvarna Group, a recent addition to some portfolios. In 1689 Husqvarna started its life as a rifle manufacturer, using the waterfalls in Huskvarna, Sweden, to power its factories. Through the 1800s, the company would expand into sewing machines, kitchen equipment, and bicycles. In the 1900s, Husqvarna really took stride. In the first years of the new century, Husqvarna began producing motorcycles and push lawn-mowers. Later in 1947, the company would run its first tests on lawn mowers with engines. In the late ‘50s, demand for Husqvarna’s motorcycles would decline, and by the late ’70s and early ’80s, it was focusing heavily on outdoor power tools. Today Husqvarna is the world’s largest producer of outdoor power products. The company is pioneering new tools like robotic lawn mowers and robotic demolition equipment.

Nestlé

Founded in the 1860s, Nestlé is the world’s largest food company. Today Nestlé owns a world-class stable of brands, including household names Nescafe, Carnation, Stouffer’s, Gerber, Kit Kat, and Purina. Nestlé has focused intently on marrying nutrition with its food sales strategy. Despite being a producer of many snack foods, Nestlé has begun a shift toward foods with specific healthy attributes. In 2016, Nestlé supplied 207 billion servings of fortified foods to its customers around the world.

Severn Trent

In the 1970s, England and Wales consolidated their thousands of local water and wastewater companies into 10 regional water authorities. In 1989, these authorities were privatized, including one which became Severn Trent. The water company now has operations in the U.K., Ireland, and the U.S. Severn Trent is one of the largest water utilities in the U.K., providing service to more than 4.2 million homes and businesses.

Gold

Most major U.S. indexes are up double digits on the year. Do you know what else is up double digits? SPDR Gold Trust (GLD). At the beginning of the year, had you laid out a scenario for me noting that U.S. indexes would be up double digits, there would be no major growth in the rate of inflation, and the Fed would continue to raise interest rates and move forward with a balance sheet unwind, I would have said gold would likely struggle. Part of gold’s rise could be due to heightened concern over North Korea. Another concern could be too much liquidity in a global economy that is improving, or investors may be concerned that the end of the cycle in the economy or the stock market (or both) may be nearing. We own gold as an insurance policy. When bad things happen, gold tends to perform well. On the flip side, when gold is down in value, most often many other investments in a properly diversified portfolio will be up.

Have a good month. As always, please call us at (888) 456-5444 if your financial situation has changed or if you have questions about your investment portfolio.

Warm regards,


Matthew A. Young
President and Chief Executive Officer

P.S. In a November 17th post on his blog richardcyoung.com, my dad questions if the United States is prepared for a second Cold War with China. My dad points to several issues raised by Pat Buchanan in The American Conservative:

While China is a great power, she has great problems.
She is feared and disliked by her neighbors. She has territorial quarrels with Russia, India, Vietnam, the Philippines, Japan. Moreover, the monopoly of power now enjoyed by the Communist Party and Xi Jinping mean that if things go wrong, there is no one else to blame.
Finally, why is the containment of China in Asia the responsibility of a United States 12 time zones away? For while China seeks to dominate Eurasia, she appears to have no desire to threaten the vital interests of the United States.
Are we Americans up for a Second Cold War, and, if so, why?

P.P.S. Jerome Powell was nominated by President Trump to be the next chair of the Federal Reserve. Powell is currently a member of the Federal Reserve Board of Governors. He was appointed by President Obama in 2012. Powell is a lawyer by training. He was a partner at The Carlyle Group—a private equity firm. He also served as an assistant secretary and undersecretary of the Treasury under President Bush. The financial press has been critical of the fact that Powell would be the first Fed chief in decades without a Ph.D. in economics. We view this as a resounding positive. The Fed has been dominated by Ph.D. economists for years and the results have been boom-bust, boom-bust, boom-to-be-determined. Wall Street views Powell as a continuity pick. He is expected to follow Janet Yellen’s playbook for normalizing monetary policy, but he is thought to have a lighter touch approach to financial regulation. We were excited to see President Trump move on from Chair Yellen, but we were hopeful he would have chosen a Fed chair who would have pushed for a faster normalization of monetary policy.

P.P.S. Steve Forbes argues the need for a stable currency and believes the best way to achieve this is to link currencies to gold:

Everyone understands the basic need for fixed weights and measures in daily life: the amount of liquid in a gallon, the number of ounces in a pound, the number of minutes in an hour. None of these amounts fluctuate; they are unchanging.
Just as we use a scale to measure something’s weight, we use money to measure the value of products and services. If the measuring rod itself becomes unstable, the smooth functioning of an economy is disrupted, just as our lives would be if the number of minutes in an hour constantly fluctuated.
Unstable currencies are like viruses in your computer—they corrupt those “bits” of information. Destructive bubbles result, such as the housing frenzy preceding the 2008-2009 crisis. In 2001, a barrel of oil cost little more than $20. Then the U.S. Treasury Department and the Federal Reserve deliberately began weakening the dollar in the mistaken belief that this would stimulate more exports and economic growth. Petroleum rocketed to more than $100 a barrel. Other commodities behaved in similar fashion. These surges didn’t come about because of natural demand but because of a declining dollar.
Nevertheless, most people took to heart the message that the rising prices seemed to convey: All these things were becoming dearer. The misinformation conveyed by prices resulted in hundreds of billions of dollars being misinvested, particularly in the building of houses.


Navigating a High Priced Market with Solid Economic Growth

October 2017 Client Letter

A Supportive Environment

Today we have what appears to be a supportive environment for the stock market. Economic growth, both in the U.S. and globally, has picked up. For the first time since 2014, GDP growth has accelerated to more than 3% for two consecutive quarters. The global liquidity environment remains robust, with the European Central Bank and the Bank of Japan still pumping money into the global financial system. Long-term interest rates remain low by historical standards. Business and consumer sentiment are at highs not seen in years, and corporate profits are rising at a rapid clip, with the prospect of an added boost coming from lower tax rates in 2018.

That hasn’t been lost on the stock market. Investors have bid up shares aggressively over the last 12 months. The S&P 500 is up over 23% since this time last year. And the rally has been relentless. Volatility has all but disappeared. According to MarketWatch, the S&P 500 hasn’t had as much as a 3% correction since November of last year. That is the longest such streak on record.

Sentiment Through the Roof

Investor sentiment is through the roof. The Investors Intelligence Survey’s sentiment numbers show the widest divergence between the number of bulls and bears in 30 years. Young Research’s bubble basket—a group of stocks we consider to be over-owned, over-loved, and over-priced—is up almost 50% YTD. The five most valuable stocks in the S&P 500 are now Apple, Amazon, Microsoft, Facebook, and Google. Their collective profits over the last 12 months are about $105 billion and their total market value $3.06 trillion. That works out to a P/E ratio of over 29X. I am reading about former Target sales managers quitting their jobs and getting rich by shorting volatility ETFs. Really? It probably isn’t a reach to suggest that risk isn’t at the forefront of investors’ minds today.

Valuations Near Record-Highs

The universal enthusiasm of the stock market at what are near-record valuations is difficult to understand for investors such as ourselves who are focused on long-term returns. Starting valuations are the most reliable guide to future long-term returns. But valuations are neither a precise indicator of future returns nor a useful timing indicator. The best one can do with the knowledge that valuations are elevated is to assume that future performance is likely to be much lower than past performance.

How much lower? In almost seven decades of market history, the S&P 500 price-to-sales ratio has never been higher than it is today. That includes during the stock market bubble of 2000. Robert Shiller’s cyclically adjusted price-to-earnings ratio is also near prior-bubble highs. Shiller’s P/E smooths earnings to adjust for cyclical fluctuations. Stocks have only been more expensive by Shiller’s metric at the height of the 1929 stock market bubble and during the 2000 bubble (see charts below).

How Do Bull Markets End?

Recessions are most often what end bull markets. Valuations were at record highs in the late 1990s, but it wasn’t until the 2001 recession that the stock market really cracked. When it did, stocks, of course, fell by more than half from their prior high and wiped out almost all of the 104% gain in the S&P 500 from year-end 1996 to the March 2000 high. Valuations would have told you future returns were going to be low in 1997, 1998, and 1999, but that didn’t come to pass until the recession.

That doesn’t mean all bull markets end from recession. The stock market crash in 1987 wasn’t caused by recession. The 1987 crash was caused by a market that had risen too far too fast and by program trading, a market structure issue. One could make similar arguments about 2017. Stocks have run quickly over the span of a year, and there are market structure issues that could exacerbate any sell-off. The chart below shows the 1987 crash in the S&P 500. After rising almost 40% in the first eight months of the year, the stock market fell 33% over the ensuing two months with a 20% loss on October 19, 1987. For perspective, a 33% loss on the S&P 500 today would push the index down to 1,730 from 2,880 today and wipe out four years’ worth of returns.

OK, then. Stock market valuations are elevated and present long-term risk, but the current environment is supportive of markets. How does one navigate such an environment? As we regularly advise, select a strategy and allocation that fits your personal financial situation and stick with the plan through thick and thin. Ignore what the FAANGs are doing. In our view, they aren’t appropriate investments for retired investors and those soon to retire. Don’t pay attention to the newly minted millionaires that are shorting volatility—they may very well be wiped out in the end. Stay in your own boat and follow the course you have plotted for yourself.

My dad is one of the most adept people I know at sticking to an investment plan, regardless of whichever mania or panic of the day is distracting advisors, pundits, and investors. He recently posted what I consider to be a must-read for our clients at his new investments site (www.youngsworldmoneyforecast.com):

“With the exception of the large sums of money that I invested in zero-coupon treasuries (Benham Target Funds) in the 1980s and 1990s, I have never invested based on how much money I expected to make. I work to make money. And I save to keep every dime of the money I have worked a lifetime to earn. There was a day when I had darn few of those dimes. Those days made an indelible impression on me, and will so forever.

I invest with a rolling 10-year average annual return portfolio target of a balanced 4+%. This modest target is based on the normalized annual portfolio draw I advise for retired investors. Long-term balanced targets include surviving through agonizing periods of negative returns for the stock market in general. I remember like it was yesterday the tortuous 16-year bear market of 1965 through 1981. This period encompassed my entire career in the institutional research and trading business. It terminated with the Dow down 10% from where it began. Had I not emphasized 100% fixed income in my own account and in our college savings program for Matt and Becky, my goose would have been cooked. It never pays to be an investing know-it-all.

My investments today, for me and for all our clients, combine a mix of intermediate and short fixed-income securities and portfolios of dividend-paying stocks. Annual dividend increases are always at the forefront of my investment process. Ben Graham advocated a portfolio mix of 75/25—25/75 fixed income and equities. Ben eschewed moving outside of this range, and I’ve never come across evidence that supports otherwise.

Since my earliest investing days in the 60s, I have relied upon the ground rules and reference material I studied while an investment major at Babson College. It was based wholly on the advice given in my Graham & Dodd textbook and my studies in Dr. Wilson Payne’s investment seminars. Decades later, I’ve not changed my philosophy.

Through the years, I’ve had the privilege of influencing the investment thought process of thousands of individual and corporate investors around the globe. Many have been my management clients since I started Richard C. Young & Co., Ltd. in the late 80s, and the majority would likely agree with me that I am perhaps the most consistently boring, prudent, patient investment advisor on the planet. I certainly hope this is so. Like The Hobbit, I view adventures (in this case investing adventures) as “nasty disturbing uncomfortable things” that “make you late for dinner.”

I am ultra-conservative in my daily affairs of life, which includes personal security preparation, and I see no purpose in not applying the same protection to financial security.

I modeled our family company after the old-line investment counseling family-run firms that populated Boston’s financial district along State, Federal, Milk, and Congress streets in the sixties—a harking back to a more gentrified era in investing. Many of these fine old white-shoe firms were my clients when I was associated with the internationally focused Model Roland & Co., where I was involved in institutional research and trading.

My clients, such as the venerable Boston Safe Deposit & Trust, State Street Bank & Trust, and First National Bank of Boston, built their foundation on The Prudent Man Rule.

The Prudent ManRule directs trustees “to observe how men of prudence, discretion, and intelligence manage their own affairs, not in regard to speculation, but in regard to the permanent disposition of their funds, considering the probable income, as well as the probable safety of the capital to be invested.”
These are the conservative principles our family investment council firm practices. Our firm’s focus from the beginning was, and today is, based on The Prudent Man Rule along with the theories of dividends and compounding pioneered by Ben Graham.

Over the decades, I’ve learned that most individuals do not possess the requisite patience and discipline to excel as successful long-term investors. The patience-deprived universe tends to be what I think of as needy hip-hop investors. They look for the financial markets to either bail them out of past investing indiscretions or, worse yet, to produce rewards far beyond reasonable levels of commensurate risk. Our family investment management firm does not offer the type of environment suitable for the needy or greedy.

The needy and greedy tend to possess an investor twitch that requires action—lots of action. This crowd looks to market timing, second-guessing, and what-if-ing. Most of the big moves in any investment cycle come in the year or two after the exact bottom of a cyclical bear market.

Well, market timers most often sell out late in bear cycles, and then are too afraid to get back into the market in time to catch the initial upsurge. The needy/greedy tend to miss the big gains every time.

At Richard C. Young & Co. Ltd., our goal is to remain balanced as well as fully invested. This repetitive plan, definitely counter-intuitive to many investors, ensures never missing the big moves. It also requires never participating in any meaningful way in the bubble or blow-off stage of over-priced markets that are on the precipice of cratering and wiping out a lifetime of savings along the way. No thanks. I long ago learned this bedrock principle.

Today’s investment landscapes and processes have become so difficult that for most individuals going it alone, especially while preparing for a safe and secure retirement, is no longer comforting or attractive. Many of the old standby bastions of investing are no longer an option. I am referring to the vast majority of all-managed equities mutual funds and a wide swath of the indexing ETF universe. The fund industry has simply outgrown its skin. Funds have grown too big, and their options in dividend-paying common stocks are too few, due to size constraints for massive funds. This is only common sense.

With minor exceptions, I no longer advise these out-of-phase funds. Rather, stocks of individual dividend-paying companies including smaller concerns and foreign securities, are our focus for clients. At our management company, we craft what we label Retirement Compounders® portfolios.

Investing in foreign securities is not the province of the individual investor or, for that matter, most advisors. Having been directly involved in researching and trading in foreign securities since 1971, I can assure you that process presents a sticky wicket best left to experienced hands. Markets are thin, currency valuations enter the picture, and macro events often call the tune in foreign securities investing.

I travel to Europe frequently. Decades of on-the-ground anecdotal evidence-gathering and personal contacts allow me to form the direct knowledge imperative in the decision making of investing in foreign securities. With the exception of my old stomping grounds in Boston, I am more comfortable today in Paris, by example, than any big U.S. city. More international decision makers and event making potentates visit Paris annually than any other city in the world. On each new visit, I gather a wealth of intelligence to support my global investment strategy. This boots-on-the ground anecdotal evidence-gathering, in conjunction with my decades of daily inference reading, allows our firm to offer clients a distinct perspective on the international investing landscape.”

Have a good month. As always, please call us at (888) 456-5444 if your financial situation has changed or if you have questions about your investment portfolio.

Warm regards,


Matthew A. Young
President and Chief Executive Officer

P.S. Each year, Barron’s ranks the nation’s top independent advisors. Richard C. Young & Co., Ltd. was again recognized on this list, appearing for the fifth consecutive year.


Hurricane Preparation and Investment Planning

September 2017 Client Letter

It’s unsettling when The Weather Channel and CNN camp out in your town to cover an incoming hurricane described as the biggest storm ever recorded in the Atlantic. Hurricane Irma was massive, with winds of at least tropical storm force covering 70,000 square miles—larger than Florida’s entire land area. Just several days prior to landing in Naples, it appeared Irma would track the east coast of Florida, more towards Miami, leaving our hometown in a much more desirable position.

But hurricanes, as with many things in life, are unpredictable. Irma blew into Naples as a Category 3, which was somewhat of a relief considering earlier threats of a Cat 4. We also dodged the storm-surge bullet, which could have caused flooding as high as 15 feet in areas. All told, the consensus is that Irma provided us with a scary, expensive, and exhausting ordeal, but we caught some breaks and avoided a more devastating outcome.

I want to thank you all for your kind wishes during Hurricane Irma and its aftermath. I am relieved to report that our Naples staff and their families made it through the storm safely. I am also happy to report that our new offices at 5150 Tamiami Trail North made it through the storm unscathed. As soon as power was restored to the office, we were back up and running at full capacity.

With Hurricanes Harvey and Irma still fresh in my mind, I want to take this opportunity to reassure you of our business continuity and disaster recovery plans. I know some of you had questions on business continuity during the storm.

We pride ourselves on being a boutique registered investment advisor that offers exceptional customer service and support to our clients. Our goal is not only to provide you with a professionally managed investment portfolio that meets your personal goals and objectives but also to ensure your investment and administrative questions are answered promptly and professionally.

The business continuity plans we have in place are updated and evaluated regularly for improvement. Having offices in both Naples, Florida, and Newport, Rhode Island, gives us the advantage of being able to continue to operate if and when one office goes down. In preparation for Irma, we powered down our Naples systems and prepared the office for a Category 5 hurricane. While the Naples office was closed and without power, our Newport office picked up the slack. We share staff, data, and information across locations for just such an occurrence. At no point during the hurricane was our Newport staff lacking your vital account information or unable to fulfill our portfolio management and oversight duties for your assets.

Safe and Secure with Fidelity

Your assets were, of course, safe and secure with Fidelity during the hurricane. Fidelity is one of the largest brokerage firms in the country, with its robust technology setup. Fidelity has redundant systems in multiple locations across the country to help ensure continuous operation in the event of a disruption at any one. We have also partnered with Envestnet for portfolio management and reporting software. Envestnet is one of the leading software providers to the financial industry. Data security and redundancy are an important component of their business. Envestnet’s software provides us with access to critical account information and holdings data that can be accessed both onsite and remotely. So, in the unlikely event that both our Newport and Naples offices are ever simultaneously without electricity, we could relocate staff to a location with power and conduct our business from there.

In short, we have planned for and prepared for many conceivable disaster scenarios to ensure proper oversight and management of investment portfolios. I hope you feel as comfortable as I do with our firm’s preparations.

Preparation and planning are not only part of our disaster recovery and business continuity efforts; they are also central to our investment management approach. Trying to time when the next financial disaster will strike is not a part of our investment strategy. Instead, we construct portfolios we believe can live to fight another day should another 2008–09-style crisis roil markets again. Preparation and planning for such a risk is part of the reason we include gold and precious metals in client portfolios.

Eschew Gold at Your Own Peril

In our view, too many investment advisors eschew gold. They criticize gold and the folk who invest in gold. They proclaim there are better ways to protect one’s money from inflation, geopolitical turmoil, a falling dollar, or a financial crisis. They view gold as an inferior asset class based on statistical evidence of gold’s performance over the past few decades. But the performance of gold over a few decades is insufficient to judge its true value. There is no other asset that matches gold’s history as a store of value and a medium of exchange—not fiat currency, bitcoin, oil, copper, wheat, nor bonds, and not even stocks. Gold has been widely accepted as a store of value and a medium of exchange for millennia. To ignore that history is, in our opinion, both foolish and naïve.

I doubt savvy financial advisors in Argentina or Venezuela would be so critical of gold. The chart below shows the price of gold in pesos and bolivar rebased to 100 at year-end 1998. The price of gold is up about 80X in both currencies. If an Argentinian investor put 500 pesos in gold at year-end 1998 and left another 9,500 pesos under his mattress, he would have 49,500 pesos today. That would still leave him with less purchasing power than he had in 1998, but he would be in a lot better shape than if he owned no gold.

Some may say it is far-fetched to believe that the U.S. could end up like Argentina or Venezuela. We agree, but a proper and complete reading of financial history would lead one to take a much more skeptical view of the preeminence of today’s fiat currencies. Gold is an insurance policy for risks both known and unknown.

Bond Market Risks

In the bond market, the risks are known. The two biggest risks a bond investor is faced with are credit risk and interest rate risk. Credit risk is the risk a borrower will default on its debt. Interest rate risk is the risk arising from fluctuating interest rates. Interest rate risk depends on the maturity of a bond. Everything else equal, the longer the maturity of a bond, the greater the interest rate risk.

Current Fixed-Income Strategy

For a number of years now, as interest rates have muddled along at historic lows, our fixed-income strategy has been to invest in short maturity bonds and to then roll the proceeds of maturing issues into higher-yielding securities.

Why Invest in Short Maturity Bonds?

With rates near their lowest levels in 5,000 years of recorded history, we don’t believe investors are being adequately compensated for taking interest rate risk. The U.S. is in year nine of an economic expansion, and 10-year Treasuries yield a full percentage point less than they did in the aftermath of the Lehman Brothers bankruptcy.

A Model of Interest Rates

A simple model that estimates the long-term level of interest rates based on the rate of economic growth, inflation and short-term interest rates shows 10-year Treasury bonds should be yielding at least 3.6% today. And if by the end of next year the Federal Reserve’s forecasts for the Federal Funds Rate, growth, and inflation are realized, this model would expect 10-year Treasury yields to rise to 4.3%. That’s a full two percentage points more than current yields.

Two percentage points may not sound like much, but a two-percentage-point increase in 10-year Treasury rates would wipe out seven years of interest income on a 10-year Treasury note.

We are not forecasting a two-percentage-point increase in interest rates over the next 15 months, though there may be a higher probability of that happening than many investors assume today. What we are saying is that the risk investors are taking in long-term bonds is not sufficient for the reward being offered. Not when you can invest in ultra-short-term Treasuries (you know them as T-bills) that maximize liquidity and optionality while paying investors an assumed risk-free 1.1% stream of income.

Over the last year or two, we gradually added a T-bill component to many fixed-income portfolios. This new addition has gone hand in glove with our decision to gradually increase the overall credit quality of our clients’ bond portfolios. T-bills will not become a permanent component of our fixed-income portfolio. We view them as a bridge to what we hope will soon become a higher-interest-rate environment.

When the Facts Change

That is how we assess the fixed-income landscape today, but our view is not set in stone. If the facts change, the economic environment worsens, long-term interest rates rise, or the Fed changes its outlook for short-term interest rates, our view of longer-term bonds could change. Despite the current and forthcoming pro-growth policies the Trump administration is working to put in place, we haven’t lost sight of the fact that this is still year nine of the economic expansion. The average post-WWII-era expansion has lasted just under five years.

Equifax: What Happened?

As you have probably heard if you’ve watched the news in the past two weeks, the credit reporting agency Equifax was hacked. The intruders had months to comb through Equifax’s data, accessing the personal credit information of up to 143 million Americans. If you have a credit card, mortgage, or car loan, there is a strong chance you are on the list of those affected. The accessed information included names, Social Security numbers, birth dates, and even some drivers’ license numbers. Also, the criminals stole credit card numbers from 209,000 people who had purchased services from Equifax.

What’s the Risk?

Today’s world is driven by credit scores. If you intend to get a loan, you will need your credit score in tip-top shape in order to qualify and to get the best rates. If you want to lease an apartment or simply get a new job, bad credit scores can sink your chances. The Equifax hack may allow criminals to take out loans in your name and never pay them back. That could ruin your credit score and suck up your precious time and money as you correct for the fraudulent activity.

What You Can Do

Equifax has set up a website, www.equifaxsecurity2017.com, where you can check on your potential exposure. The site will tell you whether or not you are exposed. If you are exposed, Equifax will let you enroll in a program called TrustedID Premier. TrustedID Premier gives you five complementary services from Equifax, including:

  • A copy of your Equifax credit report
  • Use of Equifax Credit Report Lock, a service that allows you to prevent access to your Equifax credit report by third parties
  • $1 million worth of identity theft insurance
  • Three-bureau credit file monitoring, providing automated alerts when your credit report changes in important ways at any of the three large credit-reporting agencies (Equifax, Experian, and TransUnion)
  • Social security monitoring, which will search suspicious websites for the use of your Social Security number

Enrollment in TrustedID Premier is not mandatory. We are not endorsing TrustedID Premier, but you should know that it is an option available to you.

The free enrollment period ends on November 21, 2017. Whether you choose to use TrustedID Premier or not, the Federal Trade Commission suggests other steps you can take to protect your credit, including:

  • Visit annualcreditreport.com to receive a free copy of your credit report from the three major reporting agencies. Use your free report to check for accounts that you didn’t open or other erroneous information.
  • If you think your identity has already been stolen, visit IdentityTheft.gov to report identity theft and get a recovery plan.
  • Consider a freeze on your credit reports with the three major agencies by calling the phone numbers listed below. Be warned, you will likely be charged a fee. Then the agency will send you a PIN or password that allows only you to unfreeze your report.
  • If you don’t freeze your reports, you can place a “fraud alert” on them. The alert will tell your creditors that you may have had your identity stolen and that they should verify any new activity on your accounts before acting on it.
  • Watch your existing credit card and bank accounts for any odd charges.
  • File your taxes early to prevent someone else from fraudulently filing in your name.

Unfortunately, hacking and identity theft have become a part of modern society. While we can’t prevent your identity from being stolen, in the accounts that we manage for you, we monitor all withdrawal activity and verbally verify transactions that were not initiated by our staff to ensure that the activity is legitimate and was initiated by an account owner.

Have a good month. As always, please call us at (888) 456-5444 if your financial situation has changed or if you have questions about your investment portfolio.

Warm regards,


Matthew A. Young
President and Chief Executive Officer

P.S. The British pound has been on a tear over the last month. The pound is up 6% from its low in August. More hawkish commentary from the Bank of England and a more conciliatory tone from the European Union President on the Brexit negotiations has helped the currency. Your U.K. stock and government bond positions have benefited from the rally. With a solid technical backdrop and strength in other European currencies, we see more room for upside in the pound vis-à-vis the USD.

P.P.S. After a nearly four-decade sabbatical, my dad has revived Young’s World Money Forecast in a new digital-only format. You can read his latest posts at www.youngsworldmoneyforecast.com.

P.P.P.S. In yet another sign of the reach for yield in global bond markets, Iraq recently came to market with a $1-billion bond and an expected yield of 7%. Demand that was more than six times the available supply drove the yield at issue down to 6.75%.


The information contained in this letter is for informational and educational purposes only. It is not intended nor should it be considered investment advice or a recommendation of securities. Past performance is not a guarantee of future results. It is possible to lose money by investing. You should carefully consider your investment objectives and risk tolerance before investing. Please contact our office directly with any questions regarding items appearing in the letter.