Investors Facing an Unusually Uncertain Environment

October 2016 Client Letter

Investors Facing an Unusually Uncertain Environment

Today, investors are facing an unusually uncertain environment. We have a polarizing U.S. election whose outcome could have profound implications for the country and financial markets. The U.S. economy is far from robust and, in our estimation, is in the late stages of the cycle. Geopolitically, there is a broadening quagmire in the Middle East, coupled with increased hostilities with Russia, China, and now the Philippines.

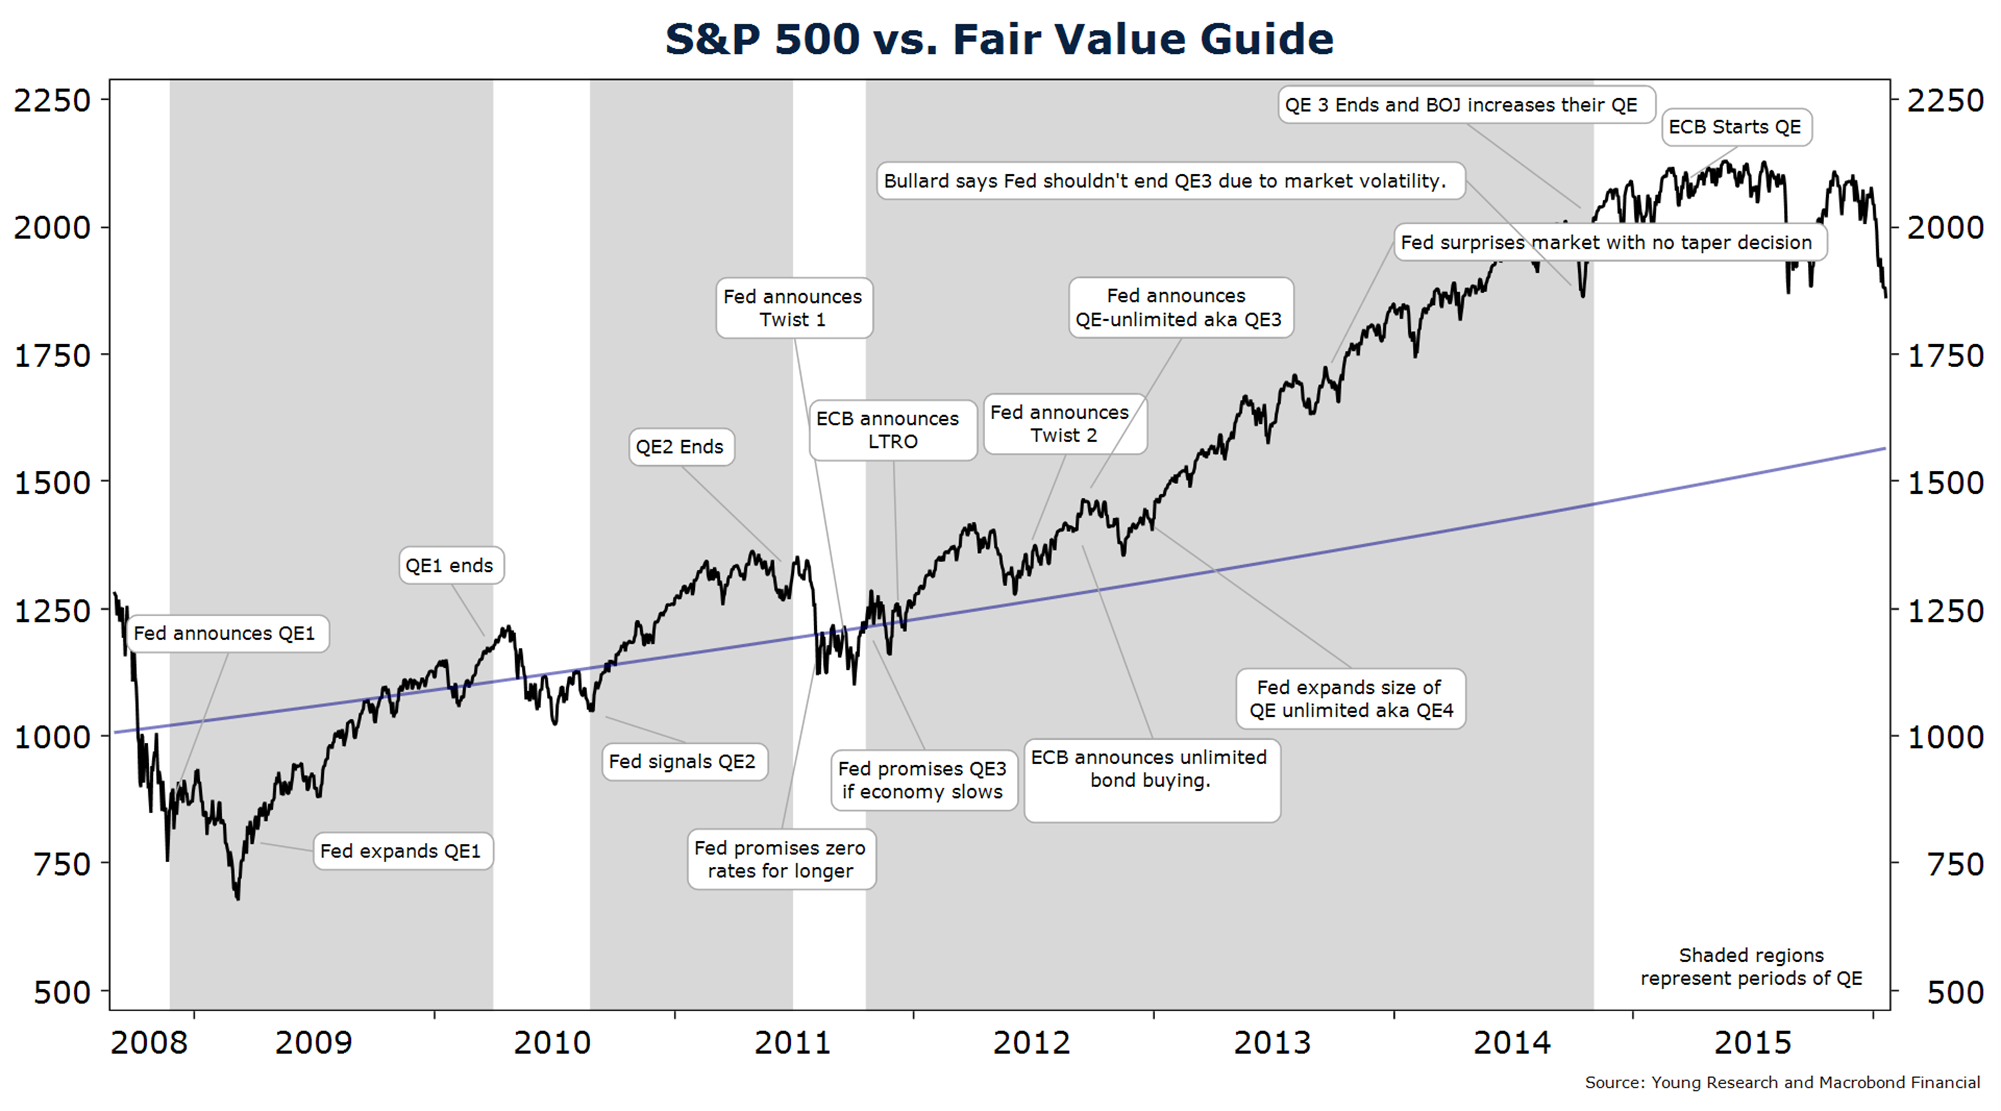
And that is just for starters. Investors are threatened by a sustained period of asset-price distortion and manipulation. The world’s central banks are establishing interest rates at artificially low levels, while at the same time pumping trillions of dollars of liquidity into the global financial system.

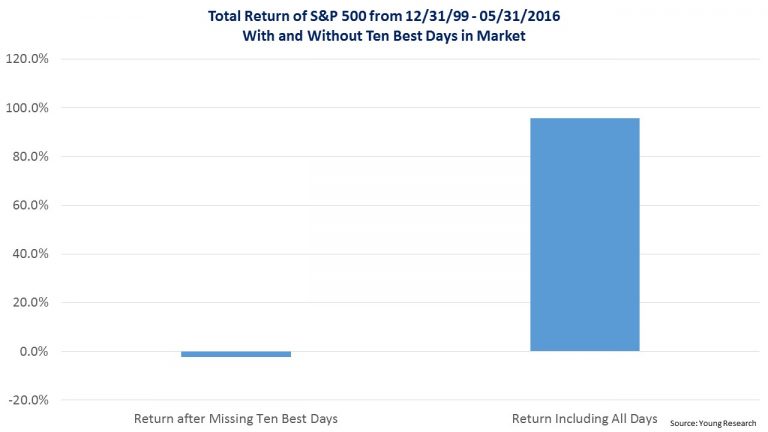
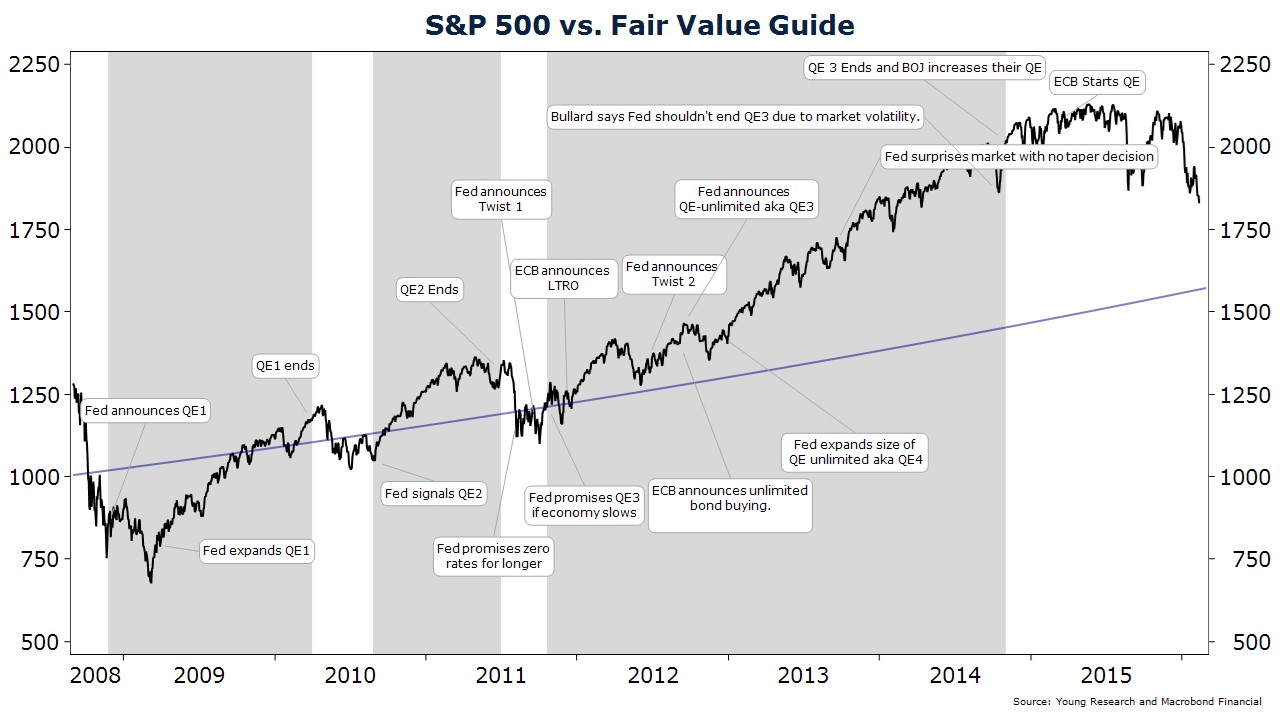
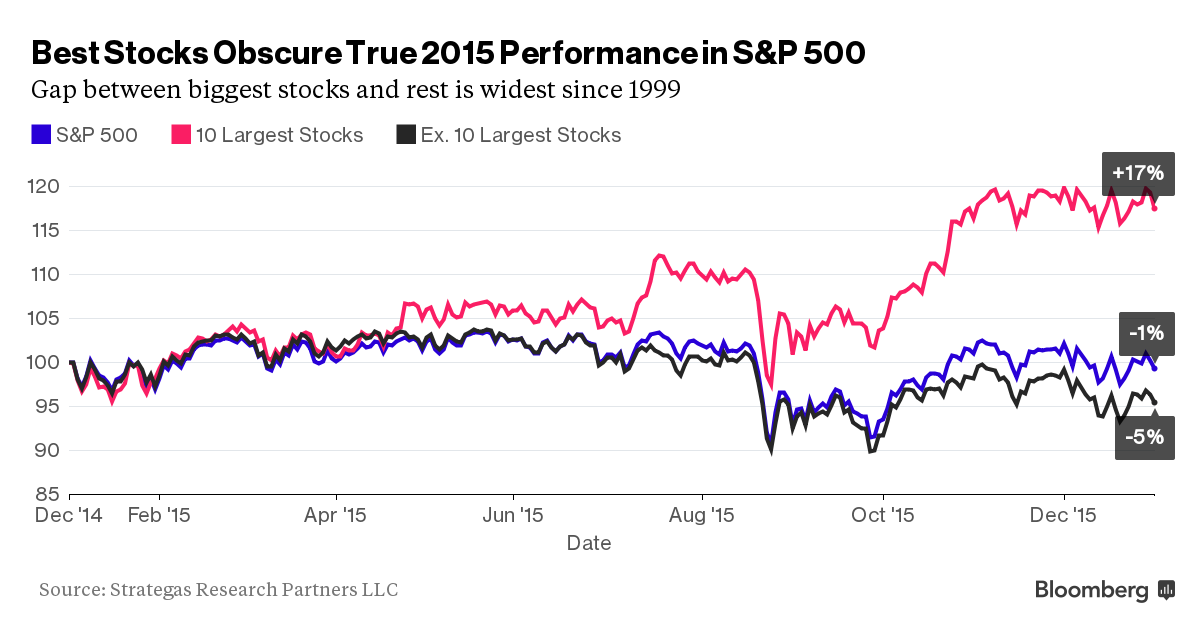
What is the likely outcome of a prolonged period of zero rates and trillions worth of ongoing asset purchases? In terms of the real economy, we will probably see more of the same disappointing results. In terms of the financial markets, zero rates and trillions of dollars in bond buying have ignited another massive reach-for-return environment.

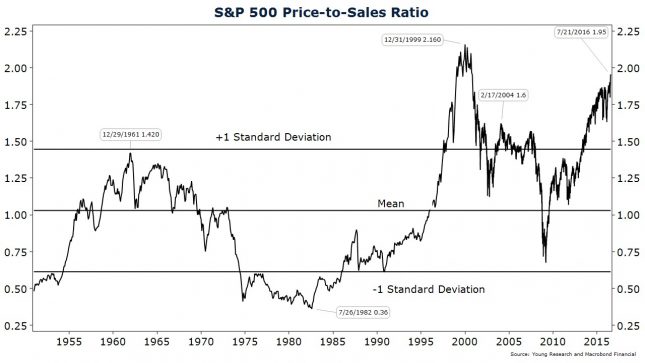
This doesn’t paint a pretty picture, in our view. The last two periods of excessive stock market valuation didn’t end well. And, we are concerned that the unprecedented monetary policies used to elevate asset prices have created a mirage of calm in what we see as a problematic environment.

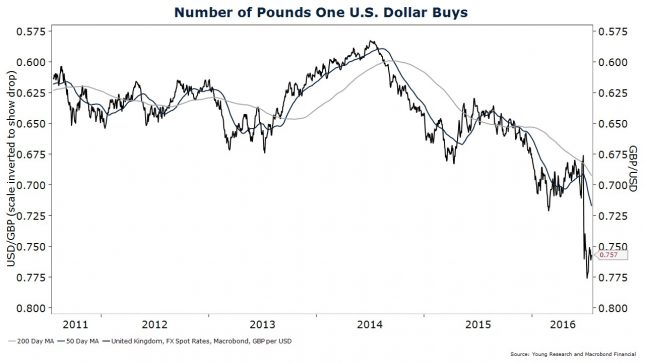
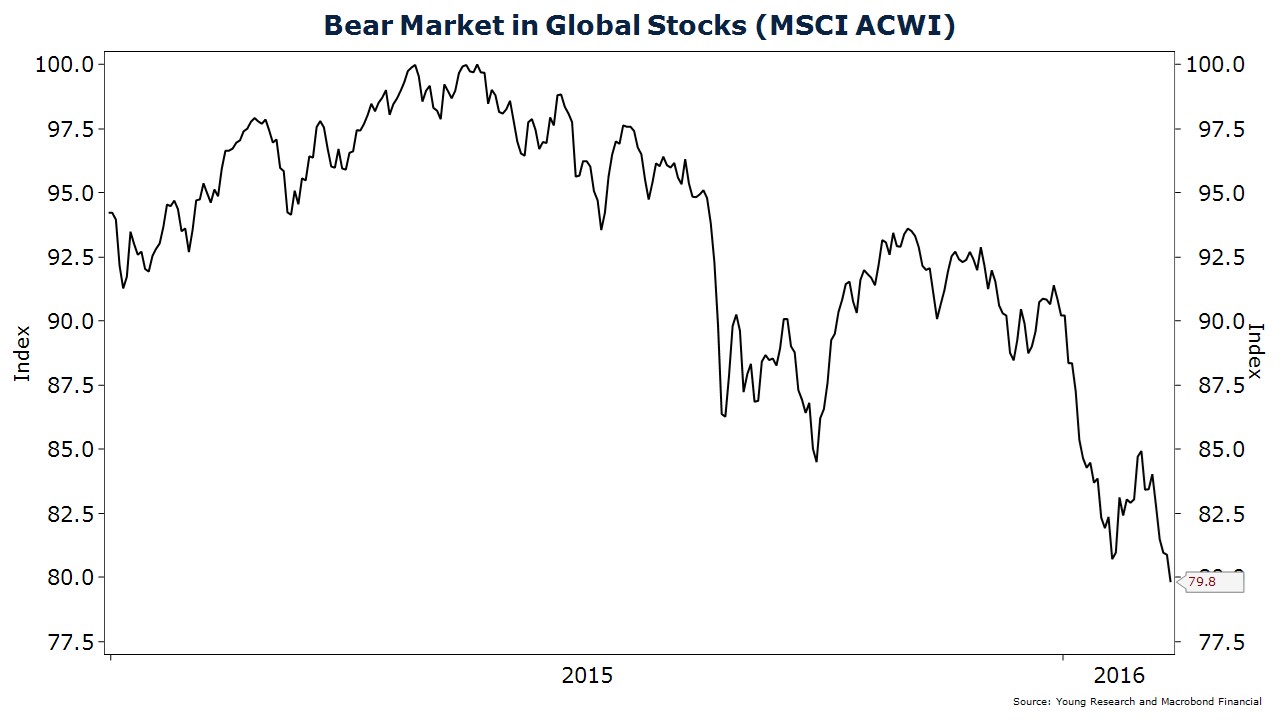
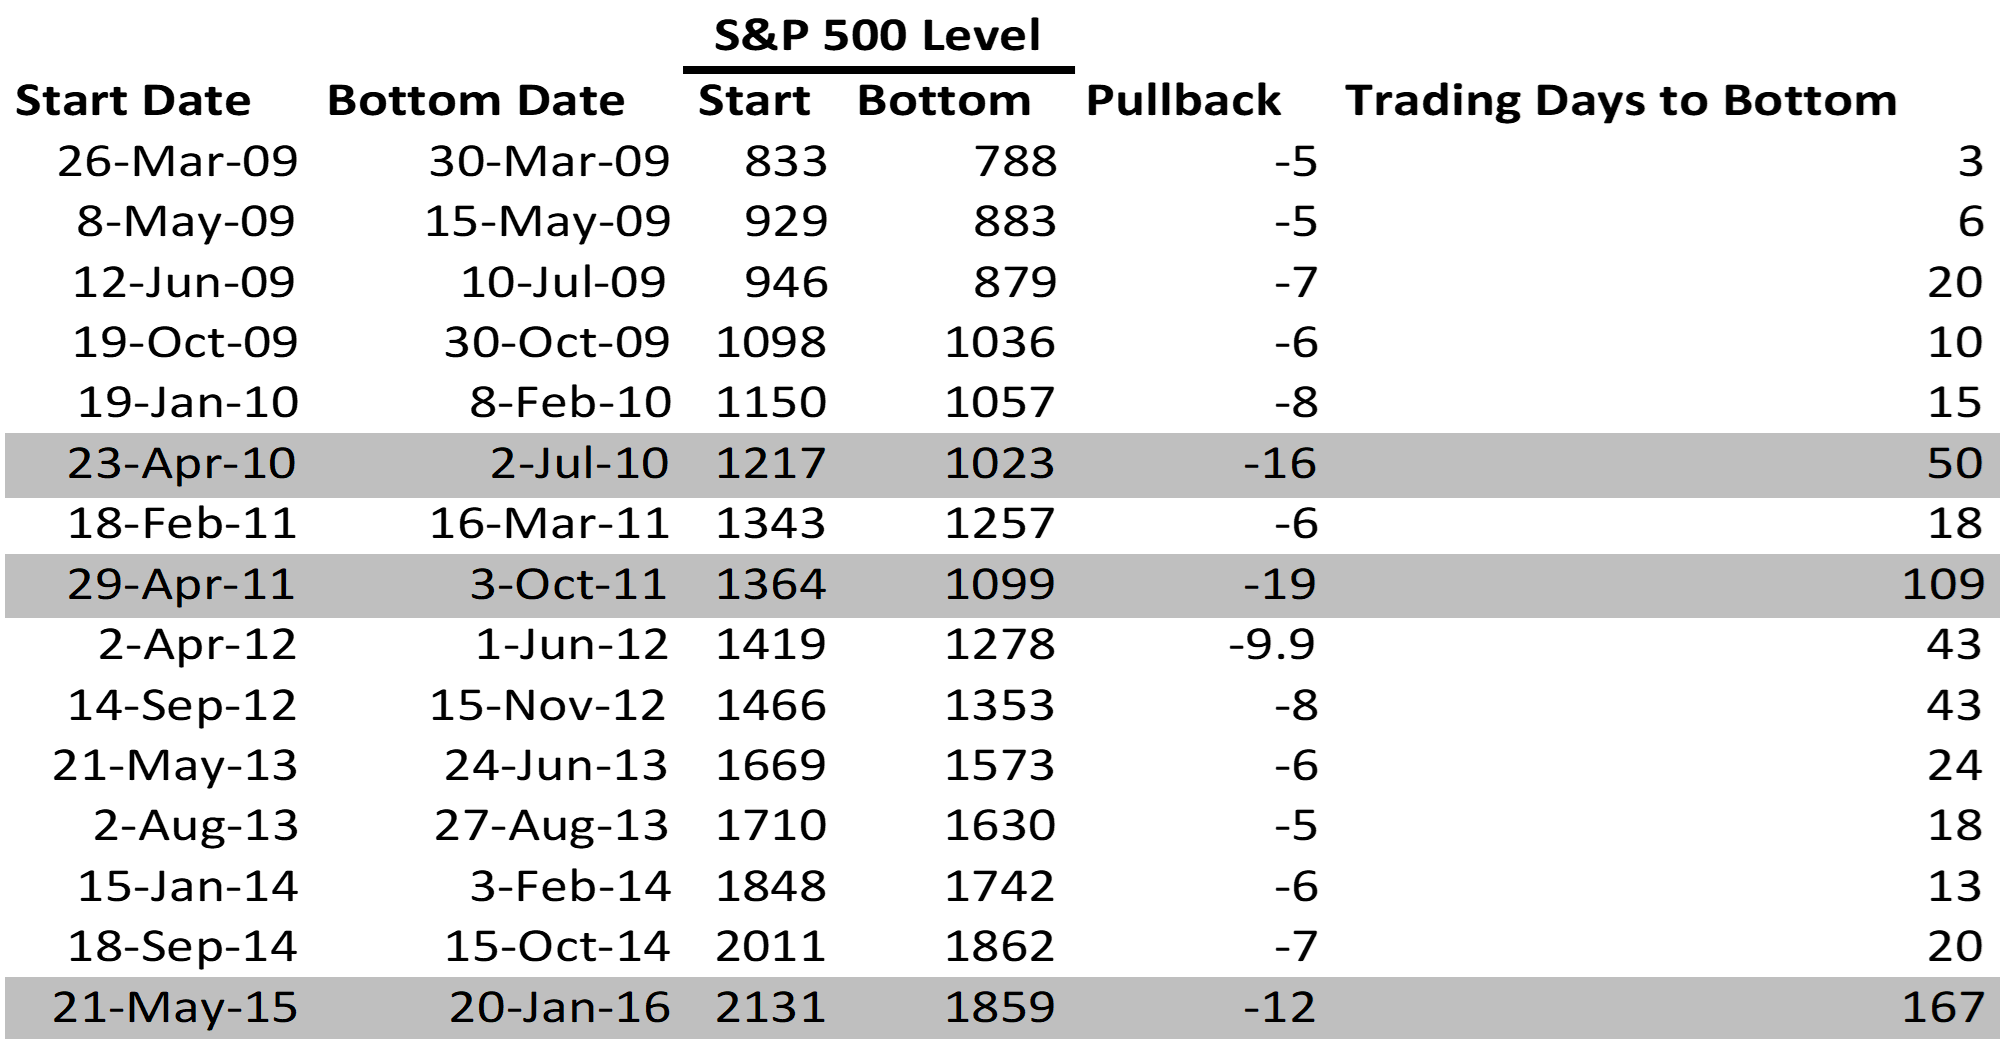
This summer we were reminded of how quickly markets can sell off. In a surprise vote on June 23, the British decided by a 52% to 48% margin to exit the European Union (EU). The vote caught many investors and pundits off guard. Financial markets cratered on the news, with U.K. stocks falling 16% and euro-area shares dropping 13%. The British pound fell over 13%, and government bond yields hit new lows. In the U.S., 10-year Treasury yields dropped to 1.36%—the lowest level in history.

two-day-brexit-fallout-performance-645x363

Many clients share our outlook, and many prospective clients join our family-run firm because they are more comfortable with an investment strategy that incorporates a risk-first approach. Most of the portfolios we craft are designed to deal with what we see as a high-risk, high-uncertainty environment.

How Do We Invest for Clients?

How do we invest for clients to navigate a high-risk, high-uncertainty environment while still generating a steady stream of income?

We invest primarily in individual securities. While exchange-traded fund (ETF) model portfolios seem to be the strategy du jour, at Richard C. Young & Co., Ltd., we emphasize individual securities more so than in the past. While we continue to purchase ETFs and mutual funds, both play only a supporting role in client portfolios.

In our view, the individual stock route is the superior option for equity investing. An individual stock strategy offers the opportunity for maximum portfolio customization and allows a greater focus on companies with strong business franchises as well as long records of paying and increasing dividends.

Today, ETFs make it simple to invest in various sectors, dividend strategies, or even factor ETFs (Wall Street’s latest obsession). But in our opinion, it just isn’t practical to craft an ETF portfolio that provides exposure to our desired characteristics and risk profile without over-diversifying.

That isn’t to say that building a properly diversified common stock portfolio is easy. It can be difficult to assemble a sizable portfolio of dividend-paying stocks. First, there simply aren’t an abundance of dividend-payers to choose from. Second, when qualifiers are added into the selection process, including a focus on higher dividend-payers, the field of play is even further reduced. Third, crafting a diversified dividend-focused portfolio includes international markets and the research and time required to keep up with the global economy. Fourth, discipline is required. It can be easy to allocate too much of a portfolio to a handful of sectors or to the most recent best performers, which ultimately reduces diversification and increases risk.

We Craft Globally Diversified, Dividend-Centric Equity Portfolios

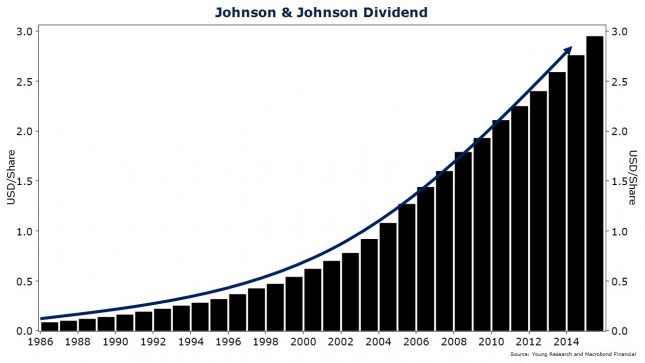
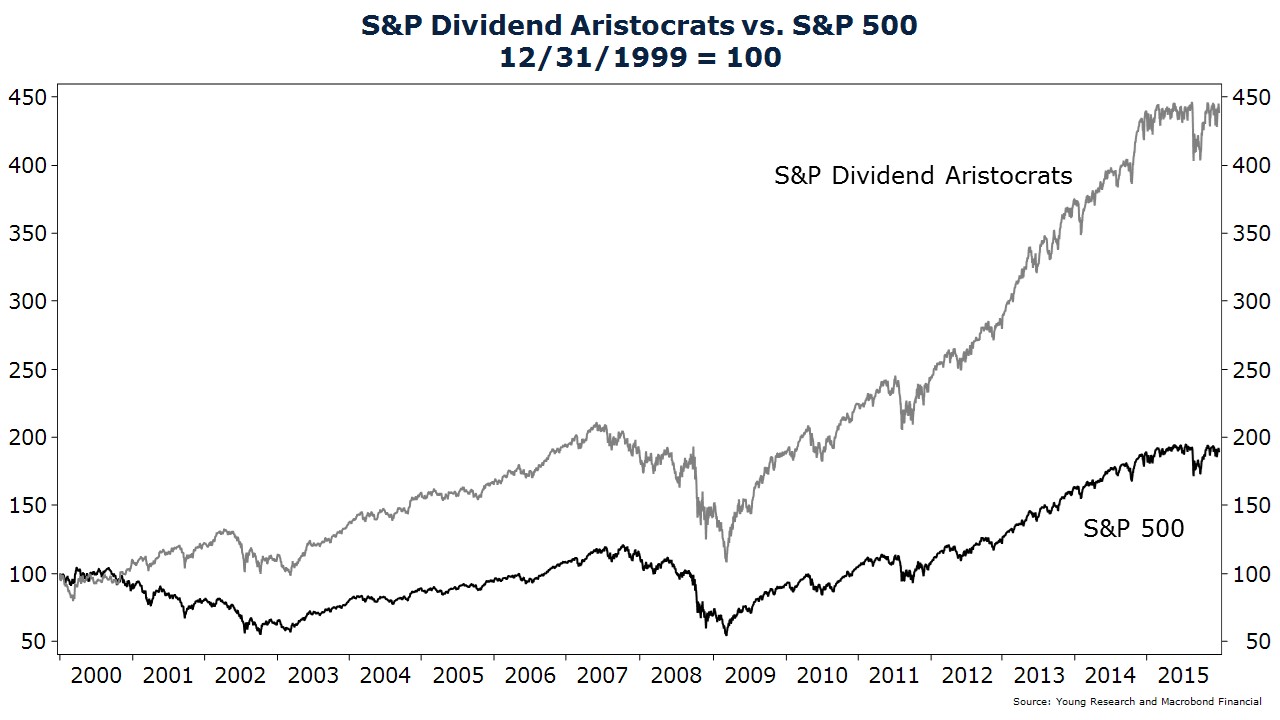
At Richard C. Young & Co., Ltd., we craft globally diversified, dividend-centric equity portfolios that we call the Retirement Compounders®. The Retirement Compounders® invest in companies that pay dividends and have a record of making regular annual increases. Increasingly, our focus is on companies that have increased their dividend for at least 10 consecutive years.

As Benjamin Graham, the father of value investing, once said, “One of the most persuasive tests of high quality is an uninterrupted record of dividend payments for the last 20 years or more. Indeed, the defensive investor might be justified in limiting his purchases to those meeting this test.”

In addition to a strong dividend record, the Retirement Compounders® include companies’ balance sheets that appear strong and operating in industries with high barriers to entry. Companies with durable competitive advantages in the form of brand value or dominance of a unique business niche are also firms we favor.

Coming up with an approved list of stocks to buy is just the first step in our investment process. To assemble portfolios that we think offer the best risk-reward profile, we also carefully consider position sizing, sector exposure, and how each stock moves in relation to other stocks in the portfolio (counterbalancing).

Once portfolios are formed, the work of ongoing portfolio management begins. Here I am talking about the monitoring of portfolio positions, the necessary rebalancing of positions, and annual tax-loss harvesting.

A Decision to Do Nothing Is Still a Decision

Though it may be difficult to judge based on portfolio activity, the ongoing monitoring of portfolio positions is a time-intensive task. Many in the investment industry ostensibly take the view that more trading activity equates to better portfolio management, but a decision to do nothing is still a decision.

And at least speaking from personal experience, the decisions to do nothing are often the most carefully considered and tend to be the most emotionally difficult to make. Managing emotions is one of the most difficult aspects of investing for professionals as well as individuals. Emotionalism is a dangerous foe that, if not properly managed, can sabotage portfolio performance.

The investment programs we offer are designed to cater to varying risk profiles. Most portfolios are globally diversified and balanced between stocks and bonds. But we also offer an all-stock alternative for those who are both willing and able to withstand the risk and volatility of an all-equity portfolio.

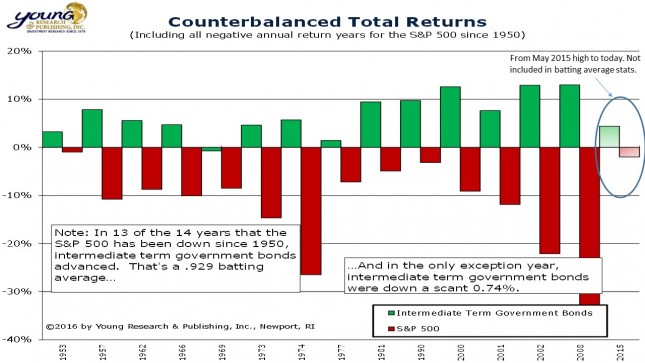
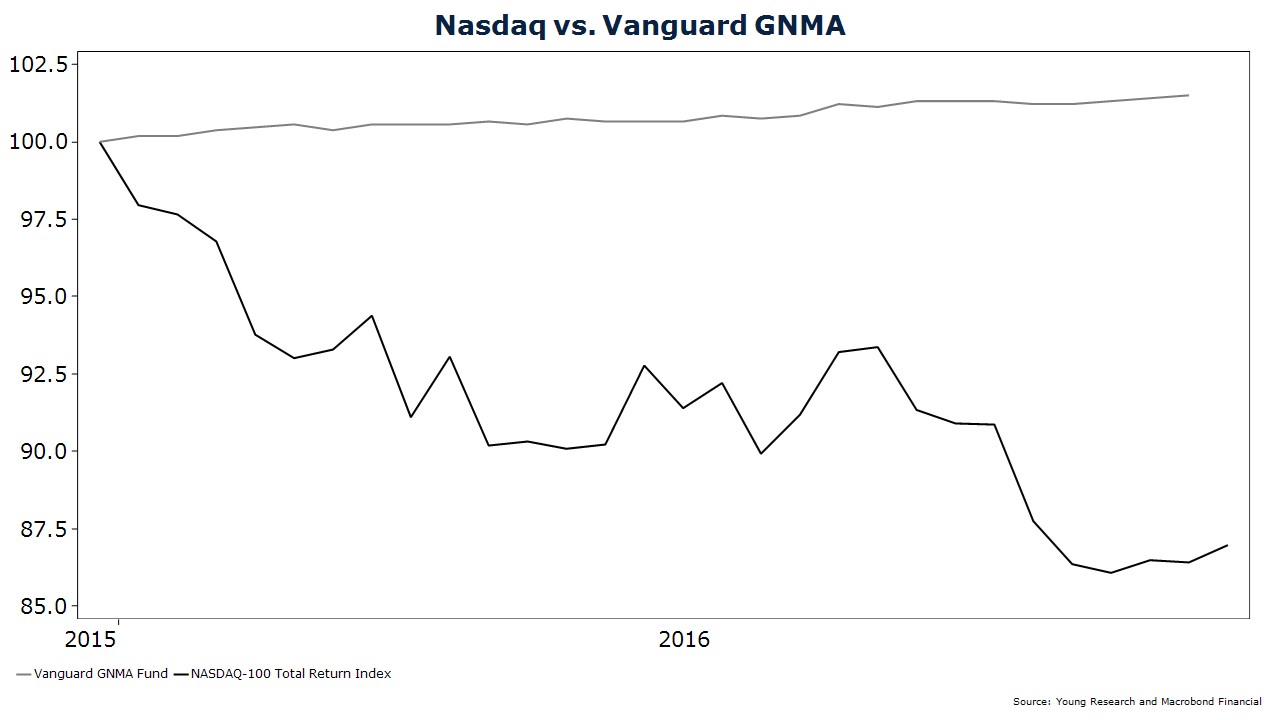
For the more conservative investor or those who simply don’t want to take on too much risk, we offer a defensive counterbalanced portfolio with a heavy weighting in high-quality bonds, a smaller allocation in dividend-paying stocks, and gold.

We first introduced gold into investment portfolios in 2005, shortly after the first physical-gold-backed ETF was listed. Our precious metals strategy is something we feel sets us apart from other investment managers. Gold can be a controversial investment in some quarters of polite society. Negative sentiment towards gold is interesting considering that up until the early 1970s the dollar was tied to gold and our own Federal Reserve still holds hundreds of billions worth of gold in its vaults.

We View Gold as an Insurance Policy

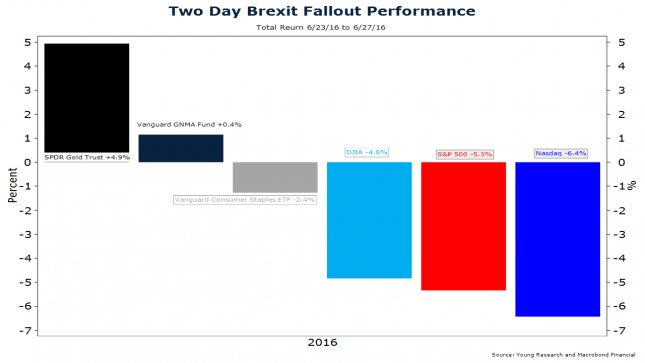
As I have written often in these strategy letters, we view gold as an insurance policy of sorts: Insurance against currency debasement, accelerated inflation, geo-political upheaval, and stock and bond market busts, among other risks.

As the earlier chart illustrates, during the two-day Brexit fallout, gold was a positive portfolio counterbalancer during a period when many asset classes were significantly down in value.

Over the years, as the investment landscape has evolved, we have added new strategies to our investment portfolios while eliminating or reducing other strategies. Gold is but one of those examples. In the early 1990s, zero-coupon Treasury bonds were a big part of our investment portfolios. The secular down-trend in interest rates acted as a tailwind to our zeros strategy. But, as the three-decade down-trend in rates started to lose momentum, the risk-reward profile of the zeros was no longer as favorable, and we started to phase out the strategy.

In the late 1990s, we had significant allocation in preferred stocks. Preferreds offered individual investors a high level of current income. As the market evolved and became dominated primarily by financial issuers, preferreds have become a much smaller part of our fixed-income portfolios. Contributing to our decision to phase out preferreds were the increased transparency and falling transactions costs in corporate bonds. Individual corporate bonds are now a major component in our fixed-income portfolios.

In the early 2000s we were heavily invested in REITs. REITs are still an area of interest for us, but today the reach for yield has pushed REIT valuations to levels we don’t find attractive.

More recently, we have been researching and developing a fully hedged long-short investment strategy. With the prospect of a low-interest-rate environment persisting, and investors still in need of adequate returns to fund future liabilities, the demand for returns with bond-like risk remains high. We are planning to offer a market-neutral and sector-neutral long-short portfolio. This would not replace our common stock portfolios, but would complement them. A market- and sector-neutral long-short portfolio seeks to take out stock market risk and sector risk, thereby significantly reducing volatility while still offering the prospect of modest returns (think mid-single digits). We are excited about this new strategy and are still working out the details, but will give you more information as we get closer to making the program available.
Have a good month. As always, please call us at (888) 456-5444 if your financial situation has changed or if you have questions about your investment portfolio.

Warm regards,

matt-org-sign


Matthew A. Young
President and Chief Executive Officer

P.S. At Richard C. Young & Co., Ltd., energy MLPs have long been an industry of focus. We have viewed many of the energy MLPs as quality businesses and have, of course, favored their high yields. This month, Barron’s also made the case for MLPs.

Many investors who exited energy-focused master limited partnerships earlier this year as oil prices crashed and MLP prices fell even harder, have struggled with when—and if—to get back in. The sector rebounded sharply off its February lows, but since June, gains have stalled as investors judged the easy money had been made and risks outweighed the opportunity.
It’s time to take another look at the sector. MLPs, which yield over 7% on average, are still plenty risky and are not the stable, tax-deferred “toll takers” many investors once thought. But the biggest risks are fading, and, as third-quarter earnings season kicks off, there’s potential upside. “The tone has changed,” says Marcus McGregor, who runs MLP strategy at Conning. “Investors are more comfortable with energy and are noticing, by the way, interest rates are still low and MLP yields are attractive.”
Energy prices are not only higher, but are more stable. Crude is near $51, high enough for many U.S. producers to operate profitably, and rig counts are rising. That should lead to more oil and gas volume that needs to be transported through MLP pipes.

P.P.S. For 23 years, my mom and dad have motorcycled throughout the U.S., gathering anecdotal evidence of the state of the U.S. economy. This past spring, they retired the Harleys but continued the touring. Here are some of my dad’s observations from the past six months.

I think a lot of Americans would be shocked at how the small manufacturing sector has been hollowed out throughout New England. Sure, Boston is in stellar shape, and the area will continue to be one of the best places in America to live and conduct business. Portland is our New England sleeper. We love the whole scene in this Maine seaport. Then there are a handful of thriving bucolic outposts like the Village Green, Dorset, our favorite town in Vermont. The Dorset Inn has been our home away from home for over three decades. But beyond these and a few other exceptions, look out. On our most recent three-day swing, we toured through ultra-depressed southwestern New Hampshire, including 1929 Depression-era Fitzwilliam and Troy. Talk about dismal! One after another, formerly thriving family-operated facilities were surrounded, not by towering pines, but by tall weeds and dilapidated “For Sale” signs. The icing on the domino-disaster cake was the shuttered family diner just down the road. Sad.

P.P.P.S. Each year, Barron’s ranks the nation’s top independent advisors, and Richard C. Young & Co., Ltd. was again recognized on this list, appearing for the fifth consecutive year.

The information contained in this letter is for informational and educational purposes only. It is not intended nor should it be considered investment advice or a recommendation of securities. Past performance is not a guarantee of future results. It is possible to lose money by investing. You should carefully consider your investment objectives and risk tolerance before investing. Please contact our office directly with any questions regarding items appearing in the letter.  


Bogle’s Convictions

September 2016 Client Letter

Jack Bogle did not invent the mutual fund, but he certainly turned the industry on its back. In 1974 Bogle founded the Vanguard Group based on his conviction that an investment company should first and foremost manage in a way that serves the best interest of the individual and seeks to avoid conflicts of interest. Bogle spearheaded changes within the mutual fund industry, allowing investors the option of creating a diversified portfolio without the traditional sales loads, 12b-1 fees, and high annual expense ratios that dominated the industry.

The investment industry’s layers of high expenses and abundance of marketing has always been a bone of contention for Bogle. While Bogle surrendered his role as Vanguard CEO in 1996, he remains quite active in the investment community—frequently speaking, publishing, and encouraging mutual fund managers to behave as responsible corporate citizens. By example, in April 2000 Bogle wrote:

My long-standing view (is) that the central principle view of the mutual fund business should be, not the marketing of financial products to customers, but the stewardship of investment services for clients. Marketing has displaced management as the industry’s chief principle, and expenditures on investment advisory services are today dwarfed by expenditures on advertising and sales promotion, with boxcar past returns advertised as if they would recur into eternity.

Not only has the industry become a “cash cow” for fund sponsors and managers as well as Wall Street brokers and bankers, it has increasingly become a vehicle for short-term speculation, a trend fostered in part by the industry’s focus on marketing.

I imagine early originators of mutual funds did not expect a day where funds would be used for speculation. And now, with the proliferation of exchange-traded funds, speculative investing and trading has become even easier. My dad, who entered the securities business around the same time as Bogle, recalls that many of the old-line Boston investment houses were referred to as investment counsel firms. These conservative firms welcomed families, forming decades-long associations emphasizing how dividends and interest were at the core of most investment programs.

Persuasive Tests of High Quality

Back in those days, according to my dad, the words speculation or performance rarely—if ever—came up. Boston’s   counsel firms were fashioned much like bank trust departments, where the utmost in privacy and prudence were practiced. Investment strategies included Ben Graham’s theories on the importance of dividends. In the Intelligent Investor, Graham wrote, “One of the most persuasive tests of high quality is an uninterrupted record of dividend payments for the last 20 years or more. Indeed, the defensive investor might be justified in limiting his purchases to those meeting this test.”

Albert Einstein is said to have described compound interest as the greatest mathematical discovery of all time. Charlie Munger, longtime partner to Warren Buffett, wrote, “Understanding both the power of compound return and the difficulty getting it is the heart and soul of understanding a lot of things.” Burton Malkiel, noted Princeton economics professor, wrote, “Historically, high-dividend yields have meant better returns. Since a fat yield implies that a stock is fairly low relative to those of other stocks, looking for above-average yields is itself a contrarian strategy… Investing in high-dividend stocks, therefore, is likely to lead to attractive issues.”

As you are more than aware, it’s been a miserable environment for yield investors. Crafting an equity portfolio with a decent dividend yield while trying not to take on too much risk is a tall order. Overly aggressive monetary policy from the world’s biggest central banks has pushed rates down onto the floor. T-bill yields are still only a few ticks away from zero, and in many countries, interest rates are negative. Long-term bonds don’t offer much of an income boost, either. Even in the U.S., where the Fed hasn’t yet driven us into a negative interest rate hole, 10-year Treasury bonds offer a low yield of 1.59%.

Retired investors who diligently socked away money for years in the hope of generating a steady retirement income from full-faith-and-credit-pledge U.S. Treasury securities have had a tough go.

The disappointing reality is that long-term Treasuries offer little in the way of income, and they no longer deliver adequate return to protect principal from inflation. In this environment, bonds must be viewed first as a counterbalance and only secondarily as a source of income. That doesn’t mean one should abandon their bond allocation, but it may require one to boost income in other parts of the investment portfolio.

A Wealth of Income

Stocks are the logical place to look for additional income, but the pickings are slim in the traditional high-yield sectors of the stock market. Utilities and real estate investment trusts—two of the highest-yielding sectors in the market—may now be overbought and slightly overpriced. Many of our favored utility stocks yield less than 3%, and you only get another half of a percent in REITS. Both yields are near historic lows. Should interest rise, investors are likely to head for the exits, potentially wiping out years of dividend income in the process.

As I wrote last month, European stocks can offer promise for dividend seekers. European companies tend to favor dividends over stock buybacks, and some European shares have not kept pace with U.S. equities offering potential upside in capital appreciation.

Pipeline MLPs are another area of the market for income opportunities. Most pipeline MLPS are really nice businesses. The barriers to entry are high, as right-of-way must be secured. Pipeline companies  usually lock in their revenue with long-term, fixed-rate contracts, so their income isn’t heavily dependent on oil and gas prices.

Even after a monster rally from their February lows, pipeline MLPs still offer a wealth of income. Some of our favored positions, including JPMorgan Alerian MLP ETN (AMJ), Holly Energy (HEP), and TC Pipelines (TCP), still offer current yields at 6.5% and higher.

Jack Bogle’s Outlook

This month, The Wall Street Journal’s Holman W. Jenkins profiled Mr. Bogle, now 87, recognizing his 65th year as an industry leader. Among other topics covered was Bogle’s outlook for the stock market.

Don’t imagine a revisitation of the ’80s or ’90s, when stocks returned 18% a year and investors, after the industry’s rake-off, imagined they “had the greatest manager in the world” because they got 14%. Those planning on a comfy retirement or putting a kid through college will have to save more, work to keep costs low, and—above all—stick to the plan.

Mr. Bogle finds today’s stock scene puzzling. Shares are highly priced in historical terms; earnings and economic growth he expects to disappoint for at least the next decade (he sees no point in trying to forecast further). And yet he advises investors to stay invested and weather the storm: “If we’re going to have lower returns, well, the worst thing you can do is reach for more yield. You just have to save more.”

Mr. Bogle relies on a forecasting model he published 25 years ago, which tells him that investors over the next decade, thanks largely to a reversion to the mean in valuations, will be lucky to clear 2% annually after costs. Yuck.

Mr. Bogle’s own portfolio consists of 50% stocks and 50% bonds, the latter tilted toward short- and medium-term.”

Congratulations!

In a foreword written in Jack Bogle’s Bogle on Mutual Funds, my dad congratulates readers for purchasing the book. My dad writes, “My personal copy of Bogle on Mutual Funds, sent to me by Jack back in October 1993, is now dog-eared and frayed—underlined, circled and recircled in red ink. This book has been a workhorse for me both personally and professionally, and I am sure your copy will become an instant cornerstone of your investment library.”

The congratulations offered by my dad could not have been more sincere. As Richard C. Young & Co., Ltd. was beginning to grow in the early 1990s, we used many of Bogle’s bedrock principles in our own strategy for clients. Like Bogle we believe investment success can be had by keeping the strategy simple—focus on the long term, forget trying to outguess the market, and be aware of the negative impact of high expenses.

And, of course, investing in companies with a history of making regular annual dividend increases is the foundation of our equity strategy. When investing in companies with a history of annual dividend increases, we are putting the odds in our favor of not only getting a pay raise each year, but also helping us keep pace with the nasty effects of inflation.

Have a good month. As always, please call us at (888) 456-5444 if your financial situation has changed or if you have questions about your investment portfolio.

Warm regards,


Matthew A. Young

President and Chief Executive Officer

P.S. “Profit Slump for S&P 500 Heads for a Sixth Straight Quarter” was the title of a 9/25/16 Wall Street Journal article.

The third quarter was supposed to be when earnings growth returned to U.S. companies. Not Anymore.

Companies in the S&P 500 are now expected to report an earnings decline for the sixth consecutive quarter in the coming weeks, according to analysts polled by FactSet.

That slump would be the longest since FactSet began tracking the data in 2008.

For the third quarter, the energy sector is projected to yet again report the largest year-over-year earnings decline of all sectors in the S&P 500, with a drop of 66% expected. It would mark the eighth consecutive quarter that energy companies in the index have reported a year-over-year fall in earnings.

Revenue growth, meanwhile, is set to return for companies in the S&P 500 for the first time since the end of 2014, according to analysts polled by FactSet. Nine of the 11 sectors are predicted to report year-over-year sales growth during the third quarter. Consumer-discretionary companies lead with a projected rise of 8.7%.

One reason stocks continue to climb even as earnings shrink is easy-money central-bank policies. Some investors are using the resulting low government-bond yields as justification to buy more stocks in a search for yield, pushing up major indexes.

P.P.S. A recent case study section in Kiplinger’s looked back to 2007 when the magazine profiled an 85-year-old Florida woman. The woman “was sold an annuity with surrender charges that lasted until she was 101 years old, including a 25% surrender charge for the first five years.” Several years later, the Florida Department of Financial Services opened 431 annuity investigations and discovered some reported surrender charges of up to 25% of the account value for withdrawals in the first 15 to 20 years. According to Kiplinger’s, from 2008 to 2010 the Florida legislature passed a series of laws that established suitability requirements for annuity sales. Even with the legislation, surrender periods can extend out to 10 years and surrender charges as high as 10% for annuity sales buyers who are 65 and older.

P.P.P.S. Pioneering health firm Johnson & Johnson (JNJ) is determined to remain in the vanguard of the health technology revolution. JNJ has partnered with Google on robot-assisted surgery, with IBM on improving pre-and post-operative patient care using machine learning from Watson Health Cloud, and with HP on 3D printing medical solutions. Now JNJ has hired Silicon Valley veteran Marc Leibowitz (formerly of Google, StumbleUpon, and Dropbox) to scour the landscape for more opportunities to advance with technology. JNJ, a longtime holding at Richard C. Young & Co., Ltd., is an old company with one of the longest records of dividend payments and increases on record, but is operating like a growth-hungry startup.


Most Profitable Move of 2016

August 2016 Client Letter

MOST PROFITABLE MOVE OF 2016

One of the most profitable investing moves of 2016 involved no research, no trading and actually no work at all. While it now seems like a distant memory, you may recall the nosedive that stocks took to begin the year. Just 10 trading days into January, U.S. stock markets recorded their worst start to a year on record. Making matters worse, the bad days did not end quickly. Stocks continued lower into the first part of February. An Economistarticle asked, “Is this really 2008 all over again?”

By the time February 11 rolled along, the S&P 500 was down 10% and the NASDAQ had tumbled 14%. For some, this was an alarming environment. Markets had experienced few corrections dating back to 2009. Had the day of reckoning arrived? A decision needed to be made. Should I abandon ship and cut losses, or ride it out and hope for the best?

Fortunately, most of our clients made the decision to stay the course. This decision turned out to be the right move as the markets rallied and reached new highs. When looking back, it’s easy to see what a blow it would have been to dump one’s equities and head to cash. Those who chose to make no move experienced a dramatic difference in portfolio returns compared to those who sold out.

The table below shows the total returns from various asset classes since February 11.

all-about-client

In just over six months’ time markets made impressive gains. Investors who completely sold their equities in January or February missed the boat on future returns. Selling an asset on the basis of performance is a strategy that can sabotage portfolio returns. As I wrote in April, market research firm Dalbar has shown over and over that when investors sell in despair and buy on euphoria, they sacrifice returns. The result of this emotionally charged approach to portfolio management has been dismal. Dalbar’s data shows that for the 30-year period ending in 2014, the S&P 500 would have compounded investors’ money at an annual rate of over 11%, but the actual return of the average equity-fund investor was only 3.8%. The same is true of bonds. Dalbar reports a 30-year return of 7.4% for the Barclay’s Aggregate Bond Index, but only 0.72%
for the average fixed-income fund investor.

EASIER WITH A PLAN

Avoiding panic and staying calm through market declines is easier with an investment plan in place. Clients at Richard C. Young & Co., Ltd. understand that much of our plan centers on higher-quality security selection with a focus on dividends and interest. Additionally, most portfolios are balanced between fixed-income securities, gold, and stocks. When stocks declined, as they did earlier in the year, the fixed-income and gold component held their values or even increased in value, helping to reduce portfolio volatility. Obviously, the reduced volatility added a degree of comfort, helping clients to remain patient and calm.

WHICH ALLOCATION IS BEST?

In determining the right balance between stocks and bonds, you need to weigh several considerations. These include personal risk tolerance to volatility, past experiences, and personal financial situations. By example, investors who have successfully ridden out Black Monday, the dot-com crash, and the 2008 financial crisis may accept that markets do not always go up. Corrections, while not pleasant, are part of the investing landscape. Historically, time has healed market wounds. Investors in this camp may have no problem with a heavier allocation to stocks.

PHASE OF LIFE

Other investors, while also accepting the potentially volatile nature of the markets, find themselves in a different phase of life compared to the dot-com crash and financial crisis years. Those now fully retired, with health concerns, or with thoughts of a surviving spouse may not wish to have the added concern of portfolio volatility. At this point in life, sleepless nights are a bad investment. Investors with this type of risk profile can still invest in stocks but may prefer less exposure than they tolerated in earlier years.

SAFE EUROPEAN STOCKS

With interest rates still nailed to the floor, investors are seeking additional yield from stocks. Income stocks are also enjoying a nice rally this year, further increasing investors’ desires to own these shares. In fact, The Vanguard Group recently closed its popular Dividend Growth Fund (VDIGX) to new investors. Due to its popularity and to the strong cash flows into the fund, management felt the need to stem further growth. Owners of VDIGX know that, despite the word Dividend in its name, the fund is more focused on companies with a commitment to grow their dividends over time than on companies with relatively higher yields. As of August 23, 2016, VDIGX offered a 1.91% yield. This is probably on the lower side for investors looking for additional cash flow.

To achieve a higher-yielding equity portfolio, it can be effective to invest in individual stocks as opposed to the fund route. The August 13 issue of Barron’s featured an article profiling “5 Safe European Stocks With Yields Up to 5%.” Three of the featured stocks, National Grid, Nestle, and Vodafone, are ones we purchase for clients. Barron’s made the case that income seekers are neglecting Europe, which is one of the more promising places for dividends. European companies tend to favor dividends over stock buybacks, and some European shares have not kept pace with U.S. equities offering potential upside in capital appreciation.

A few other European names in our client portfolios that perhaps could have made theBarron’s list include Unilever, Anheuser Busch InBev (Bud), British American Tobacco, and Siemens. Unilever, Bud, and British American Tobacco are all powerhouse global, branded-consumer-staples companies.

Unilever sold $60 billion worth of soaps, detergents, deodorants, foods, and beverages in 2016. Almost two-thirds of the company’s business is done in the fast-growing emerging markets. According to the IMF, emerging market economies are expected to grow at more than twice the rate of developed economies for the balance of the decade. Long-term, Unilever’s position is a winner. Some of Unilever’s more recognizable U.S. brands include Dove, Hellman’s, Vaseline, Ben & Jerry’s, Country Crock, Klondike, Q-tips, and Suave.

Anheuser Busch is the world’s leading beer company. Bud owns 19 $1-billion brands, including Budweiser, Bud Light, Corona, Stella Artois, and Michelob, among others. With the pending acquisition of SAB Miller, Bud will become an even more dominant force in the global beer market, enhancing the company’s cost advantage cost advantage with larger scale.

British American Tobacco (BTI) is one of the world’s largest tobacco companies with factories in 41 countries. British American Tobacco has paid annual dividends since at least 1928. Over the last five years, British American Tobacco has increased its dividend at an annual rate of 5.5%. A mid-single-digit dividend growth rate paired with BTI’s current yield of 3.4% makes for a decent prospective return in today’s ultra-low-return environment.

As I mentioned in my last client letter to you, we view Siemens as the GE of Europe. Siemens is a leader in automation, energy, healthcare, and building technologies. While Siemens is a more cyclically sensitive business than many of the consumer companies we own, it is a global blue-chip that has been around for almost 170 years. It has survived many recessions, a few depressions, and even major wars.

As for Barron’s implication that these companies may be safe, investors should note that safe is a subjective term and best interpreted relative to other equity investments. Nestle, National Grid, and, to a lesser extent, Vodafone all provide or produce essential goods and services. Their businesses are less susceptible to business cycle fluctuations than the average company, and all have the financial capacity to weather a recession. That does not mean that their share prices can’t fluctuate substantially. I am sure Barron’s would put Coca-Cola in the same safe category as Nestle, National Grid, and Vodafone, but being a safe stock didn’t prevent Coke shares from falling almost 60% between July 1998 and March 2003.

In terms of strategy at Richard C. Young & Co., Ltd., we seek a mix of higher-yielding equities and companies that focus on dividend growth. Companies offering a heftier yield, include many of our above mentioned European holdings, our energy and MLP positions, and utilities. As with the Vanguard Dividend Growth Fund strategy, we also invest in companies with a commitment to grow their dividends over time. Examples of these companies would include CVS, Walgreens, and Johnson & Johnson. As I have stated before, annual dividend increases act as a pay raise. And this pay raise can occur regardless if the stock market is up or down. We all enjoy pay raises, as they are one of the few ways to keep pace with the nasty effects of inflation.

Have a good month. As always, please call us at (888) 456-5444 if your financial situation has changed or if you have questions about your investment portfolio.

Warm regards,

Matthew A. Young
President and Chief Executive Officer

P.S. “If making money is a slow process, losing it is quickly done.” Japanese poet Ihara Saikaku

P.P.S. Finding alternatives: Alternative investments are assets classes that do not move up and down in tandem with the stock market. Gold is considered an alternative and often moves out of sync with stocks. By example, on June 24, after the Brexit vote was announced, SPDR Gold Shares rose 4.9%, while the S&P 500 fell 3.6%. Obviously, the opposite can occur as well, where gold will underperform when stocks are doing well. But the strategy for including gold (and bonds) is to help smooth out portfolio returns and to reduce volatility.

P.P.P.S. Regardless of whether a security is domestic or international, dividends remain the heart of our investment strategy. Over time, dividends and the reinvestment of dividends make up most of the return of stocks. The percentage of return coming from dividends, of course, varies by period. From year-end 1999, dividends have accounted for about 54% of the return on the S&P 500.

The information contained in this letter is for informational and educational purposes only. It is not intended nor should it be considered investment advice or a recommendation of securities. Past performance is not a guarantee of future results. It is possible to lose money by investing. You should carefully consider your investment objectives and risk tolerance before investing. Please contact our office directly with any questions regarding items appearing in the letter.


The Snap-Back Rally

July 2016 Client Letter

In a surprise vote on June 23, the British decided by a 52% to 48% margin to leave the European Union (EU). The vote caught many investors and pundits off-guard. Financial markets cratered on the news, with U.K. stocks falling 16%, euro-area shares dropping 13%, and stocks in the U.S. slipping 5.3%. The British pound fell over 13%, and government bond yields hit new lows. In the U.S., 10-year Treasury yields dropped to 1.36%—the lowest level in history.

slide1-645x363

As I have recently discussed with several clients, we viewed Brexit as a risk to financial markets and the global economy, but a risk that was low on the list of concerns for us.

Why was Brexit low on our list? Evaluated in isolation, it is difficult to envision much lasting economic damage from Britain’s decision to leave the EU. In the short-term, nothing actually changes. The U.K. first must invoke article 50 of the Lisbon Treaty (think of it as the EU constitution) before negotiations over the U.K.’s exit can even begin. Once article 50 is invoked, the negotiation period starts and can last for up to two years. During the negotiation period, the primary drag on growth will come from heightened uncertainty, but we suspect this effect will be marginal. After the negotiation period, any impact will depend on the terms of the deal. It probably isn’t in the U.K.’s, or the EU’s, interest to negotiate a deal that hurts global growth.

If Brexit is a minor event, then why the volatility following the vote? Our view is that some investors are worried Britain’s decision to leave the EU will act as the catalyst for a broader breakup of the euro-area. If voters in Spain, Italy, and France, for example, decide to hold referendums of their own on EU membership, and they vote to leave, the global economy may indeed have a problem. We have long viewed a breakup of the euro-area as a risk to the global economy, but we see this as more of a longer-term risk. We still see significant political capital invested in the idea of a united Europe. Many in the euro-area won’t give up on this idea easily. We could envision a scenario where Brexit extends the life of the euro-area by encouraging EU bureaucrats to roll back some of their most controversial mandates in an effort to quell the nationalist sentiment in Europe.

THE SNAP-BACK RALLY

Once the shock of Brexit wore off, and investors started to more fully evaluate its consequences (or lack thereof), share prices rallied sharply. The S&P 500 recovered all of its post-Brexit losses in three days and has since gone on to rally to new all-time highs.

What is pushing stocks to new highs? Brexit has been bullish for the market. Not because of the uncertainty it creates, but because it is yet another in the long and growing list of excuses for global central banks to keep interest rates lower for longer and pump more liquidity into the financial system. Following Brexit, Bank of England officials quickly signaled a desire to cut rates over coming months. The Federal Reserve Bank signaled a wait-and-watch approach (a dovish change from a tightening plan), the European Central Bank talked about altering its bond-buying program to favor more of the euro-area’s overly indebted countries, and there are signals that the Bank of Japan is readying the printing presses for helicopter money (a form of outright debt monetization).

In our view, the response from policy makers has been a gross overreaction to Brexit. The world got along just fine before the U.K. was a member of the EU, and we suspect it will get along just fine when the U.K. regains its full independence. Flooding the system with liquidity is only likely to cause more economic pain down the road as it ignites a reach for yield and greatly increases the probability of another speculative blow-off phase in equities. The best you can do in U.S. government bonds today is 2.27%, and that is for a 30-year term. In Germany and Japan, yields are even lower. Thirty-year German bunds yield 0.50% and 30-year Japanese bonds yield 0.20%.

slide2-1-645x363

The dearth of safe yield has pushed many investors to flock to stocks for income. The top-performing sectors of the S&P 500 year-to-date (YTD) are those with companies that pay high and dependable dividends. YTD, utilities are up 22.5%, telecommunications shares are up 26.3%, and consumer staples shares have gained 11.6%. That is a welcome change from last year when dividend shares lagged the broader market, but the hot money nature of the flows into these sectors is probably unsustainable.

It is worth remembering that investment strategies move in cycles, falling in and out of favor relative to the broader market averages. Last year, speculative shares were in favor, this year dividend stocks are in favor, and next year something else will be in favor. We, however, will continue to invest how we have always invested, regardless of what is fashionable at the moment.


slide3-1-645x363


We buy dividend-paying companies with a propensity for making regular annual dividend increases. Fashionable or not, blue-chip dividend-payers like Siemens, Johnson & Johnson, CVS, and AB-InBev are the types of firms we favor.

THE GE OF EUROPE

Siemens is the GE of Europe. Founded almost 170 years ago, Siemens is a global powerhouse with businesses that span automation, energy, healthcare, and building technologies. During the Brexit-induced sell-off, we made an opportunistic buy of Siemens for clients who were underweight in the stock. We aren’t worried about any short-term problems that Brexit may cause for Siemens. Siemens is a blue-chip industrial company that will be around for many more decades—whether the U.K. is part of the EU or not. Siemens shares offer investors a yield of 3.75% today, and we are forecasting an almost 6% increase in the dividend next year.

We are not overly concerned with how Siemens shares perform over the next 6 or 12 months. We are interested in the next 6 to 12 years. And at that time horizon, we like the durability and value Siemens shares offer investors.

THE WORLD’S LARGEST DIVERSIFIED HEALTHCARE COMPANY

We also like the durability and value of a company like Johnson & Johnson. J&J is the world’s largest diversified healthcare company with sales of almost $70 billion across its pharmaceuticals, medical devices, and consumer products businesses. J&J’s diversification has helped the company achieve one of the most impressive dividend records of all U.S. companies. J&J is one of Standard and Poor’s Dividend Aristocrats. To qualify as an aristocrat, a company must have increased its dividend for at least 25 consecutive years. Fewer than 2% of all publicly traded U.S. companies make the cut. J&J is among the best, with a record of 53 consecutive dividend increases. Over the last five years, J&J’s dividends have compounded at 7% per year. In our view, with J&J’s low payout ratio (dividends as a share of earnings), the company has plenty of excess cash flow to continue making meaningful dividend increases for the foreseeable future.


slide4-645x363


AMERICA’S SECOND-LARGEST DRUGSTORE CHAIN

Another of our favored dividend stocks involved in the healthcare industry is CVS. CVS is the nation’s second-largest drugstore chain. CVS owns over 9,000 retail pharmacies, 1,100 walk-in medical clinics, and one of the nation’s largest drug-benefits managers, serving 75 million plan members. CVS generates over $150 billion per year in sales. CVS’s in-store walk-in clinics look like a long-term winner. The clinics have convenient locations, low overhead, and the ability to treat common ailments and sicknesses. Patients are in and out in a matter of minutes and, on their way out, they can pick up prescriptions or over-the-counter medicines prescribed during their visit. CVS’s dividend bona fides come in the form of its exceptional dividend growth record. CVS shares yield a modest 1.75%, but over the last five years, dividend growth has averaged 30% per year. You don’t have to compound for very long at 30% to turn a small number into a big number.

THE KING OF BEERS

On the other end of the health spectrum is AB-InBev (Bud). Bud is the world’s largest brewery, and with its coming acquisition of SABMiller, it will get even bigger. Post-acquisition, Bud will have about 30% of the global beer market. The company’s suite of brands will includes Budweiser, Corona, Foster’s, Miller, Peroni, and Stella Artois, among others. We like Bud’s massive scale and dominance in key emerging markets, including Latin America and Africa. Bud shares yield 3.2% today and offer the prospect of double-digit dividend increases in the future. Over the last five years, Bud investors have enjoyed dividend hikes averaging over 27% per year. Even if Bud can maintain half that growth rate over the next five years, today’s 3.2% yield would turn into a more than 6% yield.

Investing in a group of stocks that includes the likes of Siemens, Johnson & Johnson, CVS, and Ab-InBev can offer investors multiple benefits. Income-dependent investors can be reasonably assured that Johnson & Johnson will continue on with its annual dividend record. These companies are also likely to continue to raise their dividend payment annually, helping offset some nasty effects of inflation. When stock prices are down, reinvested dividends at a lower share price will result in higher future dividend payments. And during periods of post-Brexit-type volatility, a steady stream of cash makes it easier to avoid the emotionally charged decisions that tend to sabotage a portfolio’s long-term investment strategy.

Have a good month. As always, please call us at (888) 456-5444 if your financial situation has changed or if you have questions about your investment portfolio.

Warm regards,

matt-org-sign

Matthew A. Young
President and Chief Executive Officer

P.S. Despite the Dow Jones Industrial Average trading at record highs, the overall investing environment continues to be challenging. The largest U.S. public pension fund, California Public Employees’ Retirement System (Calpers), failed to hit its internal investment target for the second straight year. And, as reported in the Wall Street Journal, for its recent fiscal year ended June 30, the plan posted its lowest annual gain since the last financial crisis, earning just 0.6%.

P.P.S. From Rex Singuefield, Forbes, July 18, 2016:

Now in the third year of his bold tax experiment, Kansas Governor Sam Brownback can see the ways in which reducing (and, in many cases, eliminating) the state income tax is yielding incremental, positive effects for Kansans.

Significantly, every year since the tax cuts were implemented, Kansas has surpassed the state record for new business formations. When we consider that startups have decreased nationwide since the Great Recession of 2008, this achievement is particularly remarkable. What’s more, the Kansas unemployment rate stands at 3.7% – the lowest the state has seen since 2001, and well below the national average of 5.5%.

Governor Brownback put his faith in the private sector to grow the Kansas economy, rather than the government. By eliminating the income tax for small business, the Brownback administration effectively put money back in families’ pockets and provided promising new businesses with an environment primed for growth. Following the major tax reform in 2013, individual income taxes for individuals, families and small business went down by 30% on average. Seventy-one percent of the savings went to individuals and families, who could then save or spend as they chose. Twenty-nine percent of the savings went to small businesses, allowing them to make larger investments in equipment, space and staff.

P.P.S. While today’s environment is challenging for investors, we have not exactly had smooth sailing since this century began. From December 31, 1999, through June 30, 2016, for example, the Nasdaq has posted an average annual return of 2.03%. That seems difficult to believe.


A Decades Old Strategy

June 2016 Client Letter

The Sell in May and Go Away investment strategy is a perennial favorite of the financial press. Each spring I read at least one article that opines on the Sell in May strategy. Some articles are pro-sell while others oppose the approach.

A Decades Old Strategy

The Sell in May and Go Away strategy has been around for decades and is one of the easiest investment strategies to follow. In the most popular form, you literally make two trades a year—one to buy stocks in November and one to sell stocks in May. That’s it. No need for a fancy computer or deep knowledge of markets to execute this strategy. If you can read a calendar, you can execute the strategy.

How does the Sell in May strategy perform in the real world? Is it sound advice or just a catchy adage? The first academic study on the Sell in May and Go Away strategy was published in 2002 by Sven Bouman and Ben Jacobsen and titled “The Halloween Indicator, ‘Sell in May and Go Away’: Another Puzzle.” They studied 37 markets and found that, in 35 of the markets, the November to April period had higher returns than the May to October period. In 20 of the 37 markets, the returns were significantly higher.

This does not mean the Sell in May strategy still works. Oftentimes when an academic paper is published identifying a successful investment strategy, investors pile into the strategy and drive away the excess profits. Fortunately, in the case of the Sell in May strategy, Andrade et al. published a follow-up study (and revision) in July 2012 and March 2013 issues of Financial Analysts Journal titled, “‘Sell in May and Go Away’ Just Won’t Go Away.” What did this study find?

The authors performed an out-of-sample test of the sell-in-May effect documented in previous research. Reducing equity exposure starting in May and levering it up starting in November persists as a profitable market-timing strategy. On average, stock returns are about 10 percentage points higher for November-April half-year periods than for May-October half-year periods. The authors also found that the sell-in-May effect is pervasive in financial markets.

The Historical Record Seems Clear

The historical record seems to be clear and backed by rigorous academic research. Returns for the November to April period have been higher than the returns for the May to October period. Our chart below shows that since November of 1949, the average six-month return on the S&P 500 in the November to April period is 7% compared to 1.4% for the May to October period.

slide1-768x432

So on paper there is no denying that the Sell in May strategy has worked. But how confident should we be that it is sound investment advice? To answer this question we must determine why the strategy has worked, why it will continue to work, whether or not it works across styles and sectors, and what happens to the strategy after taxes are factored in. This is where things start to fall apart.

Historical data shows the Sell in May strategy was a success, but there is no accepted explanation for its strong performance. And if there is little to explain the outperformance in the November to April period, what basis do we have for expecting the strategy to perform well in the future? Are we really supposed to risk our life-savings following a strategy we don’t fully understand and can’t explain?

There Are Problems

Even for those who don’t have reservations about blindly following an investment strategy, there are problems with the Sell in May strategy. For example, at Richard C. Young & Co., Ltd., we craft stock portfolios of only dividend-paying companies favoring defensive sectors in the market. Does the Sell in May strategy work as well for defensive sectors as for the broader market? And what about for dividend-paying shares?

Let’s look at the performance of the Sell in May strategy over a period when it was successful for the broader market. From November 1999 through May 2016 an investor who pursued the strategy using the S&P 500 Index would have earned more than a buy-and-hold investor. If the strategy is valid for all sectors and styles, we would expect to see similar results for defensive sectors and dividend stocks alike. What does the evidence show?

The Sell in May strategy was not as successful in the defensive sectors of the market as for the S&P 500 as a whole; it did not work for consumer staples and healthcare, it was neutral for utilities, and it worked in telecom. The chart below compares the performance of a Sell in May strategy for the S&P 500 Consumer Staples sector to a buy-and-hold strategy. The buy-and-hold approach is the clear winner for consumer staples stocks.

slide2-768x432

The same turns out to be true for dividend-paying stocks. The total return of a buy-and-hold position in the S&P Dividend Aristocrats Index (companies that regularly pay and increase their dividends) earned significantly more than an investor selling out of the index every May and buying back in every November. And that’s even before accounting for taxes.

slide3-768x432

The Fatal Blow: Taxes

The final nail in the coffin for the Sell in May strategy is taxes. When you sell stocks every six months, all of your gains are taxable at ordinary income tax rates. For investors in the highest income tax bracket, investing in a taxable account, that means at least a 39.6% haircut on every gain. The tax liability that the Sell in May strategy generates turns a marginally winning strategy into a big loser. Our chart below compares the growth of a hypothetical $10,000 invested in the S&P 500 in November 1999 using a buy-and-hold strategy, a Sell in May strategy before tax, and a Sell in May strategy after tax. As stated above, after taxes, Sell in May loses and buy-and-hold wins.

slide4-768x432

In our view, Sell in May and Go Away is not sound long-term investment advice. It is a market timing strategy that cannot be adequately explained, does not work across sectors and styles, and may generate tax liabilities that significantly outweigh its pre-tax performance advantage.

As most of you are aware, market timing is not a strategy to which we subscribe. Over the short term, markets are extremely unpredictable. It is only over the long run that returns can be reasonably estimated and, even then, there is a large degree of uncertainty.

In a business where investors who are right even a little more than half the time are often considered extraordinary, market timers stack the deck against themselves. To win at market timing, you have to be right nearly 100% of the time—on the way out and on the way back in. Timers who sold out of the market as things started heading south in January and February of this year might have missed out on a quick rally and put themselves in the difficult position of deciding when to reenter the market.

Don’t Miss the Best Days

Missing out on even a few days of gains can destroy an investor’s long-term returns. The chart below compares the performance of the S&P 500 from year-end 1999 through May 2016, including all days and excluding the 10 best days. An investor who missed the 10 best days in the market would have lost 2.3% compared to a gain of over 95% for a buy-and-hold investor.

slide5-768x432

The evidence on market timing should be clear. Achieving long-term investment success is not about market timing, but rather about time in the market. Now, that’s an adage worth remembering.

Have a good month. As always, please call us at (888) 456-5444 if your financial situation has changed or if you have questions about your investment portfolio.

Warm regards,


Matthew A. Young
President and Chief Executive Officer

P.S. With the European Central Bank and the Bank of Japan moving rates into negative territory, it is estimated that there is over $10 trillion in negative-yielding debt across the global financial system. Why have the ECB and the Bank of Japan gone negative with rates? A skeptic might respond that it is an act of desperation. After keeping rates at zero and printing billions of yen and euros a month to buy bonds and other assets, the banks have failed to ignite the kind of inflation they had hoped these policies would generate. By experimenting with negative rates, the central banks are hoping commercial banks will lend more to the private sector and stimulate growth. Thus far, the results have been mixed. Negative rates act like a tax on the banking system, which isn’t an inducement to lend more. Negative rates have also encouraged some to pull their money out of the banking system and hold it in the form of cash. Safe sales in Japan are soaring as Japanese savers look to secure their increased cash holdings. The final verdict isn’t yet in on negative interest rates, but so far the negatives seem to outweigh the positives.

P.P.S. As reported on 6/20/2016 in The Wall Street Journal,

The European Central Bank bought almost €2 billion ($2.26 billion) of corporate bonds last week, keeping up an aggressive pace for a new stimulus program that policy makers hope will help drive up stubbornly low inflation in the euro area. The ECB said its corporate bond holdings rose to €2.25 billion last Friday, up from €348 million a week earlier. That total puts the ECB on track to buy around €8 billion or more of corporate bonds a month, if it continues to buy at the same pace. The corporate bond buys, launched on June 8, are part of the central bank’s yearslong (sic) attempt to stoke inflation and lower financing costs across the euro area. The ECB aims to keep inflation just below 2% over the medium term, but it has missed that target for three straight years, despite launching an array of novel policy measures, including negative interest rates and large-scale bond purchases.


The Forlorn, the Unloved, and the Out-of-Favor

May 2016 Client Letter

From the time he took over the Windsor Fund in 1964 until his retirement in October 1995, John Neff delivered to his shareholders one of the most impressive returns in mutual fund history. Over Neff’s 31-year tenure at the helm of the Windsor Fund, a $10,000 investment grew to over $564,000. That same $10,000 investment in the S&P 500 would have grown to only $233,000—the average annual return difference between Windsor and the S&P 500 was only about 3% per year; but compounded over three decades, it resulted in an extra $331,000 of wealth.

The Forlorn, the Unloved, and the Out-of-Favor

In an age when large mutual funds struggle to even keep pace with broader market averages, how did Neff, who at one point was managing the nation’s largest mutual fund, manage to achieve such impressive results?

As my dad explained in a recent investment strategy report, Neff had a unique investing style.

John Neff, in his Vanguard Windsor Fund days, was an outstanding proponent of investing in the forlorn, the unloved, and the out-of-favor. John was noted for his patience and willingness to be out of synch for extended periods. During my institutional brokerage days, I loved working with Wellington Management, Windsor Fund’s management company. I knew many managers and analysts at Wellington and fondly remember, when I was the new kid on the block with a lot to learn, the helpful, informative lunches and analyst sessions. These learning sessions still serve me well today. And the contrary-opinion, out-of-phase success of John Neff played a big part in the learning curve I share with you over four decades later.

My dad goes on to explain:

… It is during a Neffian cycle that the dividend-paying stocks I favor tend to have their worst relative performance versus the stock market in general. Over long periods, Windsor Fund’s John Neff found himself wildly out of synch. John invested primarily in low P/E stocks, which is quite different from what I do. John’s low P/E stocks often fell out of favor. Neff simply did not care and stuck to his guns through thick and thin, often taking a beating in the “what’s hot today” financial media. I remember critical articles about John’s out-of-synch performance—each more misguided than the previous. John was not investing to outpace his neighbor. Rather, he was investing client funds entrusted to him with diligence, care and prudence, as if he were investing his own family fortune.

In his latest quarterly letter, Ben Inker, the co-head of Asset Allocation at Jeremy Grantham’s GMO (a firm with serious contrarian bona fides) offered readers some insight and counsel on the toll the Neffian cycle has taken on his own firm’s value-based approach.

Inker explains:

It’s no secret that the last half decade has been a rough one for value-based asset allocation. With central bankers pushing interest rates down to unimagined lows, ongoing disappointment from the emerging markets that have looked cheaper than the rest of the world, and the continuing outperformance from the U.S. stock market and growth stocks generally, it’s enough to cause even committed long-term value investors to question their faith. Over the past several years, we at GMO have questioned a lot of things, including assumptions that we had held without much question for decades, but we have not wavered in our belief that taking the long-term view in investing is the right path and that in the long run no factor is as important to investment returns as valuations.

The drivers of mean reversion [Editor’s note: the heart of GMO’s value strategy] are not hugely powerful at any given time, meaning asset prices and even the underlying fundamentals can move in unexpected ways for disappointingly long periods. It is a little glib to say that without this risk, it would be difficult for asset prices to get meaningfully out of line in the first place, but the reality is that the only way you can get really exciting opportunities for mean reversion is to have misvalued assets become even more misvalued before they revert to fair value. This is the catch-22 of value-driven investing. Your best opportunities will almost always come just at the time your clients are least interested in hearing from you, and might possibly come at the times when you are most likely to be doubting yourself. [Emphasis mine.]

In our view, an appreciation and understanding of what my dad refers to as the “Neffian cycle” is important to long-term investment success.

Diversification and Patience

We of course do not pursue a low P/E strategy like Neff, or a value-based asset allocation strategy like GMO. Diversification and patience form the foundation of our strategy. We craft portfolios that are diversified across asset classes and countries. In equities, we take a value-conscious approach focused on companies with a record of making regular dividend payments and regular dividend increases.

Like at GMO, the last few years have not always been kind to some of our favored asset classes. The relative performance of international shares has been especially challenged during this period. Our chart shows the performance of the MSCI All-Country World Index, excluding the United States in relation to the performance of the S&P 500. Over the last five years, international shares, as measured by the MSCI index, have lagged their U.S. counterparts badly.

slide2_performance-replacement-for-bloomberg-645x363

Despite what some might consider to be a painfully long period of weak relative performance, we continue to own and add to our international holdings. Why? The way we see it, the investment criteria we use for selecting international stocks is largely the same as it is for selecting U.S. stocks. We favor dividend-paying companies which have records of making regular dividend increases. We further favor firms with strong financial positions and those operating in industries with high barriers to entry. The companies we buy may not be household names to all Americans; but, in our view, their investment merits are just as good as the domestic names we own.

Take Siemens by example. Siemens is the GE of Germany, though it may not be a household name in the U.S. The company is an industrial conglomerate with businesses in power and gas, renewables, power generation, energy management, building technologies, and healthcare, among others. Siemens ADRs pay a 3.6% gross yield and the company has increased its dividend (in euros) at a compounded annual rate of 10% over the last decade. Siemens shares trade at a price-to-estimated-earnings ratio of 12.7X compared to 17.4X for U.S. firms in the same industry group. With Siemens, you get yield, you get value, and you get a global industrial powerhouse.

Bond Sentiment Today Unlike Anything We Have Seen

Another asset class that has experienced a Neffian cycle of its own in recent years is bonds. Bonds have lagged stocks, as they often do during bull markets, but the sentiment we are seeing towards the bond market today is not quite like anything we have seen before.

There is no denying that investing in the bond market has been a tough slog over the last few years. Zero percent policy rates and bond buying by the world’s major central banks has kept bond yields at some of the lowest levels on record. Investors have long had an aversion to the bond market, partly because bonds don’t offer the glamor and hope many crave from their investments. And bonds don’t provide the kind of long-term upside stocks can provide. Add today’s ultra-low yields to the investing public’s natural bias against bonds, and the result is a move by some investors to load up on stocks in an effort to boost income.

Higher yields are indeed available in the stock market, but bonds shouldn’t be bought solely for income. Bonds provide the courage to own stocks. They are a powerful counterbalancer. When stocks fall, bonds often rise. For retired investors drawing income, bonds can be viewed as a stabilizer.

Our chart below shows the performance of bonds in every calendar year the stock market has been down. In 13 of the 14 years that the S&P 500 has been down since 1950, intermediate-term government bonds advanced. That’s a .929 batting average. And in the only exception year, intermediate-term government bonds were down a scant 0.74%.

slide1_counterbalanced-total-returns_06-02-16-645x363


We haven’t seen a calendar down-year for the stock market since 2008, but the last two bars on our chart show the performance of the S&P 500 from its May 2015 high through today. From its May 2015 high, the S&P 500 is down about 2% and, as you would expect, intermediate-term government bonds advanced—by 4.4%.

Despite today’s painfully low yields and what appears to be a widely shared view among the investing public that income stocks are a replacement for bonds, we believe bonds remain a useful component of a well-diversified portfolio.

Focusing on Quality and Keeping Maturities Short

With yields so low, what is our current strategy in the bond market? We are focusing on quality and keeping maturities short.

Since 1945, the average business cycle expansion has lasted about 58 months. The current expansion is in month 83. By our estimation, that puts us at least in the winter stage of the cycle. In the late stages of an expansion, balance sheet leverage tends to rise and earnings quality begins to fall, leading to deterioration in creditworthiness.

The winter stage of the business cycle is not the time to take excessive credit risk. Late last year we began the process of upgrading the credit quality of our fixed-income portfolios. We sold the Fidelity Floating Rate High Income Fund, which invests in lower-rated firms, and boosted our position in full-faith-and-credit-pledge Treasuries and GNMA securities.

In a normal cycle where the Fed had already normalized interest rates, we would usually be looking to invest in longer-maturity Treasury securities, as these bonds often provide more upside during the contraction phase of the business cycle. But today, with the Fed only a quarter point off of zero and negative rates across much of the developed world, yields on long-maturity Treasuries are at levels that have historically been associated with recessionary conditions. That leaves limited upside should a recession occur and significant downside should the economy escape recession. As a result, we’ve stayed short with our government bond positions.

So far this year, a quality approach has not been rewarded. Despite the long duration of the expansion and deteriorating credit fundamentals, the lowest-quality bonds have performed the best in 2016. A reversal in oil prices, which were putting stress on many issuers in the high-yield bond market last year, has helped the sector. Aggressive policy actions by the Bank of Japan and the European Central Bank (ECB) have also likely helped lower-quality corporates in 2016. The Bank of Japan lowered rates into negative territory, as did the ECB. And the ECB went so far as to announce a plan to buy corporate bonds, including those issued by euro-area subsidiaries of U.S. firms.

In our view, because of the resulting policy actions of the world’s major central banks, we now have a situation that has become familiar over recent years—monetary policy is distorting asset prices. We believe with credit fundamentals deteriorating and what we consider to be an artificial pricing element in the corporate bond market, an emphasis on quality remains the prudent investment strategy.

Have a good month. As always, please call us at (888) 456-5444 if your financial situation has changed or if you have questions about your investment portfolio.

Warm regards,

matt-org-sign

Matthew A. Young,
President and Chief Executive Officer


Gold’s Role is to Hedge Against Inflation Risk

April 2016 Client Letter

The beginning of 2016 was a surprise to most gold investors. After falling at a 9.1% compounded annual rate for the proceeding four years, the metal was up 16% in the first quarter —the largest quarterly gain in three decades. We first purchased gold in 2005 with a position in SPDR GoldShares ETF (GLD). Since that time, despite significant volatility, gold has posted an unexpected average annual return of nearly 10%.

Gold’s Role is to Hedge Against Inflation Risk

One of gold’s basic roles in an investment portfolio is to hedge against inflation risk. Inflation is a destructive force that can decimate a lifetime’s worth of savings. Over the last 30 years, inflation has eroded the purchasing power of the dollar by nearly 56%. And this has been a period of modest inflation. When factoring in a period of high inflation, the math looks much worse. Since the 1970s, the purchasing power of the dollar is down an astonishing 84%.

These numbers may appear too long-term to worry about today, but for investors on the verge of retirement, they present a tangible risk. People are living longer and more active lives. Retirement planning is now a multi-decade affair. According to the Society of Actuaries, a 65-year-old couple faces a 45% chance that one partner will live to 90 and an 18% chance that one partner will live to 95. That’s 30 years of retirement and 30 years of income planning.

A portfolio of stocks and bonds undoubtedly helps lessen the blow of inflation, but may not be enough protection from an all-out inflation assault. When inflation accelerates meaningfully, interest rates rise, and stock and bond prices tend to decline. One of the worst 16-year periods for stocks in history was from 1965–1981, a period of elevated inflation. Gold can help smooth out returns during these inflationary episodes.

This doesn’t mean that gold will offset inflation each and every year, or that gold, like stocks, will not experience periods of poor performance. As indicated above, the four years prior to 2016 were challenging. Some investors have looked at this period as a reason not to own the precious metal. But investors should not expect smooth returns from gold. Gold tends to bounce around more—and in different ways—than other assets.

We favor gold to guard against the risk of high inflation, market crashes, currency crises, financial and economic instability, and geopolitical upheaval. We view gold as an insurance policy of sorts. Gold helps reduce risks that are not easily diversified with a traditional portfolio of stocks and bonds.

It Could be Easy to Become Complacent

As the last financial crisis fades from memory, it could be easy to become complacent and assume the worst is behind us. In our view, such reasoning is a mistake. Many global challenges exist with untested solutions being used to address these problems.

A report last year from The McKinsey Institute paints a grim picture of the buildup in global debt. With all the talk of deleveraging and austerity, one might have logically concluded that a lot of debt has been taken out of the system since the financial crisis.

This unfortunately has not been the case. According to McKinsey, since 2007, debt has grown by $57 trillion, raising the global debt-to-GDP ratio by 17 percentage points. Government debt has grown by $25 trillion since 2007, and it is expected to continue to rise in many countries given current economic fundamentals. For the most indebted countries, implausibly large increases in real GDP growth or extremely deep reductions in fiscal deficits would be required to start deleveraging. China has been at the forefront of global debt growth. McKinsey’s data shows that China’s debt has quadrupled since 2007, rising from $7 trillion to over $28 trillion. At 282% of GDP, China’s debt as a share of its economy is now larger than that of the U.S. or Germany.

How will overly indebted economies deleverage if faster growth or spending reductions aren’t viable solutions? And what will happen to these economies during the next cyclical downturn, when incomes drop and debts rise? There may be a thread-the-needle solution that doesn’t result in financial disruption, but in our view, the easiest and most probable solutions for governments will be to either: a) inflate away the debt or b) default on the debt. Gold is an asset we want to own should either of these “solutions” come to pass.

We also want to own gold as the world’s central banks continue their unprecedented (some might say experimental) monetary policy interventions, which have included 600 interest rate cuts, $12 trillion of asset purchases, the imposition of negative interest rates, and talk of so-called helicopter money.

The Dangers of Helicopter Money

Negative interest rates and helicopter money are the latest from the world’s central banks. Negative interest rates have been greeted with mixed results thus far, so we have started to hear more and more about helicopter money. When economists talk about “helicopter money,” they’re referring to money that central banks print to either hand directly to citizens or to buy government-issued bonds, which are then cancelled.

The proliferation of new and untested monetary policy tools has not yet resulted in significant financial turmoil, but monetary policy is clearly in unchartered territory here. The unintended consequences of these policy actions remain an ever-present risk, which makes gold all the more desirable in our view.

Like stocks and bonds, we view gold as a strategic asset class that should be held long-term. Based on the performance of gold over the last several years, it would have been easy to sour on the metal and sell. It is certainly advisable to sell losers if they do not have a place in a portfolio and do not fit with an overall plan; but, as I have tried to make clear, gold is part of our plan. What is not part of our plan is to sell an asset based solely on performance.

Selling an asset on the basis of performance is a strategy that can sabotage portfolio returns. Work by market research firm Dalbar has shown over and over that when investors sell in despair and buy on euphoria, they sacrifice return. The result of this emotionally charged approach to portfolio management has been dismal. Dalbar’s data shows that for the 30-year period ending in 2014, the S&P 500 would have compounded investors’ money at an annual rate of over 11%, but the actual return of the average equity-fund investor was only 3.8%. The same is true of bonds. Dalbar reports a 30-year return of 7.4% for the Barclay’s Aggregate Bond Index, but only 0.72% for the average fixed-income fund investor.

With an asset like gold, where decisions to buy or sell can be even more emotionally driven, one can only guess how poorly the average gold investor would have fared relative to the performance of gold. (Dalbar doesn’t offer data on gold returns).

We don’t cite the Dalbar statistics to advocate a buy-and-hold-forever investment strategy. We favor a strategy focused on the long run, but realize the need for making portfolio adjustments. Reasons for trades may include shifting company prospects, emerging competitive threats in an industry, new or changing secular trends, vastly overstretched valuations, tax-loss harvesting, or, at the investor level, shifting risk tolerances or changing financial circumstances.

Regular, Annual, Dividend Increases

Over the last year, much equity portfolio activity was driven by our continued focus in favoring companies with a history of making regular annual-dividend increases.

The sale of Weyerhaeuser, which completed its acquisition of Plum Creek Timber earlier this year, is an example of a security we sold because it didn’t have a favorable record of regular dividend increases. With the proceeds from Weyerhaeuser, we bought General Mills, Lowe’s, Texas Instruments, or CVS.

General Mills, the maker of Cheerios and Bisquick, also owns powerhouse organic brands, including Annie’s, of mac and cheese fame, and Cascadian Farm. General Mills has recently launched a new cereal line based on its Annie’s brand of organic foods. The bunny-shaped cereals are all organic and rely on whole grains, natural colors and flavors, and fair-trade cocoa to sell units. Although not exactly health food, it’s enough of an improvement over the current sugar-filled, artificially flavored and colored offerings to bridge the gap to new innovations from General Mills. General Mills has increased its dividend for 11 consecutive years.

Lowe’s is the second largest home improvement chain in America. The housing market is in recovery. It is by no means in what could be considered “strong” territory yet, but improvement is obvious. Building permits, new home sales, and existing home sales have all trended up over the last 12 months. Lowe’s is a major beneficiary of increased activity in the real estate market. Lowe’s has increased its dividend for 53 consecutive years.

Texas Instruments is a leader in the analog chip business. The two most important opportunities in the semiconductor industry are analog and embedded processing. Most electronic devices use embedded processing, and all of them use analog in one way or another. The customer base is highly diversified, and the product cycle for the chips’ devices is measured in years or decades, meaning stability for Texas Instruments as customers keep coming back. Texas Instruments has increased its dividend for 11 consecutive years.

CVS is America’s leading pharmacy with more than 9,600 locations. It’s easy to understand the impact of 9,600 retail pharmacies on CVS’s business, but the largest revenue driver at CVS is actually the pharmacy services segment. The business offers a full range of services like plan design, Medicare Part D services, mail order prescriptions, clinical services, and more. This out-of-sight business generated nearly $24 billion in revenue in the first quarter alone. CVS has increased its dividend for 11 consecutive years.

When investing in companies with a history of annual-dividend increases, we are putting the odds in our favor of not only getting a pay raise each year, but also helping us keep pace with inflation. By combining the dividend increasers with the gold component, we are even further helping to offset the negative effects of inflation and hopefully reducing portfolio volatility during more problematic environments.

Have a good month. As always, please call us at (888) 456-5444 if your financial situation has changed or if you have questions about your investment portfolio.

Warm Regards,

Matthew A. Young,
President and Chief Executive Officer

P.S. The first quarter of 2016 was a bit friendlier to dividend payers than last year. The big correction in the first quarter and accompanying concerns about slowing economic growth pushed global central banks to inject more stimulus into the financial system, which helped drive down long-term interest rates. The threat of a global cyclical downturn and falling long-term rates helped act as a one-two punch for many of the defensive dividend-heavy sectors we favor, including consumer staples, utilities, and telecom. While we are pleased to see the gains, we aren’t overenthusiastic, just as we weren’t overly pessimistic when these same sectors lagged the more speculative sectors last year.

P.P.S. “Why is Hong Kong rich, Cuba very poor, and Puerto Rico struggling? Back in 1955, the islands of Puerto Rico, Cuba and Hong Kong had roughly the same real per capita income. They each took very different economic paths. Now, some 60 years later, Hong Kong is even richer than the United States on a per capita income basis. Cuba is an economic disaster, having gone from the richest Caribbean nation to the poorest, next to Haiti. And Puerto Rico finds itself flirting with bankruptcy, with a per capita income much higher than Cuba’s but only roughly half that of Hong Kong. Incomes have increased approximately 22-fold in Hong Kong, 11-fold in Puerto Rico, and only fourfold at best in Cuba, in a little over a half-century.

Cuba is relatively rich in natural resources, and Puerto Rico has some, but Hong Kong has almost none. The improbable success of Hong Kong and the improbable failure of Cuba is a direct result of the economic policies each followed. Hong Kong is perhaps the best example of what can be achieved under the rule of law, with limited government and free markets. Cuba is a poster child of how rule by man rather than law, coupled with government ownership of the means of production and the destruction of the price system, results in no freedom and a great deal of poverty.” –Richard Rahn, The Washington Times, March 28, 2016

P.P.P.S. Christopher Balding recently wrote the following in Bloomberg about China’s economy:

First, the golden age of Chinese construction is over. There’s now enormous surplus capacity in virtually every industry that requires fixed-asset investment. Companies can no longer rely on the “Beijing put” of new government stimulus to boost growth. Iron ore producers and copper miners all need to begin a painful process of downsizing and deleveraging — just as China’s bloated state-owned enterprises do. Producers around the world haven’t faced up to the new normal.

Second, companies of all stripes have to put in the effort to understand China better. Expectations of double-digit growth, regardless of how poor the performance, have vanished. Luxury brands that once hoped their Beijing flagships would smooth the balance sheets at European headquarters need to recognize that different markets require different strategies, and that shops in China won’t run on autopilot. They need to compete.

Third, companies and countries alike need to face up to their own irrational exuberance. Whether it’s failing to diversify, spending recklessly on the back of high prices, or taking on too much debt, fundamental mistakes can’t be blamed on China. Doing so only delays the inevitable.


Stocks for the Long-run?

March 2016 Client Letter

Investing in stocks for the long run has become the accepted wisdom of many investors over recent decades. The media, pundits, and promoters, as well as many brokers and advisors, recommend stocks as the most suitable asset class for investing over the long run. Stocks win over the long run, cash is trash, and bonds are boring, investors are told. The bull markets of the 80s and 90s surely greased the wheels of the “stocks for the long run” band wagon. Jeremy Siegel, professor of finance at Wharton School of Business, even wrote a book on the subject.

Professor Siegel’s data showed that a $1 investment in U.S. stocks at year-end 1801 grew to almost $600,000 by 2001. That same $1 invested in bonds grew to only $952. Stocks not only won, they annihilated bonds.

Doesn’t this prove that an all-stock portfolio is the best long-term investment? Prove is strong language when talking about matters of the future. However, historical evidence supports the case for stocks as the winning strategy, especially when considering a long time horizon.

For those with a 200-year time horizon, I say, by all means load up on stocks. But others, including those in or near retirement, may find an all-stocks strategy less appealing.

What is Your Long-run Investment Horizon?

Historical records show stocks can remain depressed for agonizingly long periods of time. The Dow required nearly 25 years to recover from its 1929 pre-crash high. From 1965 through 1981, the Dow didn’t gain a single point while inflation raged.

Investing in equities over the last 16 years has also produced disappointing results. So far this century, stocks have posted only modest single-digit annual returns.

Sixteen years, a significant amount of time, could account for most of one’s retirement. And given today’s bull-market run, beginning in 2009, equity returns may be modest at best in the years ahead. Additionally, a bear market can’t be ruled out, which would make a substantial dent in gains made during this stretch.

For most retired investors and those nearing retirement, we continue to favor a balanced portfolio featuring cash-producing stocks and bonds. Stocks do win over the long run, but bonds may help round off the peaks and valleys, providing the comfort of stability during retirement years.

Investing in Dividend Growth Stocks

In years past, our stock purchases have focused on dividend payers. Today, we have fine-tuned the strategy to place further emphasis on companies with a history of making annual dividend increases. Not only will dividend increases help combat the nasty effects of inflation, but dividend increases can also act as a magnet in lifting a stock’s price higher.

Kimberly-Clark

By example, take our favored Kimberly-Clark. At year-end 1999, Kimberly-Clark shares closed at $61.66 and paid a dividend of $1.04 per share for a yield of 1.7%. Sixteen years later, with the help of numerous annual dividend increases, Kimberly-Clark pays a dividend of $3.68 per share. If Kimberly-Clark shares were still trading at their year-end 1999 price, the stock would yield 6%. Investors would be falling over themselves to buy one of America’s great consumer products franchises at a 6% yield. But instead of trading at $61 per share, Kimberly-Clark today trades at $133. A more than tripling of the company’s dividend acted like a magnet, helping to lift the share price higher.

As much as we admire Kimberly-Clark, we do not want to rely too heavily on a small group of stocks. With individual companies, dividends can get cut and business prospects can change. But with a diversified portfolio of dividend-payers, these risks are reduced. One example of an index investing in dividend-paying stocks with a history of regular increases is the S&P Dividend Aristocrats Index. This index tracks a portfolio of companies that have increased their dividends each year for at least 25 consecutive years. How did the Aristocrats perform relative to the broader market over the last 16 years? Past performance is no guarantee of future results, but from year-end 1999 through 2015, the S&P Dividend Aristocrats Index increased at a compounded annual rate of 9.7% compared to 4.05% for the S&P 500.

Dividends and Dividend Growth: A Foundational Stock Investing Strategy

Investing in companies with a history of making regular annual dividend increases is the foundation of our equity strategy. We manage global equity portfolios focused primarily on individual dividend-paying companies. Our dividend mandate is a policy we believe distinguishes our approach from the approach of other advisors. The trend in the industry has been toward index-based exchange-traded funds (ETFs). While index ETFs may have cost benefits compared to the more expensive actively managed mutual funds, they are by no means perfect.

We see flaws in the ways many ETFs are constructed, the expenses and transaction costs of some, and the liquidity of others. And we would find it difficult to replicate our strategy solely with ETFs. We don’t weight positions by market capitalization, as so many ETFs do; we are selective in where we invest abroad, in the industries we favor or eschew, in the currency risks we take, and in the businesses in which we want to invest.

The same is true of our fixed-income holdings. Bond ETFs—or at least the most liquid bond ETFs—tend to benchmark their portfolios to the entire bond market or an entire segment of that market. Trying to tailor a portfolio for a specific type of maturity risk or credit profile is difficult with bond ETFs. Bond ETFs also have the disadvantage of trading at what we consider to be wide premiums and discounts to the underlying value of their holdings.

Investing in Individual Bonds

Our approach to managing fixed-income portfolios has been to include individual bonds and traditional, lower-cost mutual funds. The combination allows us to tailor portfolios for maturity and credit risk. With interest rates still at levels historically associated with recessionary conditions, we continue to favor a short-maturity portfolio. During the last 12 months, we have also scaled back on credit risk. While we aren’t attempting to forecast a recession, we believe the economy is in the later stages of the cycle. During recessions, lower-quality bonds tend to perform poorly.

Understanding GNMA Securities and Funds

Our higher-quality bonds include Treasuries, investment-grade corporates, and one of our long-time favorites, GNMA securities. GNMA securities are not like conventional bonds. Conventional bonds pay interest during the life of the bond and pay back all principal at maturity. GNMA securities are mortgage-backed securities, or bonds backed by payments on mortgage loans. The loans are pooled and then, out of those pools, securities are issued that entitle holders to a share of interest and principal. GNMAs are the only mortgage-backed securities explicitly backed by the full-faith-and-credit pledge of the U.S. government.

Since GNMA securities are backed by the U.S. government they are free of credit risk; but they do carry prepayment risk and extension risk. Prepayment risk is the risk that principal will be repaid before maturity. Why is getting paid early a risk?

Let’s say you invest in a GNMA security, and every mortgage backing that security has a 6% rate. Fast-forward one year and assume mortgage rates have fallen to 4%. Further assume every mortgage backing the GNMA security is refinanced to lock in that lower 4% rate. As the investor in this GNMA security, the entire balance of your principal is returned to you. You can reinvest in another GNMA security, but the prevailing rate on GNMA securities is now only 4%. Instead of earning 6% on your money, you now earn 4%.

Extension risk is the opposite of prepayment risk. When interest rates rise, the rate of prepayments on GNMA securities slows, which effectively extends the maturity of a GNMA security. This can result in a longer maturity bond than originally invested, just as interest rates are rising. The combination of higher rates and a longer maturity results in a lower price.

While interest rates are the big factor determining the percentage of a pool of mortgage-backed securities paid back ahead of maturity, it is not the only factor. The rate of prepayments on a pool of mortgages also depends on the historical path of interest rates, housing turnover, the aging of loans, seasonality, and credit conditions, among other factors.

With interest rates still near historic lows, the risk that investors should worry about today is extension risk. How much are investors in GNMA securities being compensated for taking extension risk? According to the Merrill Lynch GNMA Index, GNMA securities yield about 2.4% today. That compares to 1.55% for Treasuries with similar maturity risk. A 2.4% yield is not going to spin your straw into gold; but compared to Treasury securities, GNMA investors appear to be getting a fair shake. In today’s yield-starved environment, we believe GNMA securities can play an important role in fixed-income portfolios.

Investing is often looked at as an offensive process where the goal is to earn the highest return possible. For investors with long time-horizons and the ability to shrug off chaotic markets, then the highest return goal may make sense. Investors in this group may favor a reduced fixed-income allocation. But those with shorter time-horizons, income needs, or who find financial crisis difficult to endure will find greater comfort with a more defensive portfolio.

Defensive investors can still have the goal of making money and keeping pace with inflation. But they also have the goal of avoiding periods of serious loss. We believe defensive investing should include a diversified portfolio of bonds, precious metals, and dividend-paying stocks. The exact mix will vary among individuals based on numerous factors, including past experiences, risk tolerances, income sources, and total portfolio of assets.  

Have a good month. As always, please call us at (888) 456-5444 if your financial situation has changed or if you have questions about your investment portfolio.

Warm regards,

Matthew A. Young
President and Chief Executive Officer

P.S. As of early February 2016, global central banks have cut rates 637 times and spent $12.3 trillion on assets since the financial crisis, according to Bank of America. In addition, the bank estimates 489 million people live in countries with negative interest rates. Despite all this central bank intervention, inflation remains soft in many advanced economies. Now there is speculation that governments may look to sell short-term debt straight to their central banks for newly printed cash, which could be directed straight into the economy through tax cuts or spending programs. The strategy has been referred to as “helicopter money.” The helicopter strategy has many sceptics who say it will not work over the long term, just as the rate cuts and rounds of quantitative easing did not work. One doubter is HSBC Senior Economic Advisor Stephen King: “The helicopter option is simple, easily implemented and, for some, offers the closest thing to a free lunch. If this sounds too good to be true, that’s because it is.”

P.P.S. Signs that the current economic cycle could be on its last legs may be showing up in the U.S. commercial real estate market. February sales of $25 billion worth of office buildings and apartment complexes was a significant decline compared to $47 billion in February of 2015.

P.P.P.S. GE decided to leave Fairfield for Boston most likely due to Connecticut’s high-tax and high-regulation policies. Hartford politicians, like many, refuse to understand that there can be no high paying jobs without successful businesses. And, you cannot start a business without investment. Punitive taxation and burdensome regulation will stop investment in its tracks and limit the number of new successful businesses. If Connecticut stays the policy course, the state will reduce the number of entities to tax. Not a good thing when you face a $266-million budget shortfall, as they do for fiscal year 2016. To help make ends meet, Connecticut is now setting its sights on Yale University’s endowment. A proposed bill in the state is looking to tax a share of the endowment’s currently tax-exempt annual investment gain. This, despite the fact that Yale makes an $8.2-million voluntary payment to New Haven and employs about 13,000 people.

P.P.P.P.S. We recently updated both Part 2A and Part 2B of our Form ADV as part of our annual filing with the SEC. This document provides information about the qualifications and business practices of Richard C. Young & Co., Ltd. If you would like a free copy of the updated document, please contact us at (401) 849-2137 or cstack@younginvestments.com. There have been no material changes since the document was last updated on March 26, 2015.


Bear Market in Global Stocks

February 2016 Client Letter 

The stock market volatility that started in January continued into February. Up until mid-February, global equity market indices recorded lower lows and lower highs. Many equity markets entered bear markets. According to its widely accepted definition, a “bear market” describes a decline of 20% or more from the prior bull-market high. By that definition, the S&P 500 hasn’t officially entered a bear market, but over 75% of the 3,000 largest U.S. companies have fallen at least 20% from their highs. That’s a quorum by our count.

Bear Market in Small-Cap Stocks

Small company U.S. stocks have officially entered bear-market territory. The small-company Russell 2000 Index has fallen 26% from its bull-market high. And as of early February, the MSCI All-Country World Index—the gold standard of global stock market indices—crossed into bear country. Emerging market stocks have long been in a bear market, and foreign-developed world equities arrived in bear territory in January.

With the U.S. economy still plugging along at a moderate pace of growth, why are stocks falling so sharply? Some have attributed the selling to the continued drop in oil prices and the strain energy company defaults may put on the global financial system. Others have cited the recession now underway in the manufacturing sector of the economy and slowing global growth as causes for concern. The liquidation of sovereign wealth funds has also been viewed as a catalyst for the selling. As has a potential currency devaluation in China and other emerging nations.

While all of these factors may be contributing to the sell-off, investors have been at a loss to fully understand the persistent weakness in stocks. You might call it a correction without a cause, which, for the record, the chartists insist is the most dangerous kind.

What is Young’s view on the correction? There isn’t a single catalyst we can point to with any degree of confidence to fully explain the most recent down-leg in stocks. But we have been consistent in saying for years now that the QE-fueled ascent of stock prices was unlikely to end with roses and butterflies.

In our view, by deliberately holding rates at zero and flooding the global financial system with liquidity, the Fed and its foreign counterparts purposefully drove up asset prices to levels not adequately supported by fundamentals.

We’ve run the following chart more than a couple of times over the last few years (including in January), but I think it provides a useful illustration of market dynamics in the post-financial crisis era. Every time the Fed has laid on the monetary accelerator with quantitative easing, stock prices have risen far above fair value (according to our estimates). And every time the Fed has let off the gas, stock prices have reverted back toward our fair-value guide. Correlation doesn’t guarantee causation, but one should not ignore the fact this indicator is three for three.

As shown in the chart, during the latest episode, the descent toward fair value has taken more time to unfold and it hasn’t been as sharp as prior corrections. That may have something to do with the Bank of Japan and the European Central Bank ramping up stimulus of their own just as the Federal Reserve was unwinding QE.

Our S&P 500 vs. Fair-Value Guide isn’t intended to predict stock prices. We use it more as an indicator of risk. It is possible stock prices won’t hit our fair-value guide before reaching new highs. The Fed could always announce another quantitative easing program or come up with a new policy tool in an effort to stimulate economic growth through asset price inflation.

Central Banks are Already Dreaming up New Policies to Stimulate

The world’s other central banks are already dreaming up new and creative (some might say desperate) policies to stimulate their economies.

The latest foray into real-time monetary experimentation comes courtesy of the Bank of Japan (BOJ). At its last policy meeting, the BOJ decided to go negative with interest rates. The BOJ cut the rate on new reserve deposits held at the bank to -0.10% from +0.10% and hinted it could reduce rates further into negative territory.

The negative interest rate policy comes on the heels of a bond-buying program (still under way) that has led to the monetization of 30% of Japan’s outstanding government debt and a balance sheet that is now equal to over 70% of the country’s annual GDP. The BOJ has bought everything from government bonds to Japanese stocks (the BOJ owns half of the ETF market in Japan). Japan’s QE program has failed to generate the 2% inflation target the BOJ is after, so policymakers decided to try a different tactic.

The BOJ joins the European Central Bank and the central banks of Denmark, Sweden, and Switzerland that have also cut rates into negative territory. The latter three have gone negative mainly because they have little choice. The citizens of European countries who use the ill-fated euro would much rather hold francs, krona, or krone than euros; but Switzerland, Sweden, and Denmark are tiny compared to the euro area. Hot money-flows into these countries can unduly drive up the value of their currencies and destabilize their economies. Negative rates are a necessary deterrent to these volatile safe-haven flows from the euro zone.

The BOJ’s negative interest rate policy has a different aim than deterring safe-haven flows. Inflation is the goal. It seems odd to charge banks for holding reserves if one’s goal is higher inflation. Banks are the institutions that convert base money into broad money, which is the raw material of inflation. If you erode their capital, they may convert reserves to cash or lend less to the private sector.

We also find it surprising central bankers haven’t considered the potentially longer-run deflationary implications of negative rates. It would seem to us that the BOJ’s renewed efforts to debase the yen (what negative rates tend to do) would accentuate the deflationary impulse in the global economy and ultimately be more negative than positive for global growth.

Japan is a big export-oriented economy. When it debases its currency, it weakens growth; causes competitor nations to retaliate with similar currency, weakening monetary policy; and ultimately leads to lower—not higher—inflation.

Monetary Policy Desperation

We view the embrace of negative interest rates by the global central banks as a sign of monetary policy desperation. Central banks have few if any sensible policy tools left in their arsenal. Anything beyond a few basis points into negative territory for rates is probably unsustainable in the medium-term. If central banks try to go too far down this path, investors, bankers, and depositors will probably start to hoard cash—it’s shocking they aren’t already.

How are we positioning our clients’ portfolios to deal with what may be a new iteration of misguided monetary activism? As we have advised for years, we continue to favor a globally diversified portfolio of dividend stocks, bonds, and precious metals. This type of diversification forms the foundation of our investment philosophy at Richard C. Young & Co., Ltd.

Properly diversified portfolios seem to fall in and out of favor with the investing public. In recent years, when U.S. stocks were the only asset class performing well, diversification fell out of favor. Nobody wanted to own fixed income—the yields were too low. TINA (There Is No Alternative to stocks) became the rallying cry of the big brokerage houses and their clients.

One major benefit of crafting a properly diversified portfolio is counterbalancing. With a counterbalanced portfolio, you will never have a portfolio with the highest return in any single year, but you also reduce knock-you-out-of-the-game losses that sabotage the retirement savings of so many.

Vanguard GNMA, a long-time holding in many of our clients’ fixed-income portfolios, provides a powerful example of the benefit of counterbalancing. Vanguard GNMA hardly gets investors excited during favorable years for stocks like 2014 and 2015. When the Nasdaq was up 14% in 2014 and 7% in 2015, Vanguard GNMA was up 7% and 1.3%. But in a period like 2016 when the Nasdaq fell 14% from its high, Vanguard GNMA provided investors with a 1.6% total return. GNMA’s steady stream of income is a source of cash for compounding, and it helps save the day during difficult environments.

Gold is another asset we own for clients that has been unloved for a few years, but is now showing its counterbalancing bona fides. It wasn’t surprising to us that gold was a drag on returns in 2013, 2014, and 2015 when equity markets were up big. We’ve written often to you that we buy gold and hope it goes down because typically when gold is down, everything else in your portfolio will be up.

So I guess it is with some dismay that I report gold (and gold stocks) are up big in 2016—more than 14% for the SPDR Gold Shares Fund. That compares to the 4.4% loss in the S&P 500, the 5.5% loss in global stocks, and the 8% loss in the Nasdaq.

As outlined earlier, we haven’t believed markets would gradually and nicely unwind after years of quantitative easing. The table was set for some type of payback, and when payback comes, gold is an asset that tends to shine. We continue to own gold as a hedge against years of quantitative easing, zero and negative rates, mispricing, misallocation, and currency risk. However, we do still hope it goes down in price.

Payback Coming for the Speculative?

Payback is also a theme that applies to our equity investing strategy. Our equity portfolios include companies that pay dividends and often have a long record of regular dividend increases. We also tend to favor more defensive businesses, such as those in consumer staples and healthcare. During bull markets, defensive areas of the market tend to fall out of favor with investors. Defensive stocks lag their more cyclical and speculative peers. This has certainly been true over the last few years with 2015 serving as an especially glaring example. Corrections and bear markets are when payback comes for the cyclical and speculative.

We haven’t yet seen a full-fledged bear market in the S&P 500; but, as our chart shows, from the bear market low in March 2009, the total return of the less volatile consumer staples sector is now slightly away from the return of the more volatile S&P 500. Healthcare shares are actually ahead of the market for the cycle, while utilities, having made up some ground recently, still lag a bit.

What’s the takeaway here? Retired investors and those saving for retirement can do just fine with a defensive portfolio of dividend-paying equities—if they are willing to ride out periods of soft relative performance.

Dividend-paying companies are often more durable businesses than are non-dividend-payers. Payers often have higher barriers to entry and stronger balance sheets than do non-dividend payers. And because there is a stigma associated with cutting dividend payments, the consistent payment of dividends is a signal of management confidence in the future prospects of a company. This is especially true of companies that raise dividends. These characteristics will not prevent a share price decline, but can offer some comfort during more difficult economic periods and periods of stock market volatility.

Have a good month and, as always, please call us at (888) 456-5444 if your financial situation has changed or if you have questions about your investment portfolio.

Warm regards,

Matthew A. Young

President and Chief Executive Officer

P.S. “The 70% decline in the price of oil since early 2015 will eventually turn out to have a positive impact on U.S. economic growth. Until now it has caused a dramatic decline of activity in the U.S. oil industry and in related manufacturing and construction firms. But the fall in gasoline prices alone has increased annual household spending power by about $129 billion or more than $1,000 per household. Although households have temporarily plowed much of this found money into savings, we are likely to see it lead to increased consumer spending in 2016 and 2017.” Martin Feldstein, The Wall Street Journal, 2/21/16

P.P.S. “In what could well be a final act of desperation, central banks are abdicating effective control of the economies they have been entrusted to manage. First came zero interest rates, then quantitative easing, and now negative interest rates—one futile attempt begetting another.

Just as the first two gambits failed to gain meaningful economic traction in chronically weak recoveries, the shift to negative rates will only compound the risks of financial instability and set the stage for the next crisis.” Stephen Roach, Project Syndicate, 2/18/16

P.P.P.S. Enclosed for your review is a brochure from the Federal Trade Commission identifying steps you can take to help protect yourself against identity theft. As indicated in previous letters, the threat of both identity theft and cybercrime continues to grow. Please contact us immediately if you have been or suspect you have been the victim of either.


A Stealth Down Year in Stocks

January 2016 Client Letter 

For many investors, 2015 was a challenging year. The S&P 500 managed to eke out a positive total return, but it was a handful of stocks (many of the more speculative variety) that carried the market. The average U.S. stock was down more than 4% last year. Take away Amazon, Netflix, Google, and Facebook and the S&P 500 would have finished in the red.

The following chart from Bloomberg presents the narrowness of last year’s stock market gains in another way. It compares the total return of the 10 largest S&P 500 stocks to the total return of the S&P 500 excluding the 10 largest stocks. Excluding the 10 mega-cap stocks, the S&P 500 would have fallen 5% last year.

Few investment strategies managed to finish in the black in 2015. According to Morningstar, the only U.S. equity mutual fund category that delivered positive returns was large-cap growth. The large-cap growth strategy favors what we consider to be more speculative shares including Netflix, Google, Facebook, and Amazon.

The average return of mutual funds in Morningstar’s remaining eight fund categories were down in 2015. The table below shows the average return in each of Morningstar’s nine equity-strategy Style Boxes. Value shares were punished the most.  

For conservative investors and investors focused on income, the news gets even more frustrating. According to Bespoke Investments, the average return of the 74 stocks in the S&P 500 that didn’t pay a dividend at the beginning of 2015 was almost 4%. The average return of the dividend-paying stocks in the index was -5.15%.

The chart below from Bespoke breaks the S&P 500 into deciles (10 groups) based on dividend yield at the beginning of 2015. The only group that managed to gain ground last year was the non-dividend-paying group. The highest-yielding stocks had the lowest returns in 2015.

If you believe the dividend record is an indicator of quality as Benjamin Graham advised and as we believe, then it would seem that the higher the quality and the greater the investment merits of a stock, the lower the return in 2015.

Investment strategies based on diversification, dividends, and the miracle of compound interest faced significant headwinds in 2015. It was an off year for high-quality businesses with durable competitive advantages and admirable dividend records. That’s no reason to abandon a winning strategy.

International Stocks Down in 2015

The difficult year for investors was not limited to U.S. equities. International-developed and emerging-market stocks were both down last year. Emerging market shares fell almost 15%. All 17 of Morningstar’s balanced fund strategies, 11 of 15 taxable bond categories, and all 6 alternative fund categories were also down last year.

Even precious metals, which often rise when everything else falls, had a difficult year. Gold and other precious metals are a unique holding in our clients’ portfolios. They are an exception to our focus on dividend- and interest-paying securities. And gold is the only asset we buy hoping it will fall in price. Why do we hope gold falls in price? Because most often when gold is down, everything else our clients own will be up. With loads of overly indebted countries in the global economy, a new era of aggressive central bank interventionism, and an ongoing global currency war, we view gold as a necessary counterbalancer.

Except for gold, which is up over 3% YTD, 2016 hasn’t started much better than where 2015 ended. The broad-based U.S. indices had their worst start to the year on record and are currently down about 10% YTD. Smaller capitalization stocks, such as those represented by the Russell 2000 Index, fell into bear market territory in January. Foreign shares, high-yield bonds, and commodities have also had a rough go of it so far in 2016.

While some investors have been rattled by the early January correction, equity markets started showing signs of potential trouble in 2015. In mid-August, the Dow and the S&P declined by more than 10% in about a week’s time. The Chinese market crashed from a bubble high; high-yield bonds sold off; energy markets continued to weaken throughout the year; and, as we alluded to earlier, the market was carried by a narrow group of stocks and investment strategies.  

As many of you know, we’ve had concerns about the nature of the rally for some time. We have written to you in the past about the Federal Reserve’s ultra-loose monetary policy distorting asset prices, creating bubble conditions in the market, and pulling equity returns from the future into the present.

Zero-percent interest rates and multiple rounds of quantitative easing successfully pushed equity prices up to levels that were not commensurate with the underlying fundamentals.

In our October 2013 client letter to you, we presented a version of the chart that follows and advised:

The problem with continuing QE is the potential for creating another bubble. We have seen this bubble situation before. In the early 2000s, high valuations were justified as a result of new efficiencies from technology and the internet. Leading up to 2008, then Fed chairman Alan Greenspan pointed to new credit derivatives as one reason why risks could be controlled by financial institutions. Today, the justification for excessive stock market valuations is the TINA (there is no alternative) factor. The Fed’s policy of holding short-term interest rates at zero and putting pressure on long-term interest rates has convinced many investors to bid up stocks to prices that imply dismal medium-term returns. As in 2000 and 2007, the Fed appears unmoved by the financial excesses that its policies are creating.

More than two years later and 15 months after the end of the Fed’s last money-printing campaign, the Dow is trading about where it was in October 2013. Meanwhile, some bonds that were seen as no alternative to stocks delivered greater returns than the Dow. Our favored Vanguard GNMA was up 7.5% to the Dow’s 7%, with much less volatility.

After a couple of years of equity market stagnation, fundamentals have started to catch up to prices, but there is still a way to go to get back to historical norms. What would it take for stocks to return to more normalized levels? There are two ways markets can adjust: through price or time. By our estimates, another two years of flat performance plus a further correction of about 5% would get the market back to about 16X normalized earnings. That’s right around the long-term historical mean level. Alternatively, an immediate 16% correction from current levels would also get the market back to its historical level. Of course, the market is prone to overshooting on the upside as well as the downside, so we’re under no illusion that the stock market will stop falling or start rising immediately after hitting our fair-value guide.

Even though we’ve had nagging concerns about the equity markets and have positioned our clients’ portfolios defensively, sharp corrections are still painful for many to endure and unnerving to watch. However, corrections are a regular part of the equity investing landscape. One reason stocks tend to provide greater long-term returns than bonds is because of this volatility.

The Frequency of Stock Market Corrections

Typically there are about three corrections of 5% or more in a 12-month period, and one correction of 10% or more. Corrections of 20% or more—which is the accepted definition of a bear market—occur every 3.5 years on average. We haven’t had a 20% correction in almost seven years.

We’ve been overdue for a big correction, but big corrections are no reason to abandon an investment plan. We’ve had many corrections since this bull market began.

From the March 2009 low through year-end 2015, the S&P 500 was up 248%, or nearly 20% per annum. During this time the S&P has had 15 corrections of 5% or more and 3 corrections that made it past the 10% mark. (The 2012 episode fell just short.) The market hasn’t had a 20% correction since the March 2009 low, though it came close in 2011. Below is a list of all corrections of 5% or more from the March 2009 low through January 2016. Shading indicates pullbacks of 10% or more.

What is driving this current down-leg in stocks? While there are likely a multitude of factors affecting prices, many investors seem to be focused on oil prices. Oil prices have fallen sharply over the last 18 months. Many oil producers are bleeding cash, there is concern that some overly indebted producers could default on their debt, and the downturn in oil is hurting some oil-exporting nations. A strengthening dollar has also contributed to oil’s slide.

There is little doubt this has been one of the worst environments on record for oil and oil companies. Twenty-eight-dollar oil seemed unthinkable only months ago, but is a reality today. We remain skeptical of the sustainability of $28 oil. Many fields are unprofitable at current prices, and bringing on much new production at sub-$30/barrel is a pipe dream. So, as has been true in past oil-price cycles, low prices should eventually be the cure for low prices. Demand is growing at about one million bbls of oil per day. The natural decline rate of existing oil wells is about 4% or almost four million bbls per day. Excess supply is currently in the neighborhood of two to three million bbls per day. If the low oil price prevents new production from coming online to replace declining fields, the oil market could turn from a surplus to a deficit within the year. That’s not a forecast, but we do remain reasonably comfortable with our energy positions and the prospects for a future rebound in this sector.

Consumer Staples Lag in Bull Markets

We also remain comfortable with our significant weighting in consumer staples companies. Consumer staples stocks are the largest component of our equities portfolios, and they are among the more defensive areas of the market. Staples stocks tend to be a drag on performance during bull runs, but they make up for it during corrections and bear markets. From the stock market bottom on March 9, 2009, through year-end 2013, the S&P 500 gained 203% compared to consumer staples’ 157% gain. From year-end 2013 through January 20, 2016, the S&P 500 gained 5% to consumer staples’ 18%. The total return gap between the two sectors has narrowed from 46% to 15% and the stock market has yet to experience a full-blown bear market.

Many of the consumer staples stocks we invest in have high barriers to entry, durable competitive advantages, and low sensitivity to the business cycle. In our view, many of the market’s best dividend stocks are in the consumer staples sector. Consumer staples stocks often have higher dividend yields and stronger dividend growth than stocks in other sectors. We believe high dividends today and the promise of higher dividends tomorrow are a powerful tonic for retired investors and those soon to retire.

Have a good month and, as always, please call us at (888) 456-5444 if your financial situation has changed or if you have questions about your investment portfolio.

Warm regards,

Matthew A. Young
President and Chief Executive Officer

P.S. “What’s the best action you can look for in a stock? A long record of increasing dividends. Many lies can be told about a stock, but dividends don’t lie. In order to increase dividends, a stock must create a history of producing cash. Analysts can lie, CEOs can lie, but dividends don’t lie. A company must increase its actual earnings in order to raise dividends.” Richard Russell, editor of the Dow Theory Letters.

P.P.S. We eliminated our position in the Fidelity Floating Rate High Income fund late last year. It is our view that we have reached the peak in the credit cycle. Credit fundamentals have started to deteriorate and lower-quality bonds have sold off. The illiquidity in bond markets created by new regulations has also become worrisome in light of the soured sentiment on the sector. We have been investing the proceeds in higher-quality individual bonds and selecting lower-quality individual bonds that we continue to view as creditworthy.

P.P.P.S. Investors could face a challenging 2016 even if equity markets rebound. In discussing the errors of the Federal Reserve and the U.S. government, David Malpass writes in the February 8, 2016, issue of Forbes:

The Federal Reserve and other financial regulators have been aggressively deflationary, driving the dollar up and prices down, starting with gold in 2011. Both the Fed’s zero interest rate and its post-2009 bond buying have been giant mistakes, causing global growth to grind to a near halt.

The monetary policy burden has been compounded by a lack of structural reforms in the U.S., Japan and Europe. The U.S. government spends without a meaningful budget, squandering hundreds of billions of taxpayer dollars per year while imposing a regulatory maze that’s almost impenetrable. Our personal income tax system is in shambles. Our corporate tax rate is one of the world’s highest, causing corporate flight, while some of our strongest companies keep their cash abroad to avoid confiscatory tax rates at home.