A Lack of Breadth

November 2015 Client Letter

Despite modest gains in the U.S. stock market this year, most U.S. stocks are down year-to-date. Outside of a handful of names, it has been a challenging year for equities and most especially for global equities.

In the chart below we compare the performance of big U.S. stocks to small U.S. stocks, foreign developed market stocks, and emerging market stocks. The only group that has managed to stay out of the red YTD is big U.S. stocks.

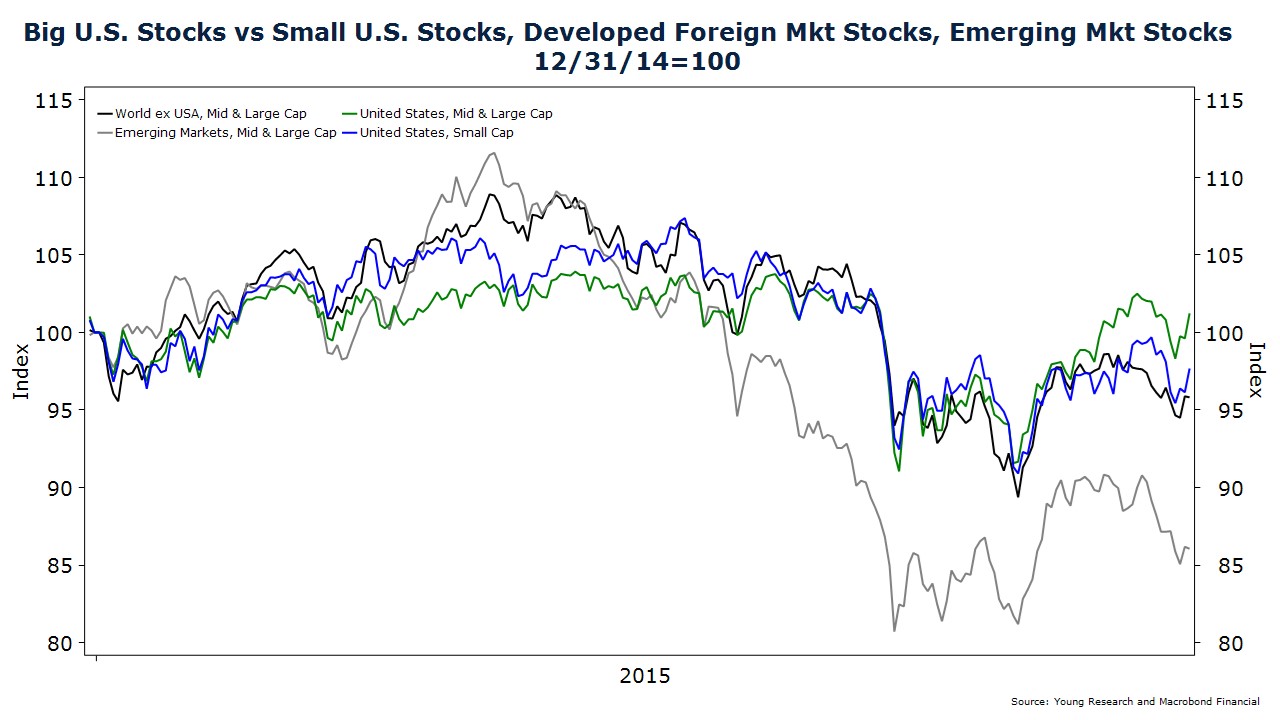
How have the big-cap U.S. stocks managed to stay in positive territory when most companies in these indices are down on the year? Fewer and fewer big stocks are responsible for the gains. Analysts call it a lack of breadth. A recent USA Today piece explains.

In Wall Street-talk, a lack of market breadth refers to a condition when just a handful of stocks—normally large-company names with big market values—drive the performance of major stock indexes such as the Standard & Poor’s 500 index that are weighted by market-capitalization. Wall Street views stock rallies driven by a smaller and smaller pool of winning names as a sign of market weakness, lack of leadership and a dearth of strength under the surface of the broader market.

The term “Nifty Fifty” was born back in the late 1960s when a handful of growth stocks, such as IBM, Polaroid, McDonalds, drove the market up to dizzying heights before falling hard and wringing out all the exuberance in the 1973-74 bear market. A handful of hot tech stocks back in 2000 also drove the Nasdaq to dizzying heights before the tech stock crash.

“The 10 largest stocks in the S&P 500 have contributed more than 100% of the year’s roughly 2% gain” heading into this week’s trading, Verrone and Sohn noted. “By comparison, both 2013 and 2014 saw the 10 largest stocks contribute less than 20% of the year’s advance.” The 10 biggest stocks in the index accounted for just 19% of the gains last year and 15.2% of the index’s return in 2013.

The companies driving performance to the upside include the Amazons, Netflixes, Googles, and Facebooks of the world. Outside of these big-cap shares, the market has been weak. Quoting again from the USA Today piece:

To get a better picture of the ugliness under the surface of the market, read below all the sectors of the market that are in “poor shape,” says Kaltbaum. “We are not making this up.”

He says interest-rate sensitive areas like utilities, real estate and housing have topped or topping out [sic]. Add to that gold and silver, steel, junk bonds, rails, truckers, transports, farm machinery, disk drives, drug stores, hospitals, managed care, media, most commodities including steel, copper and aluminum, hotels, retail especially department stores, and restaurants. And just recently Kaltbaum says food, drugs, beverages, tobacco and household products, insurance, construction equipment and machinery, casino and gaming have joined the group. “Lastly, most oils, while rallying some and turning a little bit—are still not leading,” he says. “This just shows you what a big-cap market this is underneath the surface.”

So to summarize, the businesses that make things, move things, provide life-saving medical care, or produce food and hygiene products are lagging while a few websites and gadget makers are driving the market higher.

Investors who don’t own these Internet stocks and gadget makers are having a rough go of it. Fund managers who tend to be evaluated on a much-too-frequent quarterly or annual basis are taking serious career risk if they don’t own Google or Netflix. The risk of underperformance is so great that some submit to the pressure and chase returns by buying these riskier assets. But in our view it is difficult to argue that any manager buying these stocks is adhering to the Prudent Man Rule.

The Prudent Man Rule

The Prudent Man Rule directs trustees “to observe how men of prudence, discretion, and intelligence manage their own affairs, not in regard to speculation, but in regard to the permanent disposition of their funds, considering the probable income, as well as the probable safety of the capital to be invested.”

We doubt that many portfolio managers believe Netflix, trading at over 385X earnings, is anything but a speculation. It’s owned widely because many feel they have to own it if they want to remain gainfully employed. That’s not to say Netflix isn’t a useful service, or that Apple doesn’t make great products. I’m a Netflix subscriber and I own many Apple products, as I am sure many of you do. But companies that make great products don’t always make prudent investments.
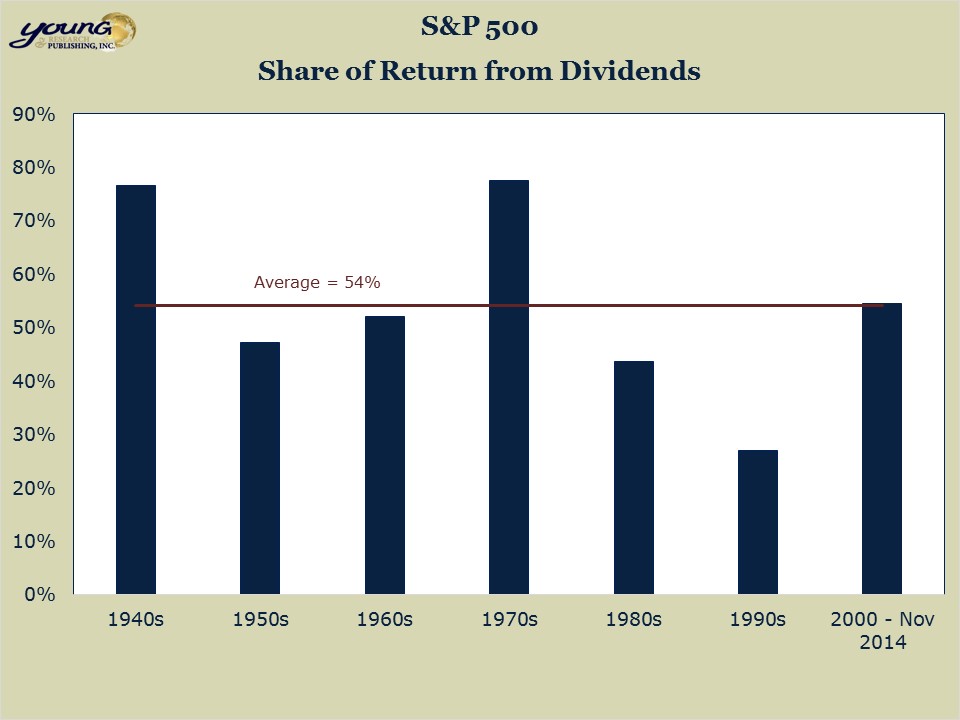
Focus on Dividends

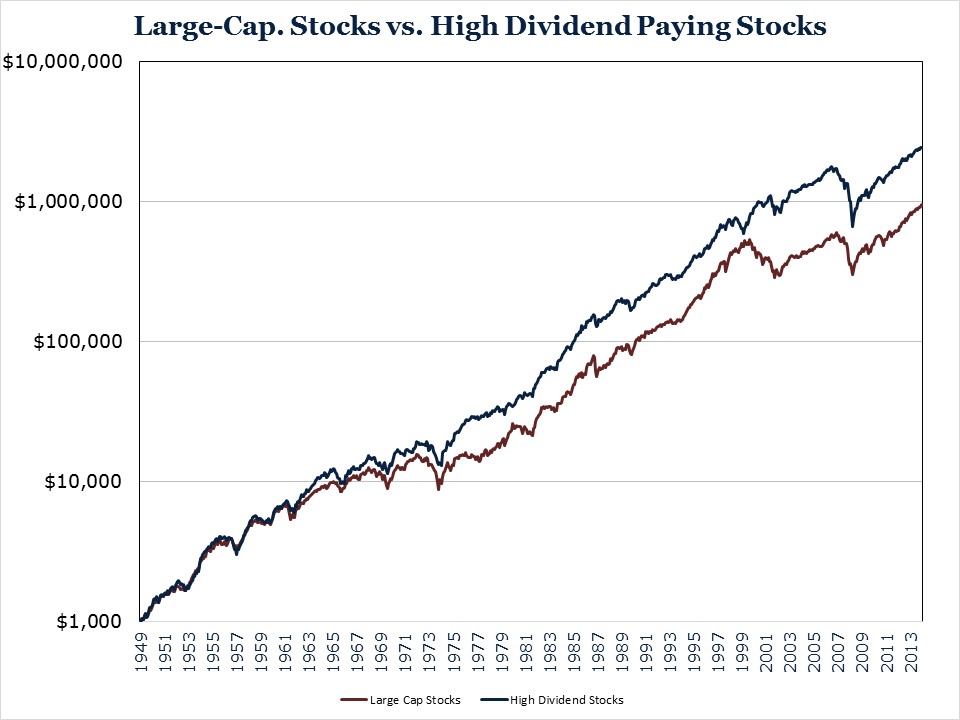
As many of you are aware, we are one of those advisors who eschew the Netflixes of the world, even if it means temporarily trailing the broader market averages. We aren’t focused on relative performance, and we advise you to take a similar view. In equity portfolios, we invest in dividend payers and focus only on those with a strong record of regular dividend increases.

Buying High Barrier to Entry Businesses

Our work doesn’t stop there, though. We also strongly favor companies and industries with high barriers to entry. It’s easy to forget that, after a couple of years of spectacular gains, many of today’s market leaders operate in some of the lowest barrier-to-entry businesses.

What’s the problem with low barrier-to-entry businesses? A recent Wall Street Journal included two notable articles that highlight the risks of investing in low barrier-to-entry businesses.

Flipboard’s Flop

The first article was titled Flipboard, Once-Hot News Reader App, Flounders Amid Competition. For those of you unfamiliar, Flipboard is an iPad app that allows users to read articles on the Web in a magazine-like format on tablets and phones. Flipboard quickly became one of the top 100 apps in Apple’s App Store. Then competition emerged. Zite, Pulse, Feedly, and Apple are all now competing with Flipboard. As are Facebook and Twitter.

Flipboard’s popularity has plunged. The app now ranks 1,030th among all iPad apps in the U.S. Its advertising revenue has fallen by half and the co-founder and chief technology officer have left the company. Flipboard is a private company so we can’t track the value of its shares, but it is probably safe to say Flipboard is worth a lot less today than it was a few years ago.

GoPro: No Barriers to Entry

The same is true of GoPro. GoPro makes wearable-cameras. A gentlemen founded the company in 2002 after a trip to Australia. He wanted to capture action photos of his surfing, but he couldn’t find quality equipment at a reasonable price. GoPro filled a need that the established players in the market hadn’t. But can you guess what happened as soon as GoPro proved there was a market for wearable cameras? Competition emerged. In its latest quarterly report, GoPro reported disappointing third-quarter results and gave weak guidance for the holiday season. The Wall Street Journal reports there are concerns the wearable-camera market is drying up, and GoPro is facing new competition from traditional camera makers like Sony and new entrants such as Chinese smartphone-maker Xiaomi Corp.

Over the last year, GoPro shares are down over 70% and the multiple that investors are willing to pay for a dollar of GoPro earnings has fallen from about 99X down to 14X.

When we evaluate the long-term prospects of a glamour stock such as Netflix, we struggle to see the sustainable barriers to entry. Up until now there has been a lack of competition in the streaming-video space. There has been some limited competition from Amazon and Hulu, but by and large Netflix has been the only game in town in video streaming. But what is true today may not be true tomorrow.

The competition is already starting to heat up. Hulu is now offering a commercial-free service, HBO now has a first-rate app, YouTube is offering a paid service with professional content, there is Sling TV, Apple is in talks to offer a TV bundle, CBS now has an app, and many other channels offer the same.

The new Apple TV could also be a game changer for the industry. Apple is now allowing developers to write their own apps for the Apple TV. That means the owners of content (the companies that now license their content to Netflix) can easily create their own app and sell their content directly to consumers on Apple TV, potentially cutting Netflix out of the equation.

Yes, Netflix now produces its own content, but as the major networks have proven over the years, producing good content consistently isn’t as easy as it sounds. And it could get even more challenging as the barriers to creating and distributing video content fall and consumer choice proliferates. Over the next 5 or 10 years, the content producers could face some of the same challenges publishers have faced over the last 10 years.

I don’t want to give you the impression we know for certain how the video-streaming industry will evolve. We don’t, but we do think it is speculative to pay over 385X earnings for a company that could face a fate similar to Flipboard, GoPro, or, maybe more appropriately, Blockbuster. High valuations and low barriers to entry just don’t make for a prudent long-term investment, in our view.

Our strategy remains focused on investing in companies that pay dividends, increase dividends regularly, and operate in industries with high barriers to entry.

One of our favorite areas of the market today is energy pipelines. In our view, the pipeline industry is the antithesis of the streaming-video industry. The barriers to entry are high. Pipelines own rights of way that are hard to duplicate, and the returns of pipelines are often regulated and protected from inflation.

We boosted pipeline exposure in many portfolios by initiating a position in three pipeline MLP exchange-traded notes (ETNs). MLP ETNs are debt obligations of issuing banks. They can be held in both taxable and tax-deferred accounts. To spread the credit risk, in many portfolios we’ve purchased multiple ETNs. The issuing banks are JP Morgan, Credit Suisse, and UBS. The yields on the three ETNs average about 7.5% today.

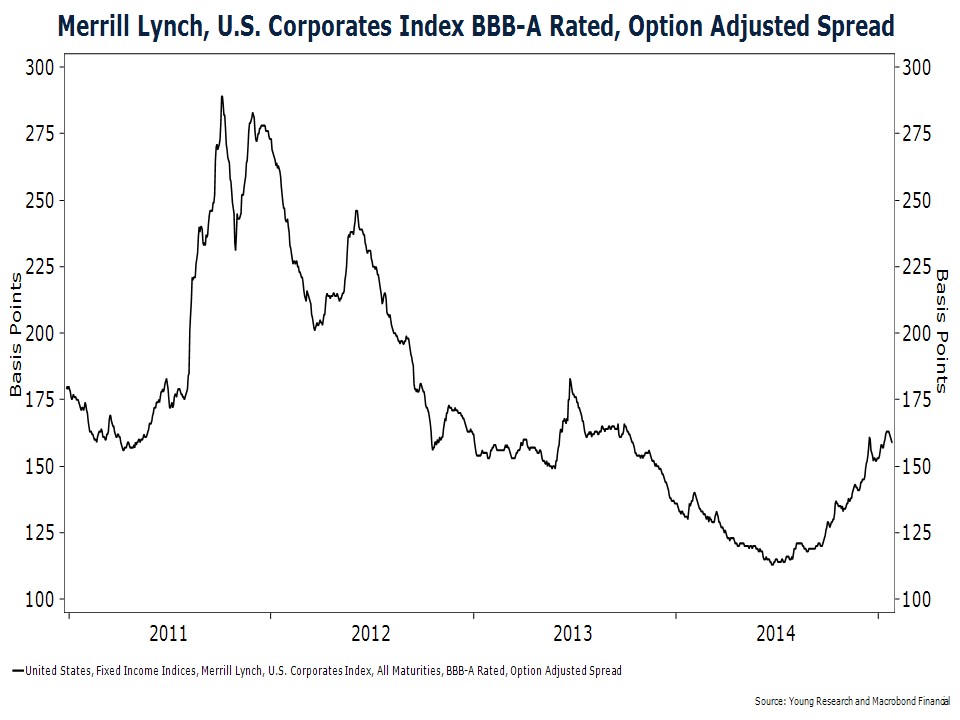
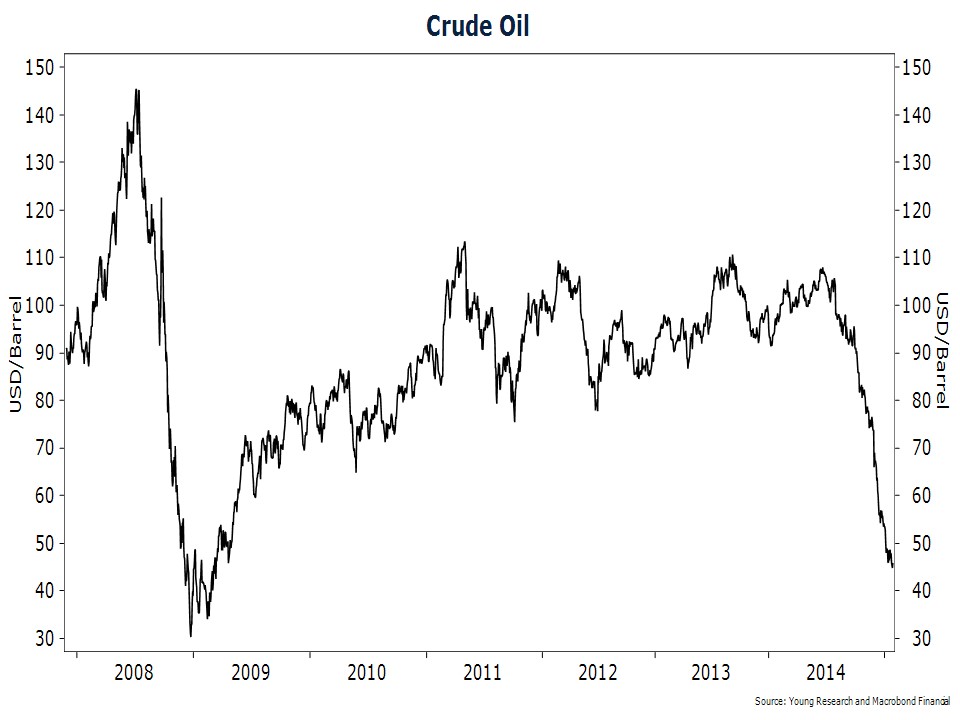
Pipeline shares have fallen in sympathy with the price of oil and gas, but pipelines are not directly impacted by falling oil prices. Most pipelines are like toll takers. They are paid based on the volume of oil, gas, and refined products transported over their pipelines. It is true that if U.S. oil production slows as a result of the fall in oil prices, growth prospects at some pipelines may be slightly dented. But when yields of 6%–8% are offered, we feel we can be patient until growth picks up again.

Have a good month and, as always, please call us at (888) 456-5444 if your financial situation has changed or if you have questions about your investment portfolio.

Sincerely,

Matthew A. Young

President and Chief Executive Officer

P.S. The Fed next meets December 16–17. Ninety-two percent of economists surveyed are expecting a rate hike. Investors are less confident in a hike. According to futures markets, investors put the probability of a rate hike in December at 69%. While we are hopeful the Fed will finally get off of zero, we would not be surprised if the Fed sits on its hands yet again.

P.P.S. Higher interest rates would be a welcome development, as far as we are concerned. Our clients’ bond portfolios have short maturities. As rates rise we will reinvest lower-yielding bonds that are maturing into higher-yielding bonds, thereby boosting portfolio income.

P.P.P.S. Higher rates could even be a stimulus to the economy. According to J.P. Morgan’s chief global strategist, the first few rate hikes could stimulate growth. One way higher rates can stimulate growth is by boosting interest income. According to J.P. Morgan, a one-percentage-point increase in interest rates would boost interest income by about $65 billion.


Dividends the Key Element to Investing

October 2015 Client Letter

In July 1989, just four months before Richard C. Young & Co., Ltd., was incorporated, my dad was interviewed by The Providence Journal Bulletin. In that article, titled “Dividends the Key Element to Investing,” my dad provided the following stock advice:

  1. The smart individual investor will tie down yield first and let capital gain come as it may.
  2. Bet on stocks that have dividend momentum.
  3. Pay no attention to companies that cut or don’t pay dividends.
  4. Ride out core positions through thick and thin.
  5. Assemble a portfolio of stocks that has a yield higher than the Dow’s yield and a growth rate in dividends that outstrips the Dow’s growth rate.

Ben Graham’s Dividend Investing Advice

My dad is quick to point out that the dividend-centric strategy is not his invention. He says his interest in dividends started back in the early 1960s at Babson College, when he was introduced to Ben Graham and his book Security Analysis (copyright 1962). In Security Analysis, Mr. Graham writes, “For the vast majority of common stocks, the dividend record and prospects have always been the most important factor controlling investment quality and value. In the majority of cases, the price of common stocks has been influenced more by the dividend rate than by reported earnings. In other words, distributed earnings have had a greater weight in determining market prices than have retained and reinvested earnings.”

Today, investors face a climate where high dividend yields are not abundant. The yield on the S&P 500 does not even break 2%. Loose Federal Reserve policies going back to the 1990s have reduced yields by propping up stock prices. To counter the effects of low yields overall, we manage equity portfolios by selecting stocks of companies with policies that favor dividend increases year after year. By example, if dividends increase 5% every year, after five years a stock with an initial yield of 2% will yield 2.6% on the initial dollar invested.

Why We Buy Consumer Staples Stocks

When searching the stock market universe for acceptable candidates for our dividend strategy, we spend a lot of time in the consumer staples space. Consumer staples companies make everyday products, including paper towels, diapers, soft drinks, deodorant, and toothpaste, to name a few. They are the antithesis of the current glamour stocks (think Tesla, Amazon, Apple, Google, etc.) that dominate newspaper headlines and financial news networks. There isn’t much room for innovation in the sale of toilet paper and toothpaste. These are boring businesses, but in investing, boring can be a winning strategy.

Consumer Staples Stocks Long-Term Winners

According to Fidelity, since 1962, the boring consumer staples sector has delivered the second-highest return among the 10 economic sectors in the U.S. stock market. Over this period, consumer staples stocks returned a compounded annual 12.9%—almost 2% per year more than both the broader market and today’s favored consumer discretionary and technology sectors. Two percent may not sound like much, but compounded over 53 years, the difference on a $10,000 investment would amount to $3.8 million dollars. Yes, million.

Why have consumer staples stocks delivered such strong returns? One reason is the strong brand value of the businesses in the sector. Many of the leading household brands from 50 years ago are still the leading brands today. The formidable brand value of a Coca-Cola, a Procter & Gamble, or a Unilever creates high barriers to entry that keep competition away and allow incumbents to generate high and sustainable returns on investment.

Consumer Staples Stocks Less Risky

The potential for solid returns isn’t the only reason we favor consumer staples companies, though. Consumer staples stocks also tend to be less volatile than the broader market, and during bear markets, have historically fallen less than the average stock. The reduced risk of consumer staples stocks likely comes from the nature of the products they sell. Even in recessions, consumers continue to brush their teeth, clean their dishes, and wipe up spills.

Consumer Staples Solid Dividend Payers

Solid and sustainable returns on investment, along with stable demand through thick and thin, allow consumer staples companies to return significant capital to shareholders in the form of dividends. In our view, many of the market’s best dividend stocks are in the consumer staples sector. Consumer staples stocks often have higher dividend yields and stronger dividend growth than stocks in other sectors. We believe high dividends today and the promise of higher dividends tomorrow are a powerful tonic for retired investors and those soon to be retired.

Long term, the opportunity for growth in the consumer staples sector is in foreign markets. The U.S. is a mature market for consumer staples businesses, but the U.S. represents only about 5% of the world’s population. In emerging markets, where 85% of the world’s population resides, staples companies are generating robust growth. As incomes in emerging markets rise, so too will demand for consumer staples.

Investing in Healthcare Stocks

The opportunity for businesses in foreign markets isn’t limited to consumer staples companies. Foreign markets also offer profound promise for health-care companies.

Consider the two secular trends likely to drive health-care spending for decades to come: aging and population growth. Take a look at our first bar chart below and you’ll see the 25 countries with the highest per-capita health-care spending (2013). It’s no surprise to see Norway, Switzerland, the U.S., Luxembourg, and Denmark listed in the top five. The rest of the list (excluding a few small tax-haven countries) is filled out by various European countries, Canada, Israel, Japan, Australia, Qatar, and New Zealand. These wealthy nations seem willing to spend whatever it takes, either privately or publicly, to protect the health of their citizens.

These countries are likely to demand more prescription drugs, more medical devices, and more consumer-branded medical products in the coming years. The world’s population is aging, and with aging comes a greater demand for medical treatment. According to the UN, “The global share of older people (aged 60 years or over) increased from 9.2 per cent in 1990 to 11.7 per cent in 2013 and will continue to grow as a proportion of the world population, reaching 21.1 per cent by 2050. Globally, the number of older persons is expected to more than double from 841 million people in 2013 to more than 2 billion in 2050.”

Deloitte LLP says that population aging will

Create additional demand for health care services in 2015 and beyond, primarily in Western Europe and Japan, but also in countries including Argentina, Thailand, and China, where it will combine with a sharp decline in the number of young people. Life expectancy is projected to increase from an estimated 72.7 years in 2013 to 73.7 years by 2018, bringing the number of people over age 65 to around 580 million worldwide, or more than 10 percent of the total global population. In Western Europe and Japan the proportion will be higher, at 20 percent and 28 percent, respectively.

On our second chart, you’ll find the opposite end of the spectrum, a list of the fastest-growing countries by population (2014). These are mostly countries in Africa, with a few from the Middle East, as well as a lone Caribbean country. Africa is much more peaceful than it used to be, with only a regional war here and there. (If that language doesn’t reassure you, consider that it could also be used to describe Europe today.)

Fifteen of these economies have grown over 100% on a per-capita GDP basis in the 10 years ending in 2013. That’s through a housing crisis in the U.S. as well as a global financial crisis. During that time, many of these countries were at war, some with the U.S., and one didn’t even exist in 2003. A 2011 report from the World Health Organization showed that “Income (per capita GDP) has been identified as a very important factor for explaining differences across countries in the level and growth of total health care expenditures.” Despite war and hardship, emerging markets are growing and will most likely demand better services in the future.

As emerging markets grow, and developed markets age, demand for health-care products and services is likely to rise. We believe that American pharmaceutical, medical device and consumer health-care companies will be beneficiaries of that growth. We gain exposure to the healthcare industry by purchasing the Vanguard Health Care ETF (VHT) and the Fidelity MSCI Health Care Index ETF (FHLC) for clients.

Energy Transportation

Pipelines are another sector where we find the types of businesses that have the capacity to pay a growing stream of dividends. Like many consumer staples businesses, the pipeline business is a simple and boring business. You lay pipe, move oil and gas through it, and charge a volume-based fee that increases with the rate of inflation. What’s not to like?

Apparently a lot, if the Alerian MLP Infrastructure Index is any indication. The index has fallen 35% from its high in 2014. It fell especially sharply toward the end of September in what was reminiscent of the forced deleveraging of MLP pipeline shares during the financial crisis.

Investors in the pipeline MLP sector tend to paint with a broad brush. When oil and gas prices are down and oil and gas producers fall, pipeline businesses tend to get sold in sympathy. But while some MLPs are exposed to oil and gas prices, many are not. Companies that transport gasoline or jet fuel from refineries to end markets aren’t negatively impacted by falling oil prices, by example. In fact, lower oil prices are a boon to firms that transport gasoline as lower prices tend to boost demand.

We view the sell-off in pipeline MLPs as a short-term dislocation that, if anything, creates opportunity for serious long-term investors. Pipelines remain a vital part of the U.S. energy infrastructure, and we are confident they will remain so for decades into the future.

The pipeline and consumer staples sectors both tend to be higher-dividend-paying sectors. Most often, dividend-paying companies are stronger and more durable businesses than non-payers. Payers often have higher barriers to entry and stronger balance sheets than non-payers. And because there is a stigma associated with cutting dividend payments, the consistent payment of dividends is a signal of management confidence in the future prospects of a company. This is especially true of companies that raise dividends. Management teams rarely commit to higher dividend payments unless they are confident that the dividend can be maintained through thick and thin.

Have a good month and, as always, please call us at (888) 456-5444 if your financial situation has changed or if you have questions about your investment portfolio.

Sincerely,

Matthew A. Young

President and Chief Executive Officer

P.S.  Judy Shelton recently explained how the Fed’s interest rate policy has promoted Wall Street’s interests at the expense of the ordinary investor in the article “Why Aren’t GOP Candidates Blaming the Fed?” published on the CNBC website October 22, 2015.

We have seen that the Fed’s decision to keep interest rates at zero these past seven years has not accelerated economic growth. Instead of financing capital investment to expand production, companies used the cheap money to buy back their own shares and pursue mergers and acquisitions at a blistering pace. Great for boosting stock prices and enriching investors, but hardly productive when it mostly amounts to window dressing and dubious synergy claims.

Guess who has been subsidizing Wall Street’s deal making? Thanks to the Fed’s repression of interest rates, people with ordinary savings accounts are forced to contend with pitiful returns from their own efforts to be financially responsible. At the end of 2006, the average yield on a one-year CD was 3.8 percent, according to Bankrate.com; currently, the average yield for a one-year CD is 0.28 percent.

P.P.S. In a September 29 interview with Forbes, Charles Koch had this to say:

My view of the political realm, not just now but for many decades, is that the Democrats are taking us down the road to serfdom over the cliff at 100 miles an hour and the Republicans are going around 70 miles an hour….

There are a lot of topics we could talk about but two really big ones. One is we have out of control spending, irresponsible spending by both parties that are taking us toward bankruptcy as a country and as a government. Related to that is we’re headed toward a two-tiered society. We’re destroying opportunities for the disadvantaged and creating welfare for the rich. This is coming about by misguided policies creating a permanent underclass, it’s crippling the economy and corrupting the business community.


Up 230%

September 2015 Client Letter

From its March 2009 low, the S&P 500 is up 230%, including dividends. That is an impressive return and has been cited regularly by pundits and promoters as a reason to buy more stocks. But it is important to remember that few investors earned 230%.

To these investors, the 230% gain in the S&P 500 during this bull market is irrelevant. A more meaningful return is one that assumes investment before the financial crisis. Consider the returns an investor in the S&P 500 would have earned had he bought at year-end 2006 instead of the March 2009 low. From year-end 2006 through August 2015, the S&P 500 delivered an average annual return of 6.1%—not bad, but not nearly as impressive as the 19% annual return from the March 2009 low.

In fact, the 6.1% return on the S&P 500 is only about 0.50% more than the return of the much less volatile Vanguard Intermediate-Term Investment-Grade bond fund over the same time period.

What if an investor started investing prior to 2006? Surely the stock market would have delivered returns that are closer to the current bull market returns, right? Not exactly. From year-end 1998 through August 2015, the S&P 500 compounded investors’ money at a rate of 4.8%. Compare that to the 5.6% annual return of the Vanguard Intermediate-Term Investment-Grade fund.

Markets go through cycles. It is important not to base an investment strategy on returns earned during only one part of a cycle.

Correction or Crash

As I wrote last month, prior to August it had been almost four years since the stock market last experienced a 10% correction. Historically, stock market corrections are quite common. So the recent market correction wasn’t so out of the ordinary. What was out of the ordinary, and what caught many investors off guard, was the suddenness of the correction and the speed of the uninterrupted decline. To many, it felt more like a crash than a correction.

Over the last 70 years, there have only been seven other occasions when stocks fell by as much as they did—and as fast as they did—in August.

New Stock Market Structure and Correction

Why was the correction so fast? We would place the black hat on the new and “improved” stock market structure (sort of like the “new” Coke). The players who dominate stock trading today are not the same players who dominated markets even 10 years ago.

High frequency traders (HFTs) now account for over half of the stock market volume, while exchange-traded funds (ETFs) play a more prominent role in financial markets, and hedge funds—many of them leveraged—are also a bigger part of the investment landscape than in decades past.

Do High Frequency Traders Make Market Declines Worse?

HFTs have the potential to exacerbate market declines. Today, HFTs represent a large part of the market and are under no obligation to provide bid and offer quotes in periods of market stress, as NYSE specialists once were. HFT traders claim to increase liquidity, but the evidence suggests otherwise.

Blue-Chips Down 20%

On August 24, the worst day of the sell-off, the Dow opened down over 1,000 points, with some of the largest listed stocks in the U.S., including GE and Pepsi, opening down 20%. ETFs traded at discounts of as much as 30% to the value of their underlying holdings. That’s not supposed to happen in a liquid market. Where was the liquidity the HFTs are so quick to boast about when it was needed most?

ETFs Increase Volatility

ETFs are a net benefit to the investor class. But they don’t offer the same buffer to stock prices that traditional open-end mutual funds do. When an order is placed to sell a traditional mutual fund in the morning, a portfolio manager has the entire day to come up with ways to meet the redemption. Selling shares, dipping into cash, or borrowing temporarily are all available options. When an ETF sell order is placed, the trade is executed immediately. If many investors put in similar orders at the same time, the aggregate order volume can have an impact on the underlying stocks in the ETF.

As the price action on August 24 proved, ETFs can trade at a substantial discount to their Net Asset Value (NAV). The issue is that while most days ETFs trade within a fraction of a percentage point of the value of their underlying holdings, nothing guarantees this relationship.

Last but not least, hedge funds tend to be fast money traders and can use astounding amounts of leverage. In times of market stress, if just a couple of the big boys are caught leaning the wrong way, massive margin calls can drive the whole market down in a flash as trading activity reaches a frenzy.

Unfortunately for serious long-term investors, the new and improved stock market structure is here to stay. Sharp jarring corrections and powerful relief rallies are now likely a permanent part of the equity market landscape. This creates risks as well as opportunities.

We think the new market structure goes a long way toward explaining the speed of the recent correction, but it doesn’t explain why stocks corrected in the first place. The financial press puts the blame on emerging markets, the Fed, or the Chinese stock market correction.

In our view, while any one of these factors may have been the catalyst for the correction, it wasn’t the root cause. The root cause of the correction was from a U.S. stock market way out in front of its skis. As our chart shows, prior to the correction the price-to-sales ratio of the S&P 500 was at dotcom-bubble-era levels. When stock valuations enter bubble territory, it often isn’t a matter of if, but a matter of when they will correct.

Even after the 10% correction in the S&P 500, stocks are still not priced to deliver the types of long-term returns many have come to expect from equities. That doesn’t mean another correction is imminent, but we would argue that it does increase downside risk.

As we see it, the good news is that despite the U.S. economy being in the winter stages of the cycle, growth still looks OK. The housing sector, which has been the last to recover, is showing continued signs of strength. Sales activity is at an eight-year high, as seen in our chart on existing home sales.

Home-builder sentiment is also surging. Home builders are the most positive on their industry in years and the outlook for sales over the next six months is at its highest level in almost a decade.

The U.S. job market is also in good shape. Weekly jobless claims are printing at some of the lowest levels on record, payroll employment continues to increase at a steady pace, and consumer sentiment toward the job market is on the rise. The percentage of Americans who say jobs are plentiful is at levels consistent with economic expansion.

What could take the wind out of the sails of the U.S. economy and the stock market?

China Risk

One factor being closely watched is China. If China’s stock market correction and currency devaluation do in fact lead to a deeper slowdown in the emerging economies, additional losses in U.S. stocks may come sooner rather than later. While the Chinese stock market doesn’t provide a reliable guide to what is going on inside of the Chinese economy, a host of other indicators point toward slowing global growth. Emerging market stocks outside of China are selling off, oil is in the tank, industrial metals are falling, lumber is trending down, and the CRB index of raw industrials prices has fallen in 13 out of the last 15 months.

The emerging markets have been the growth engine of the global economy. If many of the world’s emerging economies enter recession, it could bring stock prices in developed markets down further. During the 1997–1998 emerging markets crisis, emerging economies accounted for 20% of global output. Today they account for almost half of output and an even larger share of the growth. During 1998, the S&P 500 fell nearly 20% as emerging economies imploded. From its peak in May to its trough in August, the S&P 500 fell about 12%. At their current level, stocks are only 7% off their high.

Recessions in the emerging economies by themselves probably can’t push the U.S. economy into a recession, but it is important to remember that the U.S. economy is not the U.S. stock market. Exports account for a manageable 13% of GDP, but foreign sales account for 33% of total S&P 500 revenues. A crash in global growth would hurt U.S. multinational firms much more than the broader U.S. economy.

Federal Reserve Update

After high expectations for the first interest rate hike in almost a decade at its September policy meeting, the Federal Reserve was apparently spooked into delay by recent financial market volatility. The Fed has long argued that its policies are data dependent, but their recent actions argue otherwise. In recent years, we believe the Fed has been overly focused on the stock market. Some might say they’ve been obsessed.

Yellen & Co. are still saying that they expect to increase rates before year-end, but we’ve heard this song before. The Fed seems to be waiting for some optimal set of conditions that never arrive. What those conditions are, the public has not been told.

What is our outlook for a Fed rate hike? We’ll believe it only when we see it.

Have a good month. As always, please call us at (888) 456-5444 if your financial situation has changed or if you have questions about your investment portfolio.

Best Regards,

Matthew A. Young
President and Chief Executive Officer

P.S. “The Fed has talked and talked about the need to move away from its zero interest rate policy for months before the Asian angst. Chair Janet Yellen seemed fairly certain just two months ago that the Fed would be raising rates this year if the economic forecast unfolded as planned. The key takeaway from last Thursday (the Fed’s 9/17/15 meeting) is that the seemingly perfect or near-perfect conditions the Fed seems to be waiting for are hardly likely to emerge anytime soon. The goalposts keep shifting, and I believe that even when the overseas markets and economies turn around, the Fed, with all its flexibility and power, will simply switch its focus to something else to justify staying on the sidelines.” Financial Post, David Rosenberg, 9/22/15

P.P.S. An issue of growing concern for all investors is cyber fraud. Cyber fraud continues to grow and evolve. While we take precautions on our end to protect your personal information, we encourage you to be proactive in this area to mitigate the potential risks. Some steps you can take include: managing your electronic devices, protecting all passwords, surf the Web safely, protect information on social networks, protect your email accounts, safeguard your financial accounts and notify us if you change your address. Also, please notify us immediately if you suspect that your email account or Fidelity account has been compromised. If it is after business hours, you can call 1-800-FIDELITY and ask for the Customer Protection Team.

P.P.P.S.  I am pleased to announce that Barron’s has ranked Richard C. Young & Co., Ltd.  as one of the top independent advisors in the nation for 2015, the fourth consecutive year.  Please see the enclosed flyer to read an excerpt from Barron’s “Taking a Winning Tack”.


Market Corrections are Normal

August 2015 Client Letter

In August, a five-day financial markets rout saw the Dow Jones Industrial Average, the S&P 500, and the Nasdaq each decline over 10%, serving as a reminder that markets do indeed go down. The negative backdrop to the five-day mini-crash was evidently initiated by worries over China’s slowing economy, currency devaluation, and a drop-off in commodity prices.

On the heels of this volatility, it is important to remember that market corrections are normal. Investors have enjoyed a relatively long period with minimal volatility. It’s been almost four years since the S&P 500 experienced a 10% correction. Generally speaking, though, long stretches without market declines are not normal. On average, investors can expect three 5% corrections per year, one 10% correction per year, and one bear market (20% or greater decline) every three years. The last four-year period has been far from average.

However, while some volatility is normal, it was still somewhat jarring to witness how quickly the market took on losses. Fortunately, most clients of Richard C. Young & Co., Ltd. own portfolios containing a balance of different asset classes. Over longer periods of time, a balanced portfolio is usually a good idea. It’s not that balanced portfolios offer the highest returns—historically, an all-stock portfolio would have higher returns over long time periods. Rather, balanced portfolios tend to work well because investors find it easier to ride out corrections with a mix of asset classes. A diversified portfolio can help avoid regrets when part of the financial markets take a plunge. By example, the chart below illustrates how stocks, bonds, and gold performed during the recent correction.

Jack Bogle, the founder of the Vanguard Group, who has about as much experience as anyone in helping individual investors ride out volatility, had this to say to The Wall Street Journal in December 2007:

I think a very important lesson is: Don’t let your emotions drive your investment program, because you will be thinking of getting in and out. For investors the best rule by and large is to ignore the daily moves of the stock market. The stock market is a giant distraction for the business of investing. Buy and hold a very diversified portfolio, U.S. and global….Another important lesson: Always hold some bonds.

The markets’ August sell-off was likely fueled by the Federal Reserve’s quantitative easing, which resulted in an abnormally low interest rate environment. As the Fed purchased large amounts of long-term bonds and promised to hold short-term rates near zero, investors eschewed bond purchases and instead hopped on the equity bandwagon.

As my dad recently wrote in regards to the Fed:

The Fed, through the long business recovery that commenced in 2009, has mistakenly sat on its hands—an action thoroughly without precedent. Based on the clear lessons of history, we should have seen a stair-step pattern of interest rate increases years ago. Rather than allowing Wall Street to reap what it sowed, the government—along with its privately owned (yup) cousin at the Fed—determined it would let retirees, hunkered down in their retirement condos in Boca, pick up the tab for Wall Street’s recovery. This was achieved by holding short-term interest rates at near zero, allowing Wall Street to speculate and recover for years at next to nothing.

When the current economic cycle turns, there may be a more limited scope for a policy response than in past cycles. Government debt relative to the economy is greater than in the past, the Fed has a $4-trillion balance sheet (as opposed to under $1 trillion before the financial crisis), and interest rates are already pegged near zero. If the economy unravels, the stock market could experience a significant correction. We would expect the NASDAQ-oriented universe to get hit the hardest in such a scenario. The strategy we advise in light of such a risk is to favor higher-quality companies offering a more predictable cash flow and a strong likelihood of being able to ride through a down cycle.

With our common stock investment strategy, we craft portfolios generating a steady stream of dividends. We have long favored stocks with above-average dividend yields, a history of paying dividends, and a history of annual dividend increases. More recently, we have started putting less emphasis on initial yield and greater emphasis on companies that have increased their dividend for at least 10 consecutive years.

With the Federal Reserve pinning interest at zero for an unprecedented six years into an economic recovery, we are seeing yield-reaching galore in some sectors we have long favored. Dividend yields are now lower, and valuation risk is higher.

Electric Utilities and the Reach for Yield

One sector we believe has been impacted by the reach for yield is the electric utilities industry. For years, electric utilities have been a foundational holding in our stock portfolios. Today, yields are low, and dividend growth rates have been pared down. Volatility has also picked up as investors rush in and out of the sector at every hint of a change in interest rates. Long term, the industry may also face headwinds from solar. Large customers could start generating some portion of their own electricity from solar or pulling off the grid entirely. As a result, a much smaller percentage of the utilities industry now qualifies for consideration in our portfolios. We don’t feel it is urgent to make a wholesale exit from our electric utility holdings, but we are using certain positions as a source of funds to buy companies with a 10-year record of dividend increases.

Two recent additions we’ve made to portfolios that have increased their dividends for at least 10 consecutive years are Harris Corp. and Target.

Harris Corp. is an international communications equipment company. Standard & Poor’s classifies Harris in the information technology industry—the same sector as the likes of Facebook, Twitter, Yahoo!, and Apple. But Harris isn’t your typical flash-in-the pan technology company like those we have long avoided.

In the 1890s, Alfred and Charles Harris owned a jewelry store in Niles, Ohio, where they would tinker with new technologies in their free time. Their first major success was the invention of a sheet-feeding system that fed paper into printing presses automatically. The system’s capabilities were so advanced that the brothers understated them in order to seem more believable to potential customers.

Like many turn-of-the-century industrial technology companies, Harris Corp. would eventually begin to broaden its horizons. One of its pivotal acquisitions was Radiation Inc., which in 1967 brought Harris Corp. into the business of manufacturing equipment for the fledgling space industry and the military.

Today, Harris is a leading communications firm serving the military, the government, and major corporations.

There are six “core franchises” at Harris Corp. These are businesses that get the most attention and the most revenue. They include space and intelligence, air traffic management, weather, electronic warfare and avionics, tactical communications, and geospatial systems. Harris is building the critical advanced technology running the government’s most important systems.

Harris Corp. has increased its dividend for 13 consecutive years. Over the last 10 years, the dividend has increased at a compounded annual rate of 23%.

Like Harris, Target has a long and successful history. Target began when George Draper Dayton purchased land in Minneapolis on Nicollet Avenue in 1881. There he formed the Dayton Dry Goods Company, which would eventually become Target. Dayton was a philanthropist and business pioneer who wowed America with his determination and creativity. In 1920, he used two Curtiss Northwest Airplane Company planes to haul goods from New York to Minneapolis after railroad strikes shut down overland transport. At the time, the trips were the longest commercial flights ever.

Today, Target operates 1,934 stores in the U.S. and Canada and employs 366,000 people. Target is ranked 22nd on Fortune’s list of the world’s most admired companies. In 2013, Target produced revenues of $72.6 billion, of which 25% represented household essentials, 21% food and pet supplies, 19% apparel and accessories, 18% hardlines (things like hardware, automotive parts and accessories, sporting goods, electronics, toys, etc.), and 17% home furnishings and decor. Target has paid dividends every year since 1965.

Target is operating with an eye toward the future. Currently, the grocery business at Target generates only 20% of its sales. Target hopes to attract more repeat customers by bulking up its grocery offerings. By adding just one more visit per customer each month, Target will generate an additional $2.5 billion in sales each year.

Target has increased its annual dividend for 43 consecutive years. The company’s 10-year dividend growth rate is 20%. Today, Target shares offer an above-average yield of 2.8%.

By crafting a portfolio of dividend increasers such as Harris and Target, we believe there is less need to be concerned with interim portfolio values and stock prices. Instead of focusing on minute-by-minute, day-by-day, or quarter-by-quarter performance, think of yourself as a collector of dividends. As long as you have received more dividends this year than last, you can consider yourself to be winning the war.

Have a good month and, as always, please call us at (888) 456-5444 if your financial situation has changed or if you have questions about your investment portfolio.

Sincerely,

Matthew A. Young
President and Chief Executive Officer

P.S. From John Tamny, “The Housing Lesson within the Ugly Plunge in Apple Shares,” Forbes, August 9, 2015:

Back in the late 1990s, and amid a rather glorious bull market, Goldman Sachs partner David Henle preached calm to clients and employees alike. To paraphrase Henle ever so slightly, “View your equity holdings in the same way you do your house. You don’t check your house’s value on a daily basis, nor should you regularly check the value of your equities. Since you’ll own both for the long-term, near-term volatility shouldn’t concern you.”

P.P.S. From Stephen Roach, “Market Manipulation Goes Global,” Project Syndicate, July 27, 2015:

Market manipulation has become standard operating procedure in policy circles around the world. All eyes are now on China’s attempts to cope with the collapse of a major equity bubble. But the efforts of Chinese authorities are hardly unique. The leading economies of the West are doing pretty much the same thing—just dressing up their manipulation in different clothes.

Take quantitative easing, first used in Japan in the early 2000s, then in the United States after 2008, then in Japan again beginning in 2013, and now in Europe. In all of these cases, QE essentially has been an aggressive effort to manipulate asset prices. It works primarily through direct central-bank purchases of long-dated sovereign securities, thereby reducing long-term interest rates, which, in turn, makes equities more attractive.

Whether the QE strain of market manipulation has accomplished its objective—to provide stimulus to crisis-torn, asset-dependent economies—is debatable: Current recoveries in the developed world, after all, have been unusually anemic. But that has not stopped the authorities from trying.

P.P.P.S. From Jeff Sommer, “The High Cost of Investing Like a Daredevil,” The New York Times, June 6, 2015:

“When investors think short-term and try to time the market, they haven’t done very well,” Louis S. Harvey, the president of Dalbar, a Boston research firm, said in an interview. “They have been leaving a lot of money on the table.”

. . . By buying and selling too frequently and at the wrong times and not benefiting fully from compounding, people typically do even worse than they would have done if they simply held on to their investments—even if those investments were in mutual funds that themselves trailed the market, Dalbar found. In short, investors have been penalized multiple times—for buying funds that underperform, for selling those funds at the wrong times and, often, by generating unnecessary costs by trading relatively frequently.”


Federal Reserve Inflates Stock Prices

May 2015 Client Letter

William McChesney Martin, the longest-serving chairman of the Federal Reserve, once said it is the Fed’s job to “take away the punch bowl just as the party gets going.”

Despite such sage advice, few have accused the Fed of being ahead of the curve when it comes to the removal of party refreshments in the modern era. In cycle after cycle, many argue, the Fed has been slow to recognize when the economy is running too hot and when it is cooling. “Better late than never” is perhaps a more fitting slogan for today’s central bank.

It would also appear to be a fitting description of the Fed’s asset-bubble radar. You may recall it was former Fed chairman Ben Bernanke who told the public in October of 2005, only months prior to the national housing bust, that soaring home prices reflected strong economic fundamentals. There was no mention of an easy-money-fueled housing bubble from Dr. B.

Bernanke’s successor at least seems to have recognized before the next bust has started that something isn’t quite right in asset markets. At a recent IMF meeting, Fed chair Janet Yellen commented, “I would highlight that equity-market valuations at this point generally are quite high. Now, they’re not so high when you compare the returns on equities to the returns on safe assets like bonds, which are also very low, but there are potential dangers there.”

At Richard C. Young & Co., Ltd., we have argued that years of 0% interest rates and trillions of dollars in bond buying by the Fed and other global central banks have promoted bubble conditions in the stock market. Our chart on the price-to-sales ratio shows the S&P 500 is trading at one of its most expensive levels in history. The permanently bullish pundits and promoters argue that there is no need to worry because stocks aren’t as expensive as they were during the dot-com bubble. And indeed this is true, but should the largest stock bubble in U.S. history be the standard by which all stock-market valuations are judged? You wouldn’t call a 350-pound man thin just because a 500-pound man stands next to him. They are both overweight.

Whether you want to label today’s market a bubble or something else isn’t important. What matters is that when valuations are as high as they are today, future returns often disappoint. The chart below shows the average 10-year compounded annual return on the S&P 500 starting in different price-earnings ranges (cyclically adjusted P/E). When the starting P/E of the S&P 500 is higher than 25X, stocks have returned an annual average of only 3.4% over the following 10 years. Today, stocks are trading at a P/E of 27X.

Ms. Yellen and her defenders would admit that P/E ratios are high, but would argue that they are not so high when compared to the low level of interest rates. If stock values depend on the level of interest rates, this would imply that an increase in interest rates might be a problem for “quite high” equity valuations.

Rising interest rates? Isn’t that a quaint idea? It is true that the Federal Reserve hasn’t raised rates in almost a decade, but I would advise against taking solace in the historically low level of interest rates and in Ms. Yellen’s comments that stocks are not so high when compared to bonds. For I assure you that despite the evidence of recent years, bond yields can in fact rise, and rise quickly.

Short-term bond yields are controlled by the Federal Reserve, but the market has a say in the level of long-term interest rates (admittedly a diminishing say after quantitative easing). Over the course of the last four months, yields on the long bond have increased .85 percentage points.

Is the uptick in yields the start of a trend? That would be a welcome development for income investors. After seven lean years in the bond market, savers and retired investors are starved for income.

Short-term interest rates are going to depend on the Fed, and the Fed isn’t going to hike rates unless economic momentum rebounds from the soft first quarter, inflation heads higher, and the labor market continues to improve.

Long-term rates also depend on the Fed, but to a lesser extent. Even if the Fed decides to hold interest rates at zero for the rest of the year, long-term bond yields could still move up a meaningful amount—we estimate that another percentage point isn’t outside of the realm of possibility. The risk of rising long-term interest rates is one of the reasons we continue to favor a short-maturity bond portfolio.

Patient Investing

At Richard C. Young & Co., Ltd., patience has long been at the core of our investment philosophy. We write and talk about patience often. Like many things in investing, patience is a simple idea, but not easy for many to implement.

Far too many investors steer their investment portfolios using a rearview-mirror approach. They lose focus on their individual investment goals and objectives and instead compare their portfolio to one or more market indices (inevitably the one that has performed best recently) and the portfolios of their friends and family. They bounce from one strategy to another based on how that strategy has performed over the last quarter, year, or even five years.

It is no wonder, then, that study after study from Morningstar, Vanguard, and Dalbar, among others, show that individual investor returns fall far short of the average mutual fund return or the market return. The latest numbers from Dalbar show that for the 30-year period ending in December of 2014, the average mutual fund investor earned one-third of the return of the S&P 500—3.8% versus 11%—a truly dismal return.

Five years may seem like a long enough period to evaluate an investment strategy, but it is not. We believe investment strategies must be evaluated over a full market cycle. What is a full market cycle? It runs from bull-market peak to bull-market peak or from bear-market trough to bear-market trough. Comparing investment strategies with varying degrees of risk over anything other than a full market cycle can lead to erroneous results and portfolio-decimating decisions.

Take, by example, the five-year period ending in December of 1999. The NASDAQ Composite index, which we will use as a proxy for an aggressive investment strategy, delivered a compounded annual return of 40%. The Mergent Dividend Achievers index, which we will use as a proxy for a conservative investment strategy, rose at a 25.7% annual rate.

Based on the five-year performance numbers of the two indices, the NASDAQ looked like a superior strategy. Many investors believed as much and dumped money into NASDAQ stocks. But these investors made a crucial mistake. They failed to evaluate the performance of each strategy over a complete market cycle. In bull markets, it is often the most aggressive strategies that perform best, and in bear markets, it is the most conservative strategies that outperform.

It was no surprise, then, that over the subsequent five years, NASDAQ stocks cratered, trailing the conservative Mergent Dividend Achievers index by 15 percentage points per year. Those patient investors who remained committed to their own goals and objectives even when NASDAQ stocks were performing far better than their own portfolio ultimately achieved investment success. For the entire 10-year period from year-end 1994 to year-end 2004, the Mergent Dividend Achievers index delivered a greater return than the NASDAQ index and with much less risk.

Today, I see investors making mistakes similar to those made during the dot-com bubble. The more speculative areas of the stock market have performed best recently. Over the last three years, the NASDAQ has outperformed the conservative Mergent Dividend Achievers index by about eight percentage points per year. And once again, many investors are shifting assets from conservative strategies to aggressive strategies.

Dividend Investing: A Winning Strategy

What is Richard C. Young & Co., Ltd. doing? Instead of abandoning our conservative dividend-focused strategy because it may be lagging some index or another, we are staying the course. Why? At least two reasons. First, investing in high-dividend-yielding stocks has historically been a winning investment strategy. The chart below compares the growth of $100 invested in the highest-yielding 20% of the market (rebalanced annually) to the performance of large-capitalization stocks. From year-end 1949 to year-end 2014, the dividend strategy turned $1,000 into more than $1.5 million while large-capitalization stocks turned $1,000 into $944,000.

Second, periods of lagging performance are a necessary evil in achieving exceptional long-term performance. A high-yielding strategy trails the major averages about 40% of the time. Over the last decade, high-yielding stocks have trailed the market 60% of the time. We don’t worry about these periods and advise the same for you.

The paradox is that if high-yielding stocks always outperformed, they would cease to outperform. It is the times when they fall out of favor and investors lose patience with the strategy that enable the impressive long-term performance.

Have a good month, and as always, please call us at (888) 456-5444 if your financial situation has changed of if you have questions about your investment portfolio.

Best regards,

Matthew A. Young

President and Chief Executive Officer

P.S. The April housing starts number was a surprise and a bit of an eye-opener. Previous housing starts and permits numbers had been disappointing and highlighted slowness in the new-home market. Housing starts in America totaled 1.135 million for the month of April. That’s higher than the projected analyst consensus of 1.025 million. Now the question is, with the housing industry starting to pick up the pace, will the Federal Reserve be willing or able to raise rates without ending the party? On the one hand, the Fed must raise rates someday or risk not having any ability to fight future recessions by lowering rates. On the other hand, if the Fed raises rates, housing could respond by ending the rally. The balancing act continues.

P.P.S. We recently updated both Part 2A and Part 2B of our Form ADV as part of our annual filing with the SEC. This document provides information about the qualifications and business practices of Richard C. Young & Co., Ltd. If you would like a free copy of the updated document, please contact us at (401) 849-2137 or cstack@younginvestments.com. There have been no material changes since the document was last updated on March 24, 2014.

P.P.P.S. There are several reasons why we favor Switzerland as an investment destination. As my dad recently outlined, there are many reasons why the Swiss have such a competitive economy:

Almost every index of national freedom puts Switzerland at or near the top, with my favored Economic Freedom of the World from Cato Institute ranking Switzerland fourth out of 152 countries. Switzerland scored particularly well for its sound money, low regulation, and strong legal system and property rights. Switzerland also has a low effective corporate tax of only 17.92% (with some local statutory rates as low as 11.48%). When compared to major competitors Germany, the U.K., France and Italy, Switzerland has the lowest corporate rate, lowest individual income tax rate, and the lowest employer contribution to social security. That makes Switzerland a prime location for multinational corporations looking for a low tax place to headquarter. It has also helped Switzerland’s domestic corporations grow to compete internationally.


Frugality and Patience, the Millionaire-Next-Door’s Secret

March 2015 Client Letter

This past June, at the age of 92, longtime Brattleboro, Vermont, resident Ronald Read passed away. Friends of Ronald knew him as a hard worker who lived modestly. He worked as a maintenance worker and janitor at a JCPenney store after years pumping gas at a service station partially owned by his brother. Mr. Read would often go to great lengths to cut costs by parking his car far from his final destination in order to avoid the parking meter.

But what shocked Mr. Read’s friends was when they learned his estate was valued at almost $8 million. When Mr. Read died, he left behind a large stack of stock certificates in a safety deposit box. The shares comprise the majority of his estate.

According to Anna Prior, reporting for The Wall Street Journal, “Besides being a good stock picker, he displayed remarkable frugality and patience—which gave him many years of compounded growth. Mr. Read owned at least 95 stocks at the time of his death, many of which he had held for years, if not decades. They were spread across a variety of sectors, including railroads, utility companies, banks, health care, telecom and consumer products. He avoided technology stocks. Mr. Read typically bought shares of companies he was familiar with and those that paid out hefty dividends. When dividend checks came in the mail, he plowed the money back into more shares.”

Investing Benefits of Patience and Compounding

Mr. Read’s strategy is not unlike the one we execute for clients. We favor many of the sectors included in his portfolio, which tend to be the higher-dividend-paying sectors. Perhaps more importantly, we favor the investing benefits that can come from being patient and allowing the compounding process to take hold. Patience gives you time. And time can accelerate rewards. The keys to compounding is having something to compound (dividends) and giving those dividends time to grow. The annual compounding of dividends is, as Einstein is said to have noted, the greatest mathematical discovery of all time.

The table below shows two hypothetical scenarios. In the first example, an initial $100,000 is invested for 30 years using an annual fixed rate of return of 6%. The second example, also using an annual fixed rate of return of 6%, shows regular investments of $5,000 at the start of each year during the 30-year period. As can be seen, the longer the compounding process is allowed to work, the greater the value of the portfolio.

Dividends a Vital Component of Long-Term Returns

Over time, dividends are a vital component of long-term investment returns. This is not a recent phenomenon. Contrary to what some investors believe, dividends and the reinvestment of dividends have played a leading role in common-stock returns. During bull markets, dividends can seem like an afterthought; but, over the last seven decades, dividends have accounted for an average of 54% of each decade’s stock market returns.

Today, dividend securities are becoming more popular in Europe as a result of the European Central Bank’s $63 billion a month bond-buying program, which began in March. The bond-buying program, also referred to as quantitative easing (QE), has increased government-bond prices, resulting in much lower bond yields.

According to the The Wall Street Journal, European equity dividend funds have seen the fastest pace of inflows since the 2008 financial crisis. Already this year, the flow of money into dividend funds, sometimes viewed as substitutes for bonds, has exceeded the amount for all of 2014.

Said European money manager Toby Nangle, “With bond yields having fallen so far, retail investors are increasingly looking to take on more risk and go into European equities”.

For the European saver, though, equities are still a riskier bet than bonds. While many higher-dividend-paying stocks tend to be seen as less volatile than the broader market, they will still decline during bear markets. And, as money has poured in, European equity dividend yields have declined from about 4% last October to about 3.8% today. As stock prices rise, the current yield declines.

Aside from causing a shift from bonds to dividend payers, the ECB’s quantitative easing policy has helped make Eurozone exports cheaper for the rest of the world, especially for the U.S. New export orders rose to their highest levels in over 10 months, encouraging manufacturers to hire at a faster rate compared to the last several years.

Investing in the Nordics

On the international front, one area of focus for us is the Scandinavian countries, with investments that include Orkla, Atlas Copco, and Fidelity Nordic. There is something unique about the Scandinavian countries; despite brutal cold and minimal sunshine, these countries consistently perform at the top of the world’s happiness rankings. In fact, Denmark and Norway were ranked the first and second happiest countries by the World Happiness Report (a U.N. publication). Sweden came in at fifth-happiest, followed by Finland at seventh and Iceland at ninth. The entire region lands in the top 10.

Nordics Among Happiest Countries

It’s not by accident that these countries are high in happiness. The Nordics are powerful innovators, with the four major Nordic economies ranking in the top 15 on Bloomberg’s list of the most innovative countries. The Nordics are also some of the most productive countries on earth. All four economies produce top-20-ranked per-capita GDP. That means the capital and human resources in these countries are being utilized efficiently and effectively.

A vital piece of progress for a country is peace. A quick look at the economic destruction wrought in countries like Ukraine and Syria, where peace has been shattered, will tell you just how important peace is to an economy. Nordic countries score very high on the Global Peace Index. Coming in at 1) Iceland, 2) Denmark, 6) Finland, 10) Norway, and 11) Sweden, these countries have avoided global turmoil.

The sum of all the ranking and indexes can be approximated by FutureBrand’s Country Brand Index. The index attempts to measure the world’s perception of each country as a brand. The Nordics all score in the top 15. Well-run countries tend to breed strong economies, and strong economies tend to make for strong businesses.

Orkla

Orkla, by example, is one of Norway’s oldest business conglomerates, founded over 350 years ago. Orkla has transformed itself to become a pure branded-consumer-products company with a concentration in the Nordics. Orkla owns a portfolio of well-known brands that primarily sit at the No. 1 and No. 2 positions in the Nordic region. The stock has a current yield of 5%.

Atlas Copco

Atlas Copco, originally named AB Atlas, was founded in 1873 to produce and sell materials for the railroad industry. The company quickly became Sweden’s largest manufacturer. After a recession hit Atlas hard, it was forced to diversify into industrial production of other kinds. In its new operations, Atlas employees began using a pneumatic tool built in England. Without any access to spare parts for the machine, company engineers and craftsmen built their own. Soon they had reverse-engineered the entire pneumatic machine and could build the technology themselves. By the time World War I started, pneumatics were replacing railroad-related production as Atlas’s premier business, and that remains so today. Atlas Copco is also a worldwide leader in compressors, construction and mining equipment, power tools, and assembly systems. Atlas does business in over 170 countries and employs 37,500 people. The stock has a current yield of 2.0%.

In our view, it is sensible to gain exposure to both strong economies and strong businesses. Most often, dividend-paying companies are stronger and more durable businesses than non-payers. Payers often have higher barriers to entry and stronger balance sheets than non-payers. And because there is a stigma associated with cutting dividend payments, the consistent payment of dividends is a signal of management confidence in the future prospects of a company. This is especially true of companies that raise dividends. Management teams rarely commit to higher dividend payments unless they are confident that the dividend can be maintained through thick and thin.

Have a good month and, as always, please call us at (888) 456-5444 if your financial situation has changed or if you have questions about your investment portfolio.

Sincerely,

Matthew A. Young

President and Chief Executive Officer

P.S. According to a March 2015 study from Swiss Re, seven years after the financial crisis, central banks are still keeping interest rates at historically low levels. Low interest rates help finance governments’ debt and lower funding costs, as well as support growth. But such policy actions cause financial repression. This comes at a substantial cost for both households and long-term investors, such as insurance companies and pension funds.

With continued increases in bond prices, expensive stocks and relatively low volatility, the impact of financial repression on markets is indisputable. Meanwhile, the impact of foregone interest income for households and long-term investors has become substantial: in the U.S. alone, savers have lost about $470 billion in interest rate income (net) since the financial crisis (2008–2013).

P.P.S. In early March we began buying iShares MSCI EMU (EZU) and WisdomTree Europe Hedged (HEDJ). EZU provides unhedged exposure to euro-area stock markets. EZU is a market-capitalization-weighted index of euro-area stocks. The fund’s top holdings include Bayer (pharmaceuticals), Sanofi (pharmaceuticals), Total (oil and gas), Banco Santander (banks), and our favored Anheuser-Busch (beer). The fund has a .49% expense ratio and yields about 3%. The WisdomTree Europe Hedged Equity Fund (HEDJ) tracks the performance of the WisdomTree Europe Hedged Equity Index. The index is based on dividend-paying companies that are domiciled in Europe and traded in euros. Companies must have at least $1 billion in market capitalization and derive at least 50% of their revenue from countries outside Europe. The components of the ETF are weighted by their annual cash dividends, with 5% caps on individual positions and a 25% cap on sectors and countries. The WisdomTree fund has a .58% expense ratio. Its top holdings include Anheuser-Bush (beer), Telefonica (telecom), Banco Santander (banking), Unilever (consumer goods), and Banco Bilbao Vizcaya Argentari (banking).

P.P.P.S. We began purchasing EZU and HEDJ for several reasons. First, the ECB quantitative easing program and negative interest rates in the region should provide a tailwind to stocks. Second, the euro-area economy appears to be better. The Citigroup Euro-area Economic Surprise Index is soaring. The Citigroup Economic Surprise Index provides a snapshot of how an economy is performing relative to investor expectations. When the index rises, economic data is coming in better than expected. Positive economic surprises are often bullish for stocks, a trend that has proven true in the euro area. And lastly, we believe European stock valuations are more appealing than those in the U.S. With the euro depreciating by 20% against the U.S. dollar over the last year, euro-area company earnings are poised to improve.       


Global Diversification

January 2015 Client Letter

The global economy is much more interconnected than it was only a couple of decades ago. Global trade, as measured by the sum of exports and imports, is now 60% of world GDP compared to 40% in 1990 and 26% in 1960. A majority of the world’s investment opportunities now reside outside of the United States. The chart below from Fidelity Investments shows the number of globally listed companies and the share of globally listed companies. Over the last 25 years, the number of globally listed companies has more than doubled to 40,000, while the U.S. share of globally listed companies has plunged to about 10%.

In 2014, large-capitalization U.S. stocks were the standout performer on the global stage. The S&P 500 was up 13.7% last year. Smaller capitalization U.S. stocks, as measured by the Russell 2000 Index, were up 4.9%. Outside the U.S., stocks were down. The popular MSCI EAFE Index (Europe, Australasia, and Far East) was down 4.2% in 2014, while the MSCI Emerging Markets Index dropped 3.92%. Looking at the Vanguard Total World Stock Index Fund, which includes U.S. and developed and emerging foreign markets, global stocks were up about 3.92% last year.

With foreign markets lagging U.S. markets last year, and over the last couple of years, some investors are questioning the need for global diversification. Diversification by its nature cuts off the extreme returns on both the upside and downside. This middle-of-the-road approach reduces volatility and helps many investors stay the course during more troubling periods.

A global approach was especially useful in the years following the dotcom bust. How useful? From year-end 1999 to year-end 2007, the MSCI EAFE Index earned 58% compared to 14% for the S&P 500.

Last Year’s Bond Market

Despite projections for interest rates to rise from an overwhelming majority of analysts, long-term rates declined significantly in 2014. The 10-year Treasury note yield fell to 2.17% from over 3% at year-end 2013. Short-term rates moved in the opposite direction. The 2-year Treasury note yield increased to .66% from .38% in January 2014. Short-term interest rates rose as the Federal Reserve signaled the first Fed funds rate hike in almost nine years was nearing.

The drop in long-term interest rates was a boon for our favored Vanguard GNMA Fund, which gained 6.8% last year. Falling long-term rates also helped our clients’ positions in long-term Treasury inflation protected securities (TIPS) and in closed-end municipal bond fund positions we initiated during the so-called “taper tantrum” in the summer of 2013. Both were up double digits last year. We exited the TIPS position mid-year last year, but held the muni positions for the duration of the year.

The other notable trend we saw in the bond market toward the end of 2014 was an increase in credit spreads. The credit spread on a bond is simply the additional yield, above the yield on risk-free Treasury securities that investors demand for bearing credit risk. The lower the spread, the lower the margin of safety on a bond.

Heading into 2014, spreads were at historically low levels. As a result, during 2014 we began building a position in short-term Treasuries. We did not feel our clients were being adequately compensated for the credit risk in corporate bonds. Our strategy was to build a Treasury position over time, until and unless spreads moved back to levels that offered adequate compensation for risk.

As the chart below indicates, spreads moved significantly higher in the fourth quarter of last year.

As we head into 2015 we are seeing long-term treasury yields continue their decent. The persistent decline in long-term U.S. interest rates in the face of both an economy that is gaining momentum and a Federal Reserve that is planning to hike rates later in the year is out of character.

It would appear that falling yields globally are pressuring U.S. rates lower. While interest rates in the U.S. are at some of the lowest levels in U.S. history, rates in Germany, Japan, and Switzerland, to name a few, are even lower. As of this writing, the yield on 5-year German bonds is minus 0.05%. Investors are actually paying the German government for the privilege of lending them money.

With yields falling on Treasury securities and spreads widening, the more compelling opportunities are now in the corporate bond market, in our view. Much of the volatility in corporate bonds in the fourth quarter was centered in the energy sector, so that is where we have been looking for opportunities. We are focused on acquiring bonds of energy companies with solid financial positions or valuable collateral that helps minimize risk to principal in the event of default.

The Energy Markets

Oil prices have come down sharply over the last six months. The combination of tepid global demand and a significant increase in supply from the North American shale boom has created an oversupply of oil. The losses in oil accelerated following an OPEC decision in late November to maintain production at current levels.

The sharp drop in oil prices over a short period of time has taken a toll on oil and gas producers. The S&P 1500 Oil & Gas Exploration and Production Index is down 33% from its high last year. The bonds of energy producers are also selling off.

For the U.S. economy, in the short run, lower oil prices should be a net benefit. Lower oil prices act like a tax-cut for consumers, boosting discretionary income. Low- and middle-income consumers who spend the greatest share of their income on energy should benefit the most.

The longer-run implications of plunging oil prices are less certain. It is true that the U.S. is still a net importer of oil, but we import a lot less oil than we did 10 years ago. So the historic response of the economy to lower oil prices might not be how the economy responds this time. It is also true that the shale boom in the U.S. has been a big driver of growth and investment during the recovery. If oil prices stay at current levels, investment in the oil and gas sector can be expected to fall significantly. Incomes in the oil and gas sector are also going to take a hit from lower oil prices.

Energy Securities

To navigate the current downturn in the energy sector, we are currently focused on lower-cost integrated energy companies with strong balance sheets and the ability to weather a prolonged downturn in oil prices. We do hold some higher-cost producers in the oil and gas space. One such company, Canadian Oil Sands, has fallen sharply with oil prices. The dividend has been reduced and, if prices were to stay below $50 per bbl indefinitely, Canadian Oil Sands would suffer. However, if oil prices move back toward the marginal cost of production (the cost to produce the last barrel of oil consumed), Canadian Oil Sands has decades of profitable production ahead of it.

Deflation

There is a lot of confusion on deflation. Policymakers are partly to blame for this. Deflation is not a universal bad. In fact, deflation was a regular part of the economic landscape until the Federal Reserve came onto the scene in 1913.

Deflation means falling prices. What is bad about falling prices? Deflation raises the purchasing power of a dollar, which, of course, raises living standards.

Policymakers believe deflation cannot be allowed to take hold; because once prices start to fall, consumers delay purchases in anticipation of falling prices, which leads to lower prices and then lower incomes and so on and so forth until what, we are not told. But there is no evidence for such behavior outside of the debt deflations (a different animal) during the Great Depression and Japan’s bust in the 1990s.

In fact, there is more convincing evidence to the contrary. The U.S. information technology sector has experienced persistent deflation for the least 25 years, which hasn’t stopped consumers from purchasing technology goods (chart). Technology is arguably the most dynamic sector of the U.S. economy.

Deflation is also a positive for savers, and it makes today’s low bond-yields more attractive than they might appear to be on the surface. A 2% yield with 2% deflation provides the same inflation-adjusted returns as a 6% yield with 2% inflation.

Is It Time To Become More Aggressive?

The more speculative sectors of the market have indeed performed well in recent years, but this is often the case in the mature stages of a bull market. After years of gains, complacency tends to set in and investors throw caution to the wind. But assets that rise quickly can fall just as fast. A longer-term view provides some much-needed perspective.

Take a look at the growth of $100 invested in the NASDAQ Composite index, the Merrill Lynch Corporate bond index, and a T-bill index for the 15-year period ending in 2014. During this period, the NASDAQ returned only 38%, lagging even T-bills while boring old bonds have more than doubled investors’ money.

Outlook for International Markets

For long-term investment, we believe foreign stocks offer compelling relative appeal at today’s levels. The chart below shows the relative performance of the MSCI EAFE index, excluding Japan, compared to the U.S. stock market. We exclude Japan here because the country’s bubble and bust greatly distorted the index. The performance of foreign stocks and U.S. stocks tend to move in long up and down cycles. At current levels, foreign stocks may still have some limited downside versus U.S. stocks; but, based on the chart, the upside is many times greater than the downside.

Regardless of whether a security is domestic or international, dividends and interest remain the heart of our investment strategy. Over time, dividends and the reinvestment of dividends make up most of the return on stocks. The percentage of return coming from dividends varies by period. Since year-end 1999, dividends have accounted for about 54% of the return on the S&P 500.

When seeking out equities for purchase, we favor stocks with a long record of paying dividends, a history of consistent dividend increases, and above-average dividend yields. We also like companies with strong financial positions, which might mean low levels of debt, high levels of cash flow relative to debt, or readily available access to capital markets. Companies that operate in industries with high barriers to entry or companies with sustainable competitive advantages are also businesses we find attractive.

Have a good month. As always, please call us at (888) 456-5444 if your financial situation has changed or if you have questions about your investment portfolio.

Best regards,


Matthew A. Young

President and Chief Executive Officer

P.S. Early January surprises. The Swiss National Bank (SNB) greatly surprised financial markets in mid-January by ending a three-year-old cap on the franc. The SNB U-turn sent the franc soaring 30% against the euro and about 15% against the U.S. dollar. Six days later, Canada’s central bank delivered a surprise interest rate cut, its first since the recession. All 12 primary dealers of Canadian government securities had predicted rates would hold steady. Expect more currency and central bank surprises like these in the coming years. In my view, a currency crisis is a leading candidate to trigger a black swan event.

P.P.S. Here are some thoughts on copper from Jeremy Jones, CFA Chief Investment Officer at Richard C. Young & Co., Ltd.:

Copper is said to have a Ph.D. in economics because it has been one of the most reliable real-time barometers of the economy. With much of the world’s demand growth coming from outside the U.S., it might be more appropriate to say copper has a Ph.D. in global economics.

What does copper and the global economy have to do with oil? Well, the narrative in the financial press is that the collapse in oil prices is a supply story. The explanation I read most often is that the Saudis are in a battle for market share with U.S. shale producers (as if this makes any sense—topic for another day, though). An excess of oil supply may be part of the reason for the slide in oil prices, but if Ph.D. copper can be trusted, there is also a demand component here. Copper prices are trading at a more-than-four-year low. There is no OPEC market share battle going on for copper, so why are prices falling? And not just copper prices are sliding; iron ore, aluminum, nickel, steel, and even rubber are all trending down.

Could it be that the slide in oil and copper prices is a result of falling demand as much as rising supply?

P.P.P.S. And Steve Forbes in the January 19, 2015, issue of Forbes:

“The world situation is a mess. Japan, Brazil, southern Europe and France are in recession. Germany’s economy is stalled. China is up to its neck in bad loans from its superstimulus spending binge following the 2008–09 financial crisis. The U.S. is growing at a 3% rate that looks good only in comparison with everyone else. Remember, we’re in the sixth year of a recovery; never before in our history has there been such a punk recovery from a sharp economic downturn. Median incomes are still lower than they were before the crisis. The rate of labor-force participation remains awful. Moreover, as the rest of the world contracts, our economy will be hurt.”


A 25 Year Focus on Dividends and Income Investing

November 2014 Client Letter

This month marks 25 years since Richard C. Young & Co., Ltd. began helping conservative retired and soon-to-be-retired investors. During our two-plus decades investing for clients, we have made income investing a focus of our investment strategy. We believe that for investment purposes, as opposed to speculation, a stock portfolio with an emphasis on dividends can be a winning approach.

The framework for making our investment decisions is largely thanks to Ben Graham’s The Intelligent Investor, first published in 1949. The Intelligent Investor has been credited as one of the best books on investing ever written. Many investors have been drawn to Graham’s style of value investing, which is thought to protect investors against areas of possible substantial error and to teach investors to develop long-term strategies with which they will be comfortable down the road.

Here are two of our favorite Ben Graham quotes:

One of the most persuasive tests of high quality is an uninterrupted record of dividend payments going back over many years. A record of continuous dividend payments for the last 20 years or more is an important plus factor in a company’s quality rating.

and

For the vast majority of common stocks, the dividend record and prospects have always been a most important factor in controlling investment quality and value. In the majority of cases, the common has been influenced more markedly by the dividend than by reported earnings. In other words, distributed earnings have had a greater weight in determining market price than have retained earnings.

The Capital Appreciation Trap

A painful lesson learned by many investors during the past 15 years is to not rely solely on capital appreciation for stock-market gains. Investors who were seduced by the promise of speculative gains during the dot-com bubble and in the years leading up to the real-estate collapse were left not only with decimated portfolios, but with portfolios that produced little annual income.

The ultra-low-yielding NASDAQ Index has increased more than threefold over the last five years, but the ugly reality for NASDAQ investors is that the index remains below its level 14 years ago. That’s almost a decade and a half without a net positive return! Even the stodgier Dow Jones Industrial Average has experienced long periods of no growth. Over 16 years, from 1965 to 1981, the blue-chip Dow fell 10% in price. Sixteen years is most of a retirement for many investors. The dismal performance of the NASDAQ and the Dow in these two periods is a sobering reminder that stock prices can remain depressed for long periods.

Dividends a Vital Component of Long-Term Stock Market Returns

We believe a solution to these long dry spells is to make dividends an important part of equity portfolios. Dividends can be a vital component of long-term stock-market returns. Over short time-frames and during long bull-markets, dividends may seem trivial—but as Figure 1 illustrates, over the last seven decades, dividends have accounted for an average of 54% of each decade’s stock-market returns. Over the last 14 years, when the NASDAQ didn’t gain a single point, high-dividend-payers compounded investors’ money at 9%. And during that 16-year period from 1965 to 1981, when the Dow fell in price, high-dividend-yielding stocks earned a compounded annual return of 8.1%.

When measured over multi-decade periods, the scales become even more tilted in favor of dividends. Over the last 40 years, dividends and the reinvestment of dividends have accounted for over 70% of the S&P 500’s total return. Dividend stocks, and especially high-dividend-yielding stocks, have appeal for many types of investors. A continuous stream of dividends can be used for living expenses (ideal for retirees) or potentially reinvested at a lower share price, resulting in higher future-dividend payments (ideal for long-term wealth accumulation). A steady stream of cash may also make it easier for investors to avoid emotionally charged decisions that can sabotage portfolios in down markets.

The Stability of Dividend Returns

Figure 2 compares the capital-gains component of returns to the dividend component of returns for high-yielding stocks. Note the stability of dividend returns compared to capital gains.

Dividend Stocks are Less Volatile

What’s more, dividends help reduce portfolio volatility. Figure 3 shows that high-yielding stocks have been less volatile than non-dividend-paying stocks. And high-yielders have held up better in down markets than both non-dividend-payers and broad-based stock-market indices such as the S&P 500.

With the Federal Reserve and other global central banks pumping trillions of dollars into the global financial system while holding interest rates at zero, the risk of accelerating inflation is higher than it has been in decades. Stocks shouldn’t be the first asset-class you think of for inflation protection, but they do have an important inflation-fighting role to play in your portfolio.

Dividends Help Fight Inflation

Stocks tend to maintain their purchasing power during inflationary periods because they are real assets. When inflation rises, the revenues, earnings, and dividends of companies tend to rise as well. Figure 4 shows that dividends per share for the S&P 500 have outpaced inflation by a wide margin.

Dividend Stocks a Shortcut to Quality

A dividend strategy can also help you avoid many of the pitfalls that wreak havoc on even the most seasoned investors’ portfolios. Dividend-paying companies are often more durable businesses than non-dividend-payers. Payers are also more likely to operate in industries with higher barriers to entry and have stronger balance sheets than non-dividend-payers. And because there is a stigma associated with cutting dividend payments, the consistent payment of dividends is a signal of management confidence in the future prospects of a company. This is especially true of companies that raise dividends. Management teams tend not to commit to higher dividend payments unless they are confident the dividends can be maintained through thick and thin.

Cold, hard cash in the form of quarterly dividend payments may also help investors avoid some of the most deplorable examples of corporate fraud. Who can forget the accounting frauds of Enron, WorldCom, and Tyco that decimated many retirement portfolios? Not a single company in the group paid a meaningful dividend. Companies can manipulate and fake earnings by using creative accounting techniques, but regular dividend payments can’t be faked.

Obviously a dividend-centered strategy will not totally insulate a portfolio from corporate fraud, negative returns, or other portfolio unpleasantness. But investing in a group of quality companies, each who pays its shareholders annually in cash, is a way of getting off on the right foot and most likely a way to increase one’s comfort level when markets take a turn for the worse.

And perhaps the most persuasive reason and my favorite for investing in payers is the role they play in the compounding process. Compounding is essentially a snowball effect when dividends generate even more dividends. Investors receive dividends not only on their original investments but also on accumulated dividends—allowing a portfolio to grow faster and faster as time passes.

Have a good month. As always, please call us at (888) 456-5444 if your financial situation has changed or if you have questions about your investment portfolio.

Best regards,

Matthew A. Young

President and Chief Executive Officer

P.S. Three of our currently favored equity sectors, healthcare stocks, consumer staples (with a focus on food and drink companies) and utilities are often recommended as defensive holdings for recessions and bear markets. The thinking here is that, regardless of the economy’s health, people will always take their meds, eat, and drink, and they prefer to do so with the lights on.

The flip side to this argument is that defensive sectors may not be the best holdings during bull markets, when tech and more speculative stocks tend to lead the way.

However, health, consumer staples, and utilities have been more than defensive plays in 2014. All three currently outperform the S&P 500; healthcare leads the way, up 22%, followed by utilities, up 18.9%, and consumer staples, up nearly 12%.

P.P.S. Of the three sectors mentioned above, consumer staples and utilities currently have yields higher than the 10-year Treasury note. Consumer staples yield 2.38% and utilities yield 3.27, while the 10-year stands at 2.32%.

P.P.P.S. For the third year in a row, Barron’s has recognized Richard C. Young & Co., Ltd., as one of the top independent advisors in the country. For nearly 25 years, we have operated as an independent firm, meaning we do not underwrite securities or execute trades or custody assets. Our advice and investment decisions are free of the conflicts of interest that plague commission-based brokers and large Wall Street firms with securities to distribute.


Don’t Evaluate Return without Considering Risk

September 2014 Client Letter

Swiss investor Marc Faber PhD, also known as Dr. Doom, recently explained how news from McDonald’s could spell trouble for the stock market. On Tuesday, September 9th, McDonald’s reported a 3.7% decline in global same-store sales. That ranks as the company’s worst global same-store sales results in more than a decade.

Said Faber, “We had, essentially, very poor sales from McDonald’s. Now, McDonald’s is a very good indicator of the global economy. If McDonald’s doesn’t increase its sales, it tells you that the monetary policies have largely failed in the sense that prices are going up more than disposable income, and so people have less purchasing power.”

Faber has accused the policies of the Federal Reserve and other central banks of increasing asset prices and creating inflation. And while the Fed and others claim inflation is currently not a problem, he believes inflation is rising faster than income and reducing the amount individuals can spend.

While Faber does not believe the technical picture for the market is positive, he is hesitant about making a prediction to the timing of a bear market. “I have always argued that we don’t know how the world will look in five years’ time…. Maybe the S&P is at 3,000, but it could also be at 1,500—we just don’t know. There’s a lot of manipulation between fiscal and monetary policies. So I want to be diversified.”

Diversification is a central investment strategy of Faber’s. He wants to make money but is not interested in chasing returns of the hottest sectors.

In his September investment report Faber had interesting comments on the topic of diversification. “I am fully aware that diversification sometimes comes at the price of an underperformance of the best-performing asset classes. In this respect, I should like to mention that in the late 1990s, fund managers that did not overweight high-tech, media, and telecom stocks “did not understand” the importance of the New Economy, in the eyes of their clients, and consequently suffered from huge client defections. Just ask Jeremy Grantham, whose Boston-based fund manager, GMO, underperformed during the dotcom bubble, as it stuck to its “value” approach of investing in “inexpensive” equities. As a result, GMO lost a large number of its clients.”

“Most famous is the case of the late Tony Dye, who at the time was a star UK fund manager at PDFM. Known also as “Dr. Doom”, Dye refused to buy the dotcom fad, which led to an exodus of clients in the late 1990s. He was sacked in February 2000, just three weeks before his strategy began to pay off. In 2000, PDFM topped the performance tables. Unfortunately, it was too late for Tony Dye….”

An investment strategy overly focused on performance and past returns can wreak havoc on portfolios. As Faber alludes, many investors of the late 1990s placed too much emphasis in the speculative end of the market, believing long-time, experienced value managers had lost their way. Those over-exposed in the highest-performing NASDAQ sectors eventually learned the adverse consequences of the New Economy. For some, those lessons are still being learned today, as the NASDAQ 100, a sub-index of the 100 largest companies in the NASDAQ Index, is still down double digits since its March 2000 peak.

Chasing performance can be a tricky strategy. Investors late to the game invest in a high performer after most of the growth has occurred. During the tail end of the dotcom era, investors continued to load up on the most speculative shares, perhaps catching the remaining gains but absorbing most or all of the losses.

Mutual fund companies frequently promote their successful funds. Most fund groups manage lots of funds covering a wide range of investing styles and sectors. If enough ground is covered, you are bound to come up with a few winners each year.

Our Chief Investment Officer, Jeremy Jones, ran a Morningstar screen of the top-performing, U.S.-focused, large-cap blend (combination of growth and value) funds to determine which funds are beating the market year-to-date. This year, out of the 467 large-cap blend funds in the Morningstar database, about 94 have bested the S&P 500’s 9.74% return.

The top-performing fund, according to Morningstar, is Upright Growth, up 20.1% year-to-date. How have Upright Growth and the other funds at the top of the heap beaten the market? Among the Top 10 performing funds on the Morningstar list, the five largest holdings (across the ten) are Apple, Microsoft, Gilead, Wells Fargo, and Amazon. Not the most conservative group of names.

In other words, the top-performing funds of 2014 have done well by taking on risk, and lots of it. The tiny Upright Growth Fund has a standard deviation (a measure of volatility) of almost 18% compared to the 11.6% standard deviation of the S&P 500. The average standard deviation of the top-five-performing large-cap blend funds is 15%. And four of the five fall into Morningstar’s high-risk category.

As was the case last year, so far in 2014, the top-performing funds have been those taking the greatest amount of risk. High risk can look good on paper as markets rise, but in practice, high-risk strategies can lead to improperly balanced portfolios that are susceptible to significant losses when markets turn down.

In terms of future market returns, it may be prudent to temper expectations. Investors like Bill Gross and Jeremy Grantham believe that a combination of slower U.S. growth, poor policies, and prolonged Fed intervention will lead to a less promising environment.

Bill Gross, formally of PIMCO, has stated he can see a market where bonds return 3% to 4% a year on average and stocks return 4% to 5%. Part of his low-return predictions are based on lower expectations for U.S. GDP growth, which could stay around 2% annually.

Gross recently wrote, “This global monetary experiment may in the short/intermediate term calm markets, support asset prices and promote economic growth, although at lower than historical levels. Over the long term, however, economic growth depends on investment and a rejuvenation of capitalistic animal spirits – a condition which currently does not exist. Central bankers are hopeful that fiscal policy (which includes deficit spending and/or tax reform) may ultimately lead to higher investment, but to date there has been little progress. The U.S. and global economy ultimately cannot be safely delivered with artificially low interest rates, unless they lead to higher levels of productive investment.”

Last March, Jeremy Grantham told Fortune magazine that he believes the Fed has manufactured increases in the stock market. Grantham continues to have an uninspired outlook for the years ahead.

“There’s no proof on the other side, that the economy is any stronger from quantitative easing. There’s some indication that the crash would have been worse and the downturn would have been sharper had the Fed not stepped in, but by now the depths of that recession would have been forgotten, the system would have been healthier, and we would have regained our growth.”

“Yes, I agree that the Fed can manipulate stock prices. That’s perhaps the only thing they can do. But why would you want to get an advantage from the wealth effect when you know you are going to have to give it all back when the Fed reverses course? At the same time, the Fed encourages steady increasing leverage and more asset bubbles.”

“We invest our clients’ money based on our seven-year prediction. And over the next seven years, we think the market will have negative returns. The next bust will be unlike any other, because the Fed and other central banks around the world have taken on all this leverage that was out there and put it on their balance sheets. We have never had this before. Assets are overpriced generally. They will be cheap again. That’s how we will pay for this. It’s going to be very painful for investors.”

The timing of the next market correction is, of course, difficult to predict. I like Marc Faber’s view that no one knows how the world will look in the years ahead and lots can happen in a short period of time. The markets could continue to go up or we could have a significant correction. Significant market moves are often determined by future events that we did not expect to occur. The collapse of Lehman Brothers in 2008 and the Federal Reserve initiating quantitative easing are two examples of unforeseen impactful events.

And we also appreciate Faber’s investment strategy of diversification. For most retired and soon-to-be-retired investors, we favor a balanced portfolio with a combination of short to intermediate term bonds, currencies, and a globally diversified mix of dividend-paying stocks. We invest with the goal of receiving a steady flow of interest and dividends each year.

Have a good month, and as always, please call us at (888) 456-5444 if your financial situation has changed or if you have questions about your investment portfolio.

Best regards,

Matthew A. Young

President and Chief Executive Officer

P.S. In a September WSJ editorial, economist David Malpass writes how the Fed is planning to maintain its enormous balance sheet, approximately $4.5 trillion in Treasuries and mortgage-backed securities.

“Far from being neutral or stimulative, these policies have caused huge distortions in financial markets, contributing to slow growth and falling median incomes. Given the tendency of government programs to expand and become permanent, the risk now is that the Fed’s large pool of assets and liabilities evolves into a semi-permanent government-controlled investment fund, a U.S. version of the sovereign-wealth funds created by other governments.

The longer the Fed holds its portfolio, the greater the danger that political forces will nudge its investments away from Treasury securities. The Fed already owns bonds created by Fannie Mae and Freddie Mac, helping them take market share in the mortgage market from the private sector. There have been many proposals in recent years to set up infrastructure banks, for example. Perhaps the Environmental Protection Agency could set up an environment fund that issues bonds for the Fed to buy as a creative way to finance the fight against global warming. Japan, China, and others own large holdings of dollar-denominated bonds, and it’s easy to see a future Fed edging its portfolio into euro- and yen-denominated bonds to manipulate the value of the dollar.”

P.P.S. According to a WSJ report dated September 15, 2014, “Falling crude prices could be good news for a U.S. economy still struggling through an uneven recovery. Gasoline prices fell to a national average of $3.39 a gallon Monday, according to AAA, and are running nearly 4% below year-ago levels. Commerce Department data last week showed consumer spending rose as gasoline spending fell. The U.S. is producing 8.6 million barrels of oil a day, the highest level in nearly 30 years and nearly 13% higher than last year’s average, according to government data. Much of the oil produced from shale formations around the country trades at a steep discount to the U.S. benchmark, reflecting the glut in key markets such as the Gulf Coast.

P.P.P.S. Economist Richard Rahn, in a September 15th commentary in The Washington Times, suggests future U.S. presidential candidates run on a positive message that will resonate with voters. Included in his policy suggestions are: 1. Not being #32 in tax competitiveness among industrialized countries. 2. Ending the practice of asset forfeiture by our government, including a real punishment to the IRS for its continued misdeeds. 3. Properly recognize and address that excessive regulation is a clear drag on economic growth and regulation. 4. Putting an end to contradictory regulations which government agencies have used to extract huge, unjustified fines from companies, especially banks.


Quality and Dividends

August 2014 Client Letter

Quality and dividends. If I had to describe our equity strategy in as few words as possible, that would probably do it. This is good news for most clients who are retired or soon to be retired. The strategy is easy to understand and provides a degree of comfort in today’s uncertain global economy.  There is nothing more overwhelming than having one’s nest egg tied to an investment strategy that requires a long, confusing explanation, and nothing more underwhelming than a strategy that’s too generic, diversified across too many stock and country sectors.

Longtime favored stock Johnson & Johnson (JNJ) fits our quality and dividends requirements nicely. JNJ is generally thought of as a stodgy company. But there’s nothing boring about its stable of popular brands, including Band-Aid, Tylenol, and Splenda. Nor is there anything boring about its dividend payout dating back to 1944. For investors, the consistency of an annual dividend check is reassuring, especially during periods of market volatility.

Investors can take comfort in JNJ’s rock-solid AAA credit rating, $32 billion in cash reserves, and $17 billion generated annually in operating cash flow. JNJ’s other brands include Bengay, Rogaine, Neutrogena, Listerine, and Sudafed, make the company a branded consumer products powerhouse.

Vanguard Healthcare ETF

For additional exposure to the health-care industry, we purchase Vanguard Health Care ETF (VHT). VHT owns 312 stocks spread across the health-care industry, with its largest holdings in pharmaceuticals, biotechnology, health-care equipment, and managed health care. Its 10 largest holdings make up 45% of the fund and are mostly drug companies. In the past, we have steered away from drug companies. We feel the discovery process for new drugs is too risky in most cases to bet on just one company. By owning the Vanguard Health Care ETF, we reduce the “discovery risk” by owning a broad group of drug names.

JNJ and the health-care industry in general are set to benefit from an enormous demographic tailwind. The percentage of Americans over 65 will jump from 13% to 19% in just 20 years and will hit 20% by 2040. The combination of aging baby boomers and low birth rates is pushing the percentage of elderly people up to record levels. In 2010, the over-65 crowd generated 34% of health-care spending while only representing 13% of the population. They spent three times more than the average working-age person on health care.

In particular, older Americans are spending more on prescription drugs. According to the latest data from the National Center for Health Statistics (released in 2010), in 2008, 88% of Americans over age 60 were using prescription drugs, and 37% of Americans 60 and over were using five or more prescription drugs on a regular basis. Drug use is also up across the general population. According to a 2013 Mayo Clinic study, “Nearly 70 percent of Americans are on at least one prescription drug, and more than half take two.” That’s a lot of drug use.

Looking ahead, health-care spending is projected to increase to $5 trillion, or 20% of GDP, by 2022. That means health care will play an increasingly large role in America’s economy, and investors will not want to ignore an industry representing one-fifth of the economy.

So it appears the health-care industry has decent momentum behind it. But what about the rest of the U.S. economy? As things stand today, the economy seems to be in OK shape based on the following economic indicators.

How to Use the Leading Economic Indicators

First off is the Leading Economic Index (LEI). The components of the LEI are released monthly by the Conference Board. The Conference Board, founded in 1916, is an independent business membership and research association. The LEI comprises 10 components, including average weekly hours, manufacturing; average weekly initial claims for unemployment insurance; manufacturers’ new orders, consumer goods and materials; ISM Index of new orders; manufacturers’ new orders, nondefense capital goods, excluding aircraft orders; building permits, new private housing units; stock prices, an index of 500 common stocks; Leading Credit Index; interest rate spread, 10-year Treasury bonds less federal funds; and average consumer expectations for business conditions.

In a press release from July 18, 2014, the Conference Board noted, “Broad-based increases in the LEI over the last six months signal an economy that is expanding in the near term and may even somewhat accelerate in the second half. Housing permits, the weakest indicator during this period, reflects some risk to this improving outlook. But favorable financial conditions, generally positive trends in the labor markets and the outlook for new orders in manufacturing have offset the housing market weakness over the past six months.”

The LEI is useful in helping forecast the ups and downs in the business cycle. As can be seen in our chart, the leaders today are showing decent momentum.

Next is the Coincident Economic Index (CEI). Also published by the Conference Board, the CEI offers a glimpse into whether the economy is expanding or contracting and at what pace. The components include employees on nonagricultural payrolls, personal income less transfer payments, industrial production, and manufacturing and trade sales.

Today, the coincidents look fine.

Finally, Young Research & Publishing’s Transportation Index is a market-cap-weighted index of non-airline transportation companies. The idea is if transportation companies—for example, truck, rail, and shipping—are doing well, then shipping volume must be reasonably high, indicating a good economy.

So today, the economy is not in terrible shape. And we are currently on track for a sixth straight year of positive stock returns. Of course, much of the fuel for the stock-market gains and the positive economic growth is a result of the Federal Reserve’s quantitative easing.

Since its inception in 2009, quantitative easing (QE) has been a major driver of asset price appreciation. Stocks have more than doubled since QE began, and the amount of cash on corporate balance sheets has risen dramatically.

The question many have is how the end of the Fed’s current policy will affect the markets. There are no examples from any time in history to use as a gauge for what may happen or how markets will react to QE’s eventual end. While inflation and currency devaluation are cited as potential serious side-effects, we are unsure of the scope of the long-term results.

Due to the high degree of uncertainty moving forward, many clients take comfort from our strategy of pursuing quality and dividends. As I have stated in the past, while an annual dividend is important, we also seek companies that implement annual dividend increases. And that brings us back to our favored JNJ: as of spring of 2014, the company has increased its dividend every year for the last 51 years.

Have a good month, and as always, please call us at (888) 456-5444 if your financial situation has changed or if you have questions about your investment portfolio.

Best regards,

Matthew A. Young

President and Chief Executive Officer

P.S. Some words of wisdom from Steve Forbes, in a Forbes article from August 22, 2014:

No country can become a true global economic power without having a sound and stable currency. Britain, for example, was a second-tier country until it fixed the pound to gold in the early 1700s, when Isaac Newton was Master of the Mint. Germany and Japan didn’t escape the devastation of World War II and rocket to economic prominence until each, in effect, tied its money to gold in the late 1940s. China’s surge was helped enormously in the mid-1990s, when it tied the yuan to the U.S. dollar, as Hong Kong did in 1983.

India has been bedevilled by inflation from its chronically weak rupee, as it labors under the Keynesian delusion that excessive money printing helps growth. It does the opposite. It hurts capital formation. It creates high interest rates, which in turn harm investment. It breeds crony capitalism. A money system is based on trust. Debasing a currency debases society, and inflation undermines social cohesion and social trust.

P.P.S. A Paine Webber broker facetiously told me in the 1990s, “We all hate Jack Bogle.” The founder of the Vanguard group single-handedly disrupted the fee structure in the investment industry. Primarily due to Jack Bogle, investors now have many low-cost options available when selecting stock and bond funds. Despite the broad array of low-cost mutual funds and exchange-traded funds, it surprises me to find investors owning funds with 12b-1 fees and either front- or back-end loads. High expense ratios and loads are especially damaging to returns within the bond-fund universe.

P.P.P.S. In mid-March, the NASDAQ briefly breached its level at March 31, 2000. But depending on an investor’s mix of tech stocks, the gains may offer little comfort. Since the NASDAQ’s peak on March 10, 2000, the Nasdaq-100 which tracks the index’s 100 biggest companies, is down double digits. And several companies, including Cisco, Yahoo, and Applied Materials, are still down at least 50% from their peak.