Do You Have an Investment Game Plan?
January 2018 Client Letter
History has a way of repeating itself. In early 1995 my dad wrote about a math professor named Tom Nicely, who worked at Lynchburg College. Nicely was examining prime numbers using a group of five personal computers. While four of the computers gave Nicely the correct answer to a problem, 1.2126596294086, the fifth turned up a slightly different answer, 1.212659624891157804.
The cause of the fifth computer’s error was its Intel Pentium processor. Nicely called Intel to explain but was given the cold shoulder. Next, he did something which, at that point, was still novel—he asked for help on the Internet. Others checked Nicely’s work and came back with the same results, confirming his conclusions.
Intel had already known about the problem since May when one of their own researchers had discovered it, but only after they had been backed into a corner by independent confirmation did the company acknowledge Nicely’s research. The chip maker even offered him a consulting job.
The bug was first reported in an industry journal known as Electronic Engineering Times, but when it was reported by the mass media on CNN on November 21, 1994, the stock dropped over 12.3% in a little less than a month. The stock only began gaining again after Intel offered a recall on December 20.
Today Intel is in a somewhat similar, though not exact, position. A group of researchers connected by the Internet have exposed a much larger flaw in Intel’s processors, and now the company needs to deal with the fallout.
The issues, known as Spectre and Meltdown, could potentially be used by hackers to attack computers using Intel processors. The news was again first reported in an industry journal out of the U.K., the Register. But in today’s rapid information world, it didn’t take much time to disseminate to the market. Intel’s share price dropped over 9.2% in eight days.
Only after CEO Brian Krzanich wrote an open letter to the tech industry explaining Intel’s next steps were investors willing to climb aboard Intel once more.
Do You Have a Game Plan?
We do not relay this story to you to shame Intel. What we want you to see here is that companies often undergo rough periods. The tech industry, in particular, is prone to volatility, thanks to complex products and low barriers to entry. The unexpected happens, and without a game plan, you may see a lot of your own money wiped off the board quickly.
In the stock market, our game plan has long been one laid out first by Ben Graham in The Intelligent Investor. Graham wrote, “One of the most persuasive tests of high quality is an uninterrupted record of dividend payments for the last 20 years or more. Indeed, the defensive investor might be justified in limiting his purchases to those meeting this test.” We would add to Graham’s astute analysis that focusing on companies dedicated to increasing dividends helps as well.
A Piping Hot Stock Market
To say that stocks are off to a fast start in 2018 would be an understatement. The U.S. equity market is piping hot. Melt-up is the word Wall Street seems fond of using to explain the performance. The Google Trends chart for the word “melt-up” has spiked to the highest level since Google started tracking data in 2004.
What is driving the so-called melt-up in U.S. stocks? A delayed reaction to tax cuts, a more favorable economic backdrop, and an overall pro-growth agenda from the government are presumed to be helping. But investor euphoria also looks to be a major contributor. The Credit Suisse Risk Appetite Index (a measure of euphoria) is at a record high—higher than the level reached at the height of the dotcom bubble. Ned Davis Research’s investor sentiment composite index, which aggregates many different sentiment indicators, is also at a record high (again exceeding dotcom levels). The ratio of bulls to bears in the Investors Intelligence sentiment poll is near its highest level on record. Bears have apparently gone into hibernation.
Memories (nightmares if you wish) of the rapid ascent in financial asset prices that preceded the dotcom bust and the financial crisis have some investors nervous. Based on the level of valuations and euphoria in markets, that caution may be justified. This has been one of the longest bull markets on record, and it has been aided by the lowest interest rates in 5,000 years of recorded history and the greatest amount of central bank intervention… ever.
In a recent WSJ op-ed, Martin Feldstein, a Harvard economist and former chair of President Ronald Reagan’s Council of Economic Advisers, commented on today’s financial landscape. Below are some of the highlights.
Stock prices rose much faster than profits did. The price/earnings ratio for the S&P 500 is now 26.8, higher than at any time in the 100 years before 1998 and 70% above its historical average. Although some of the market’s recent surge reflects improved expectations since the 2016 election, the P/E ratio just before the election was already 49% higher than its historical average.
The high price of stocks reflects the very low returns available on fixed-income securities. Though the federal-funds rate has been raised since 2015, its real value is still negative. The 2.5% yield on 10-year Treasury bonds approximately equals expected inflation over the next decade, implying a real yield of zero. Historically the real yield on 10-year Treasurys [sic] was about 2%….
In short, an excessively easy monetary policy has led to overvalued equities and a precarious financial situation. The Fed should have started raising the fed-funds rate several years ago, reducing the incentive for investors to reach for yield and drive up equity prices. Since it didn’t do so, the Fed now faces the difficult challenge of trying simultaneously to contain inflation and reduce the excess asset prices—without pushing the economy into recession.
Is a Major Correction in the Cards?
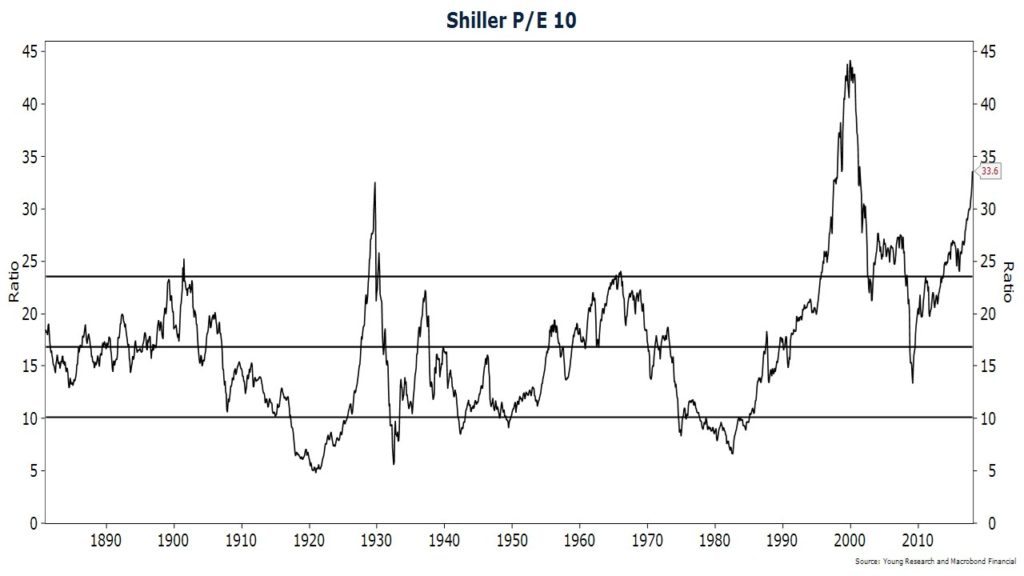
While the near-term outlook for stocks and the economy looks favorable, the long-term outlook doesn’t leave one as optimistic. As Mr. Feldstein points out, stocks are expensive and long-term interest rates are far below historic levels. The Shiller P/E ratio, which compares the price of stocks to the inflation-adjusted average of earnings over the past ten years (a method of normalizing profits), is at 33X. That compares to a long-term average of about 16.5X. Stock prices would have to fall by 50% to get back to average. The Shiller P/E ratio doesn’t adjust for new information, like the recent corporate-tax cuts, but even if you assume a 10% lift in profits to adjust for the lower taxes, stocks would still have to fall about 45% to get back to average.
The Risk of a Rise in Long-term Interest Rates
What could cause stock valuations to revert to their historic average? A significant rise in long-term interest rates might do it. Rising long-term rates is one of the biggest risks investors face. Low long-term interest rates have driven investors to reach for return in stocks, real estate, risky bonds, emerging markets, and probably even bitcoin.
A significant rise in long-term rates would act as a major headwind for stocks. Based on current rates of growth and inflation, we would peg the fair value of interest rates at something closer to 4% than the current 2.65%. A 1.35 percentage point increase may not seem like a big deal when the interest rate on your first mortgage was 10%-plus, but many assets have been priced on the basis of a continuation of today’s low level of rates. A change in that assumption could lead to a major repricing.
Bring on the Bear Market in Bonds
As balanced investors, we would welcome a rise in long-term interest rates. We have positioned portfolios to take advantage of higher rates. We hold a meaningful allocation in T-bills for many clients. Our corporate bond portfolios have a duration of two to three years. Our most interest-rate-sensitive position, barring a couple of preferreds, is Vanguard GNMA. And that sensitivity, we feel, is modest at best. Given an immediate one percentage point increase in interest rates, we would expect Vanguard GNMA to fall in price by about 5%. Extend that rise out for one year and the loss is closer to 1.5% as interest income could offset some of the price decline. Meanwhile, we would be investing maturing Treasuries and corporates into higher-yielding bonds.
Not only would higher long-term interest rates provide more income for clients, they would also yield greater diversification benefits.
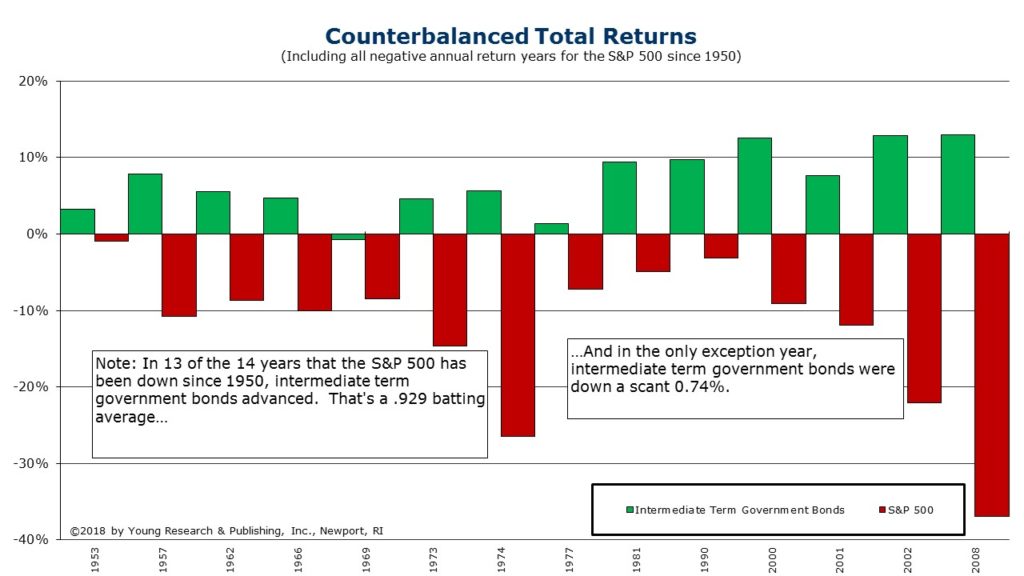
Longer-term bonds tend to rise more than short-term bonds when stocks fall. In fact, as you can see in the chart below, since 1950, the S&P 500 has been down on fourteen occasions. In all but one of those years, intermediate-term government bonds rose. And the single down-year was a scant .74%. That’s a .929 batting average.
Diversification Part of the Game Plan
We view diversification as the cornerstone of a proper investment program. We diversify our clients’ portfolios globally and across asset classes. If the U.S. stock market experienced a bear market, foreign markets would fall as well, but the extent of the decline and magnitude of the recovery in foreign shares could differ from U.S. stocks. Stock valuations abroad are not as elevated as they are in the United States. That could provide impetus for a shallower bear market and/or a swifter recovery.
Rebalancing is Too
Rebalancing is another strategy we use to mitigate the risk of a major stock market decline. Rebalancing can be counterintuitive, as it often requires one to sell his winning asset classes and add funds to his losing asset classes, but rebalancing is an important risk management tool. We attempt to rebalance opportunistically while also attempting to minimize capital gains (not an easy task nine years into a bull market).
Investment Goals
After a big run-up in any major asset class in your portfolio, it is often a good idea to take stock of your goals. Many of our clients want a reduced level of volatility, a steady stream of income that keeps pace with inflation, and the comfort of investing in a portfolio of businesses that lets them sleep well at night. Those goals may not be the same goals that your friends and neighbors share. Every investor has a different willingness and ability to take on risk. Some rely on their portfolios to help pay for elderly parents or grown children. A more conservative portfolio may be desirable under these circumstances. Others may have a healthy pension income, significant assets, or a big inheritance waiting in the wings. Such circumstances may allow for a more aggressive portfolio, but that is not to say that investors who have the ability to take on more risk always want to.
As always, if your personal financial circumstances have changed or your ability or willingness to take on risk have changed, give us a call. Don’t wait for a major market downturn to decide you want to reduce risk. Now is the time to make that decision.
Warm regards,

Matthew A. Young
President and Chief Executive Officer
P.S. Expectations for a faster pace of interest rate hikes from the Fed are ramping up. The Fed has indicated a plan to raise interest rates three times in 2018, but we would not be surprised to see a fourth hike. Rising expectations for short-term interest rate increases is pushing up yields on short-term bonds as well as money markets. If the Fed follows through with its plans to hike rates, money market yields could exceed 1% by the end of the first quarter. It would still take you 72 years to double your money at that rate of return, but that’s better than the 288 years it would have taken when rates were 0.25%.
P.P.S. My dad started Young Research and Publishing forty years ago to publish Young’s World Money Forecast (YWMF). In its first iteration, YWMF was an economic, monetary, and currency report for institutional investors, corporate officers, and currency investors. At Richard C. Young & Co., YWMF’s economic and currency heritage runs through our global investment strategy. Our international equity holdings are shaded partly by our views on foreign currencies. And, unlike some advisors, we offer a dedicated currency component in portfolios. You will see it separated on your quarterly holdings report between your bonds and stocks.
Gold and silver are regular currency holdings, but periodically we also include more traditional currency positions. The British pound was our most recent position. We closed our pound position this month with a gain. All of our currency trades don’t work out as well as the pound trade did, but one thing we find appealing about currencies is that not all participants in the currency market are motivated by profits. Businesses are in the currency market to hedge or transact, central banks and governments are attempting to manage economic outcomes, and bond investors are most often looking to hedge currency risk without regard to currency levels. That creates opportunity for profit in our view. We closed our position in the pound because we felt after the recent rapid run-up that the risk-reward trade-off had become less favorable.
P.P.P.S. As I mentioned above, we treat gold as a currency. Gold has been used as money for thousands of years. We view gold as a counter-balancer, a hedge against currency debasement, inflation, and geopolitical turmoil. It is an insurance policy of sorts. While gold hasn’t matched the strength of the stock market, it is up almost 2% YTD—surprising, considering the strength in equities and the rise in interest rates. A weaker dollar seems to be the primary driver of gold prices today.