Federal Reserve Inflates Stock Prices
May 2015 Client Letter
William McChesney Martin, the longest-serving chairman of the Federal Reserve, once said it is the Fed’s job to “take away the punch bowl just as the party gets going.”
Despite such sage advice, few have accused the Fed of being ahead of the curve when it comes to the removal of party refreshments in the modern era. In cycle after cycle, many argue, the Fed has been slow to recognize when the economy is running too hot and when it is cooling. “Better late than never” is perhaps a more fitting slogan for today’s central bank.
It would also appear to be a fitting description of the Fed’s asset-bubble radar. You may recall it was former Fed chairman Ben Bernanke who told the public in October of 2005, only months prior to the national housing bust, that soaring home prices reflected strong economic fundamentals. There was no mention of an easy-money-fueled housing bubble from Dr. B.
Bernanke’s successor at least seems to have recognized before the next bust has started that something isn’t quite right in asset markets. At a recent IMF meeting, Fed chair Janet Yellen commented, “I would highlight that equity-market valuations at this point generally are quite high. Now, they’re not so high when you compare the returns on equities to the returns on safe assets like bonds, which are also very low, but there are potential dangers there.”
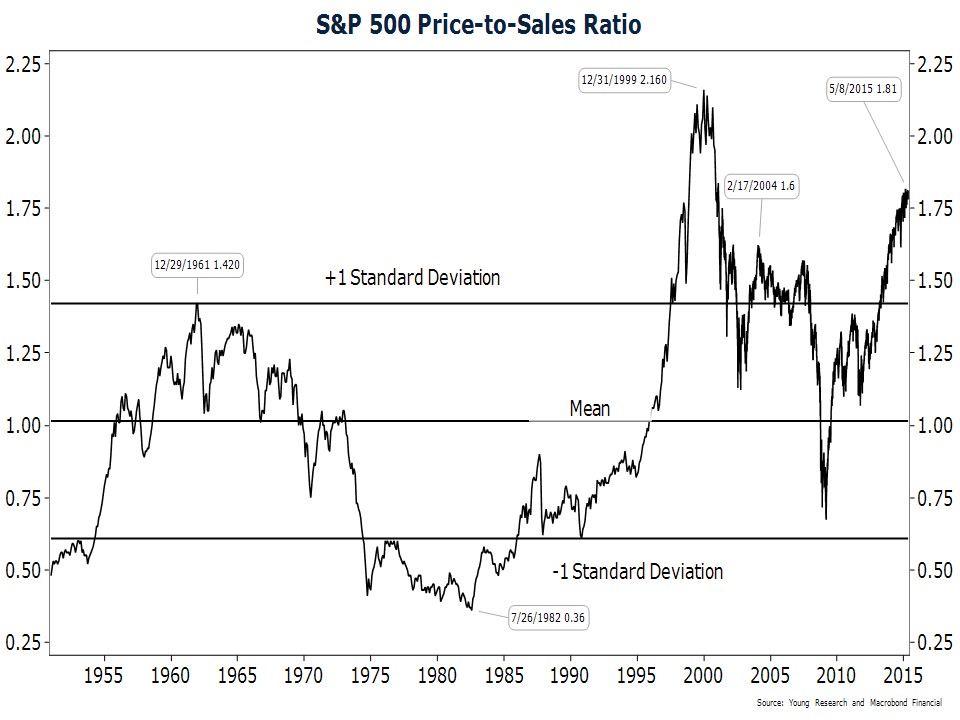
At Richard C. Young & Co., Ltd., we have argued that years of 0% interest rates and trillions of dollars in bond buying by the Fed and other global central banks have promoted bubble conditions in the stock market. Our chart on the price-to-sales ratio shows the S&P 500 is trading at one of its most expensive levels in history. The permanently bullish pundits and promoters argue that there is no need to worry because stocks aren’t as expensive as they were during the dot-com bubble. And indeed this is true, but should the largest stock bubble in U.S. history be the standard by which all stock-market valuations are judged? You wouldn’t call a 350-pound man thin just because a 500-pound man stands next to him. They are both overweight.
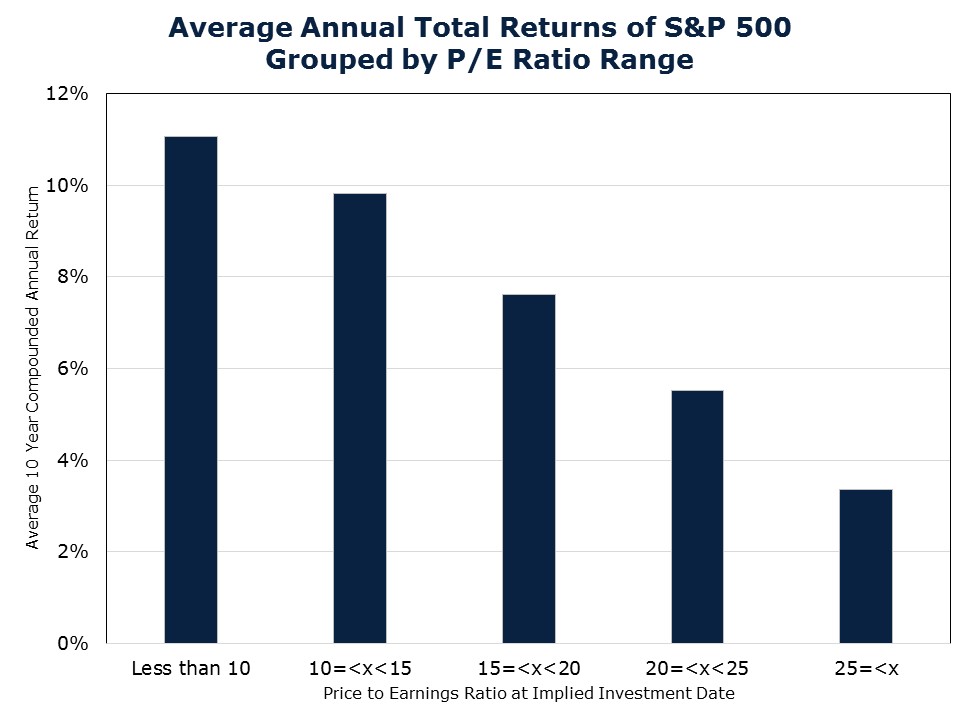
Whether you want to label today’s market a bubble or something else isn’t important. What matters is that when valuations are as high as they are today, future returns often disappoint. The chart below shows the average 10-year compounded annual return on the S&P 500 starting in different price-earnings ranges (cyclically adjusted P/E). When the starting P/E of the S&P 500 is higher than 25X, stocks have returned an annual average of only 3.4% over the following 10 years. Today, stocks are trading at a P/E of 27X.
Ms. Yellen and her defenders would admit that P/E ratios are high, but would argue that they are not so high when compared to the low level of interest rates. If stock values depend on the level of interest rates, this would imply that an increase in interest rates might be a problem for “quite high” equity valuations.
Rising interest rates? Isn’t that a quaint idea? It is true that the Federal Reserve hasn’t raised rates in almost a decade, but I would advise against taking solace in the historically low level of interest rates and in Ms. Yellen’s comments that stocks are not so high when compared to bonds. For I assure you that despite the evidence of recent years, bond yields can in fact rise, and rise quickly.
Short-term bond yields are controlled by the Federal Reserve, but the market has a say in the level of long-term interest rates (admittedly a diminishing say after quantitative easing). Over the course of the last four months, yields on the long bond have increased .85 percentage points.
Is the uptick in yields the start of a trend? That would be a welcome development for income investors. After seven lean years in the bond market, savers and retired investors are starved for income.
Short-term interest rates are going to depend on the Fed, and the Fed isn’t going to hike rates unless economic momentum rebounds from the soft first quarter, inflation heads higher, and the labor market continues to improve.
Long-term rates also depend on the Fed, but to a lesser extent. Even if the Fed decides to hold interest rates at zero for the rest of the year, long-term bond yields could still move up a meaningful amount—we estimate that another percentage point isn’t outside of the realm of possibility. The risk of rising long-term interest rates is one of the reasons we continue to favor a short-maturity bond portfolio.
Patient Investing
At Richard C. Young & Co., Ltd., patience has long been at the core of our investment philosophy. We write and talk about patience often. Like many things in investing, patience is a simple idea, but not easy for many to implement.
Far too many investors steer their investment portfolios using a rearview-mirror approach. They lose focus on their individual investment goals and objectives and instead compare their portfolio to one or more market indices (inevitably the one that has performed best recently) and the portfolios of their friends and family. They bounce from one strategy to another based on how that strategy has performed over the last quarter, year, or even five years.
It is no wonder, then, that study after study from Morningstar, Vanguard, and Dalbar, among others, show that individual investor returns fall far short of the average mutual fund return or the market return. The latest numbers from Dalbar show that for the 30-year period ending in December of 2014, the average mutual fund investor earned one-third of the return of the S&P 500—3.8% versus 11%—a truly dismal return.
Five years may seem like a long enough period to evaluate an investment strategy, but it is not. We believe investment strategies must be evaluated over a full market cycle. What is a full market cycle? It runs from bull-market peak to bull-market peak or from bear-market trough to bear-market trough. Comparing investment strategies with varying degrees of risk over anything other than a full market cycle can lead to erroneous results and portfolio-decimating decisions.
Take, by example, the five-year period ending in December of 1999. The NASDAQ Composite index, which we will use as a proxy for an aggressive investment strategy, delivered a compounded annual return of 40%. The Mergent Dividend Achievers index, which we will use as a proxy for a conservative investment strategy, rose at a 25.7% annual rate.
Based on the five-year performance numbers of the two indices, the NASDAQ looked like a superior strategy. Many investors believed as much and dumped money into NASDAQ stocks. But these investors made a crucial mistake. They failed to evaluate the performance of each strategy over a complete market cycle. In bull markets, it is often the most aggressive strategies that perform best, and in bear markets, it is the most conservative strategies that outperform.
It was no surprise, then, that over the subsequent five years, NASDAQ stocks cratered, trailing the conservative Mergent Dividend Achievers index by 15 percentage points per year. Those patient investors who remained committed to their own goals and objectives even when NASDAQ stocks were performing far better than their own portfolio ultimately achieved investment success. For the entire 10-year period from year-end 1994 to year-end 2004, the Mergent Dividend Achievers index delivered a greater return than the NASDAQ index and with much less risk.
Today, I see investors making mistakes similar to those made during the dot-com bubble. The more speculative areas of the stock market have performed best recently. Over the last three years, the NASDAQ has outperformed the conservative Mergent Dividend Achievers index by about eight percentage points per year. And once again, many investors are shifting assets from conservative strategies to aggressive strategies.
Dividend Investing: A Winning Strategy
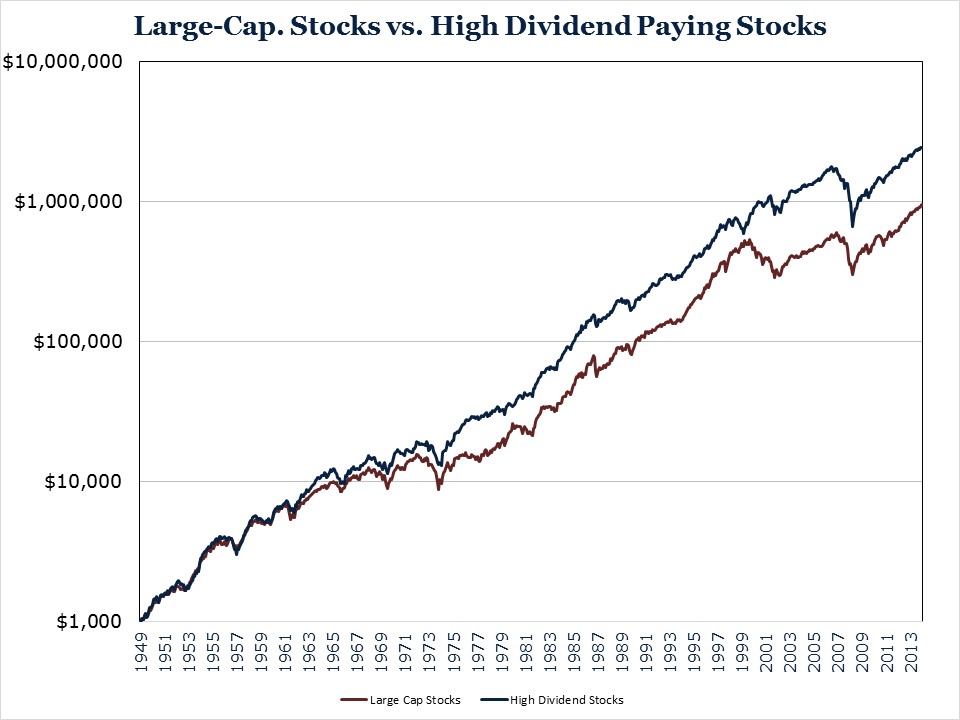
What is Richard C. Young & Co., Ltd. doing? Instead of abandoning our conservative dividend-focused strategy because it may be lagging some index or another, we are staying the course. Why? At least two reasons. First, investing in high-dividend-yielding stocks has historically been a winning investment strategy. The chart below compares the growth of $100 invested in the highest-yielding 20% of the market (rebalanced annually) to the performance of large-capitalization stocks. From year-end 1949 to year-end 2014, the dividend strategy turned $1,000 into more than $1.5 million while large-capitalization stocks turned $1,000 into $944,000.
Second, periods of lagging performance are a necessary evil in achieving exceptional long-term performance. A high-yielding strategy trails the major averages about 40% of the time. Over the last decade, high-yielding stocks have trailed the market 60% of the time. We don’t worry about these periods and advise the same for you.
The paradox is that if high-yielding stocks always outperformed, they would cease to outperform. It is the times when they fall out of favor and investors lose patience with the strategy that enable the impressive long-term performance.
Have a good month, and as always, please call us at (888) 456-5444 if your financial situation has changed of if you have questions about your investment portfolio.
Best regards,

Matthew A. Young
President and Chief Executive Officer
P.S. The April housing starts number was a surprise and a bit of an eye-opener. Previous housing starts and permits numbers had been disappointing and highlighted slowness in the new-home market. Housing starts in America totaled 1.135 million for the month of April. That’s higher than the projected analyst consensus of 1.025 million. Now the question is, with the housing industry starting to pick up the pace, will the Federal Reserve be willing or able to raise rates without ending the party? On the one hand, the Fed must raise rates someday or risk not having any ability to fight future recessions by lowering rates. On the other hand, if the Fed raises rates, housing could respond by ending the rally. The balancing act continues.
P.P.S. We recently updated both Part 2A and Part 2B of our Form ADV as part of our annual filing with the SEC. This document provides information about the qualifications and business practices of Richard C. Young & Co., Ltd. If you would like a free copy of the updated document, please contact us at (401) 849-2137 or cstack@younginvestments.com. There have been no material changes since the document was last updated on March 24, 2014.
P.P.P.S. There are several reasons why we favor Switzerland as an investment destination. As my dad recently outlined, there are many reasons why the Swiss have such a competitive economy:
Almost every index of national freedom puts Switzerland at or near the top, with my favored Economic Freedom of the World from Cato Institute ranking Switzerland fourth out of 152 countries. Switzerland scored particularly well for its sound money, low regulation, and strong legal system and property rights. Switzerland also has a low effective corporate tax of only 17.92% (with some local statutory rates as low as 11.48%). When compared to major competitors Germany, the U.K., France and Italy, Switzerland has the lowest corporate rate, lowest individual income tax rate, and the lowest employer contribution to social security. That makes Switzerland a prime location for multinational corporations looking for a low tax place to headquarter. It has also helped Switzerland’s domestic corporations grow to compete internationally.