Global Diversification
January 2015 Client Letter
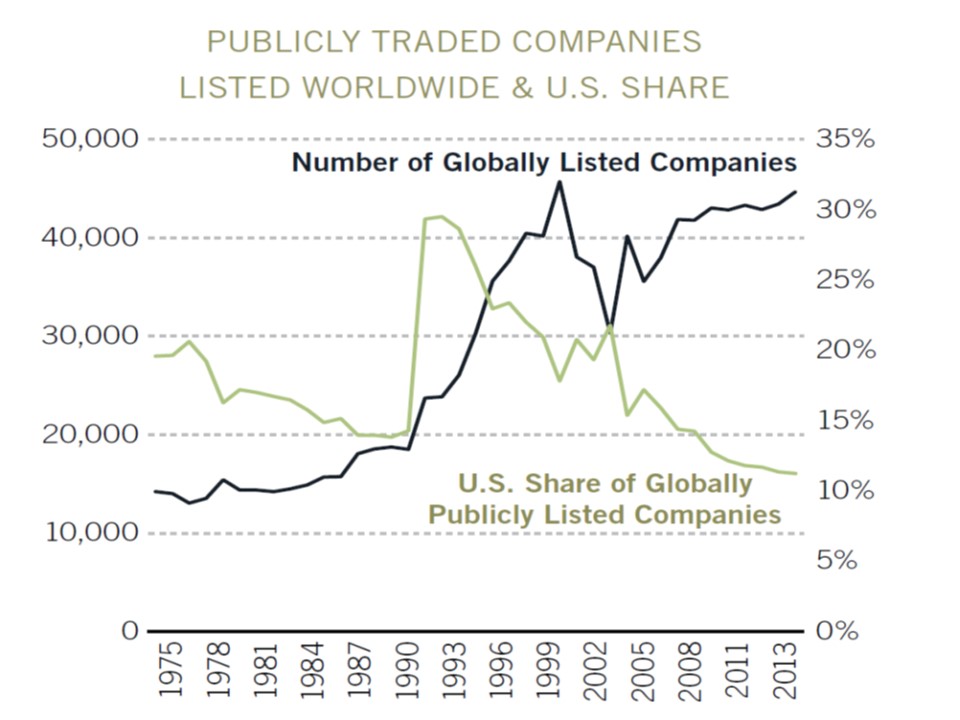
The global economy is much more interconnected than it was only a couple of decades ago. Global trade, as measured by the sum of exports and imports, is now 60% of world GDP compared to 40% in 1990 and 26% in 1960. A majority of the world’s investment opportunities now reside outside of the United States. The chart below from Fidelity Investments shows the number of globally listed companies and the share of globally listed companies. Over the last 25 years, the number of globally listed companies has more than doubled to 40,000, while the U.S. share of globally listed companies has plunged to about 10%.
In 2014, large-capitalization U.S. stocks were the standout performer on the global stage. The S&P 500 was up 13.7% last year. Smaller capitalization U.S. stocks, as measured by the Russell 2000 Index, were up 4.9%. Outside the U.S., stocks were down. The popular MSCI EAFE Index (Europe, Australasia, and Far East) was down 4.2% in 2014, while the MSCI Emerging Markets Index dropped 3.92%. Looking at the Vanguard Total World Stock Index Fund, which includes U.S. and developed and emerging foreign markets, global stocks were up about 3.92% last year.
With foreign markets lagging U.S. markets last year, and over the last couple of years, some investors are questioning the need for global diversification. Diversification by its nature cuts off the extreme returns on both the upside and downside. This middle-of-the-road approach reduces volatility and helps many investors stay the course during more troubling periods.
A global approach was especially useful in the years following the dotcom bust. How useful? From year-end 1999 to year-end 2007, the MSCI EAFE Index earned 58% compared to 14% for the S&P 500.
Last Year’s Bond Market
Despite projections for interest rates to rise from an overwhelming majority of analysts, long-term rates declined significantly in 2014. The 10-year Treasury note yield fell to 2.17% from over 3% at year-end 2013. Short-term rates moved in the opposite direction. The 2-year Treasury note yield increased to .66% from .38% in January 2014. Short-term interest rates rose as the Federal Reserve signaled the first Fed funds rate hike in almost nine years was nearing.
The drop in long-term interest rates was a boon for our favored Vanguard GNMA Fund, which gained 6.8% last year. Falling long-term rates also helped our clients’ positions in long-term Treasury inflation protected securities (TIPS) and in closed-end municipal bond fund positions we initiated during the so-called “taper tantrum” in the summer of 2013. Both were up double digits last year. We exited the TIPS position mid-year last year, but held the muni positions for the duration of the year.
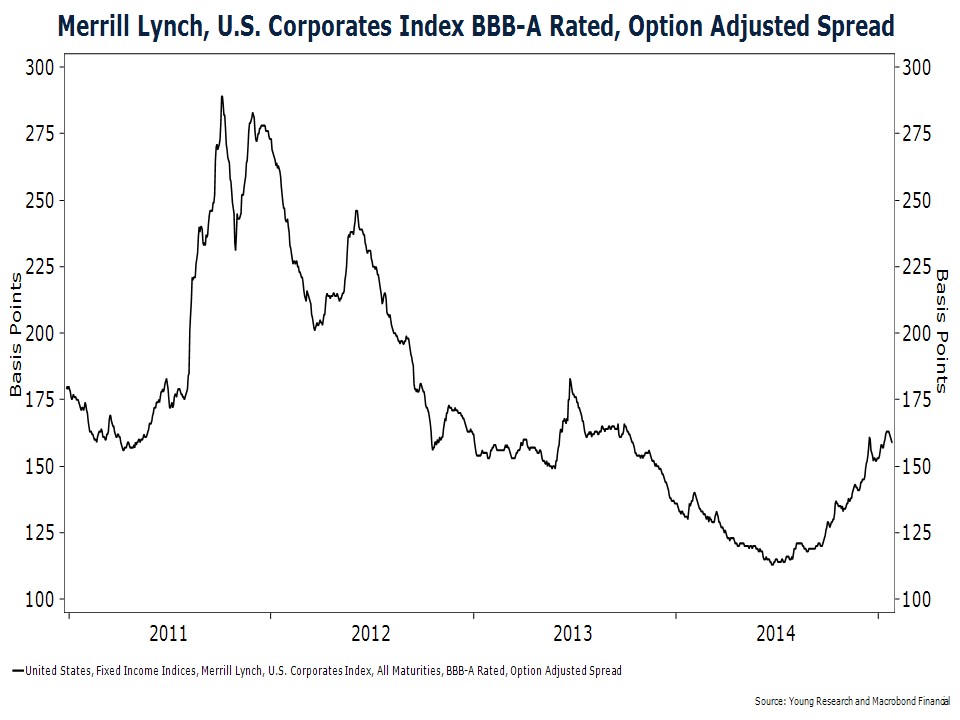
The other notable trend we saw in the bond market toward the end of 2014 was an increase in credit spreads. The credit spread on a bond is simply the additional yield, above the yield on risk-free Treasury securities that investors demand for bearing credit risk. The lower the spread, the lower the margin of safety on a bond.
Heading into 2014, spreads were at historically low levels. As a result, during 2014 we began building a position in short-term Treasuries. We did not feel our clients were being adequately compensated for the credit risk in corporate bonds. Our strategy was to build a Treasury position over time, until and unless spreads moved back to levels that offered adequate compensation for risk.
As the chart below indicates, spreads moved significantly higher in the fourth quarter of last year.
As we head into 2015 we are seeing long-term treasury yields continue their decent. The persistent decline in long-term U.S. interest rates in the face of both an economy that is gaining momentum and a Federal Reserve that is planning to hike rates later in the year is out of character.
It would appear that falling yields globally are pressuring U.S. rates lower. While interest rates in the U.S. are at some of the lowest levels in U.S. history, rates in Germany, Japan, and Switzerland, to name a few, are even lower. As of this writing, the yield on 5-year German bonds is minus 0.05%. Investors are actually paying the German government for the privilege of lending them money.
With yields falling on Treasury securities and spreads widening, the more compelling opportunities are now in the corporate bond market, in our view. Much of the volatility in corporate bonds in the fourth quarter was centered in the energy sector, so that is where we have been looking for opportunities. We are focused on acquiring bonds of energy companies with solid financial positions or valuable collateral that helps minimize risk to principal in the event of default.
The Energy Markets
Oil prices have come down sharply over the last six months. The combination of tepid global demand and a significant increase in supply from the North American shale boom has created an oversupply of oil. The losses in oil accelerated following an OPEC decision in late November to maintain production at current levels.
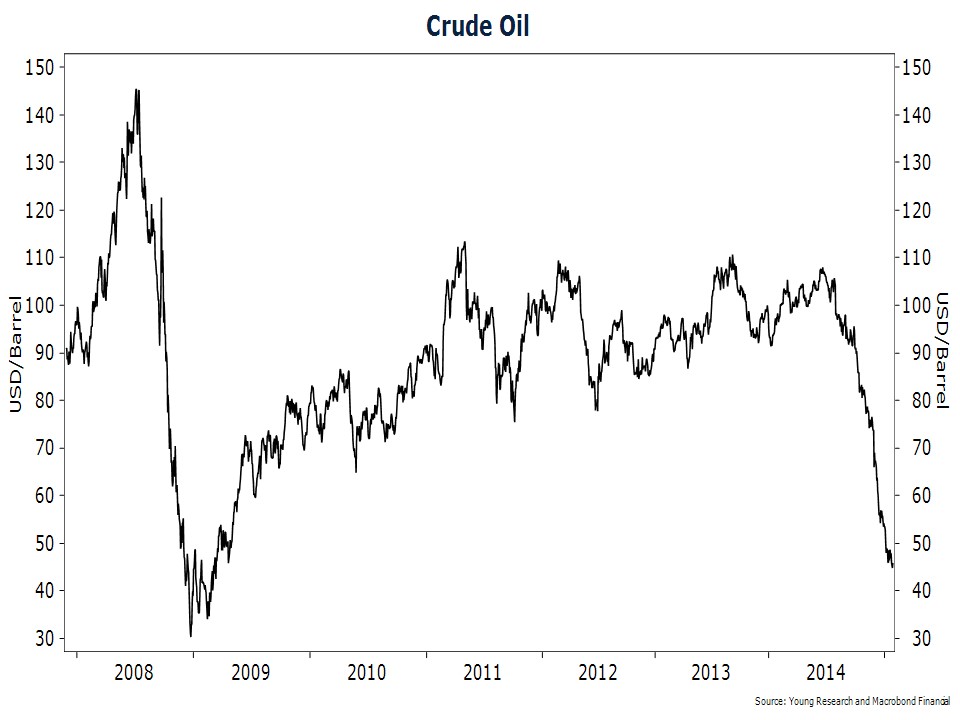
The sharp drop in oil prices over a short period of time has taken a toll on oil and gas producers. The S&P 1500 Oil & Gas Exploration and Production Index is down 33% from its high last year. The bonds of energy producers are also selling off.
For the U.S. economy, in the short run, lower oil prices should be a net benefit. Lower oil prices act like a tax-cut for consumers, boosting discretionary income. Low- and middle-income consumers who spend the greatest share of their income on energy should benefit the most.
The longer-run implications of plunging oil prices are less certain. It is true that the U.S. is still a net importer of oil, but we import a lot less oil than we did 10 years ago. So the historic response of the economy to lower oil prices might not be how the economy responds this time. It is also true that the shale boom in the U.S. has been a big driver of growth and investment during the recovery. If oil prices stay at current levels, investment in the oil and gas sector can be expected to fall significantly. Incomes in the oil and gas sector are also going to take a hit from lower oil prices.
Energy Securities
To navigate the current downturn in the energy sector, we are currently focused on lower-cost integrated energy companies with strong balance sheets and the ability to weather a prolonged downturn in oil prices. We do hold some higher-cost producers in the oil and gas space. One such company, Canadian Oil Sands, has fallen sharply with oil prices. The dividend has been reduced and, if prices were to stay below $50 per bbl indefinitely, Canadian Oil Sands would suffer. However, if oil prices move back toward the marginal cost of production (the cost to produce the last barrel of oil consumed), Canadian Oil Sands has decades of profitable production ahead of it.
Deflation
There is a lot of confusion on deflation. Policymakers are partly to blame for this. Deflation is not a universal bad. In fact, deflation was a regular part of the economic landscape until the Federal Reserve came onto the scene in 1913.
Deflation means falling prices. What is bad about falling prices? Deflation raises the purchasing power of a dollar, which, of course, raises living standards.
Policymakers believe deflation cannot be allowed to take hold; because once prices start to fall, consumers delay purchases in anticipation of falling prices, which leads to lower prices and then lower incomes and so on and so forth until what, we are not told. But there is no evidence for such behavior outside of the debt deflations (a different animal) during the Great Depression and Japan’s bust in the 1990s.
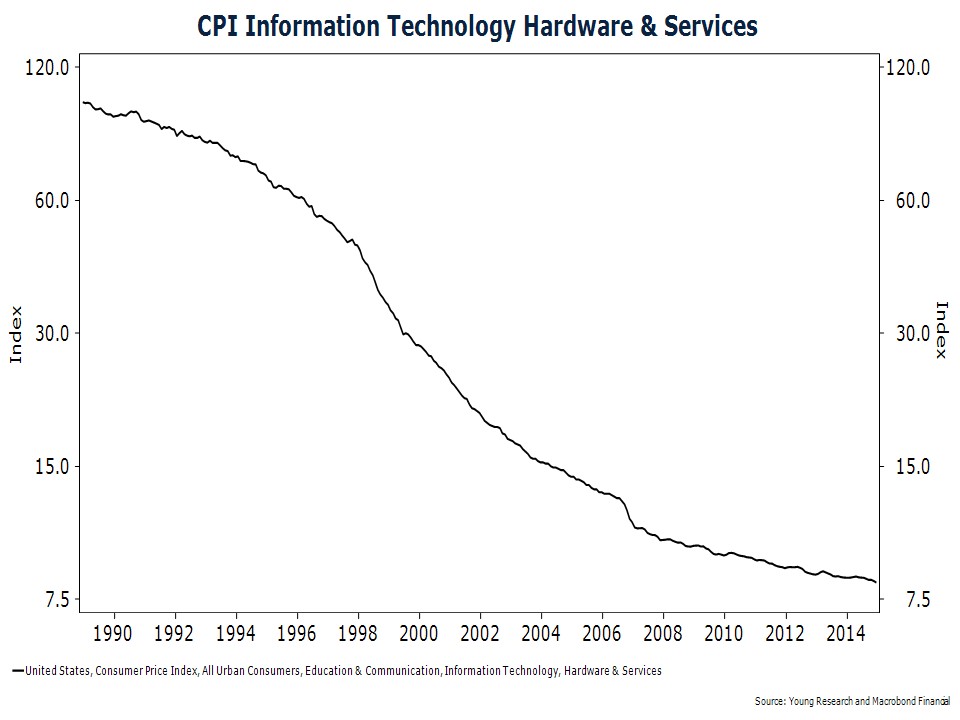
In fact, there is more convincing evidence to the contrary. The U.S. information technology sector has experienced persistent deflation for the least 25 years, which hasn’t stopped consumers from purchasing technology goods (chart). Technology is arguably the most dynamic sector of the U.S. economy.
Deflation is also a positive for savers, and it makes today’s low bond-yields more attractive than they might appear to be on the surface. A 2% yield with 2% deflation provides the same inflation-adjusted returns as a 6% yield with 2% inflation.
Is It Time To Become More Aggressive?
The more speculative sectors of the market have indeed performed well in recent years, but this is often the case in the mature stages of a bull market. After years of gains, complacency tends to set in and investors throw caution to the wind. But assets that rise quickly can fall just as fast. A longer-term view provides some much-needed perspective.
Take a look at the growth of $100 invested in the NASDAQ Composite index, the Merrill Lynch Corporate bond index, and a T-bill index for the 15-year period ending in 2014. During this period, the NASDAQ returned only 38%, lagging even T-bills while boring old bonds have more than doubled investors’ money.
Outlook for International Markets
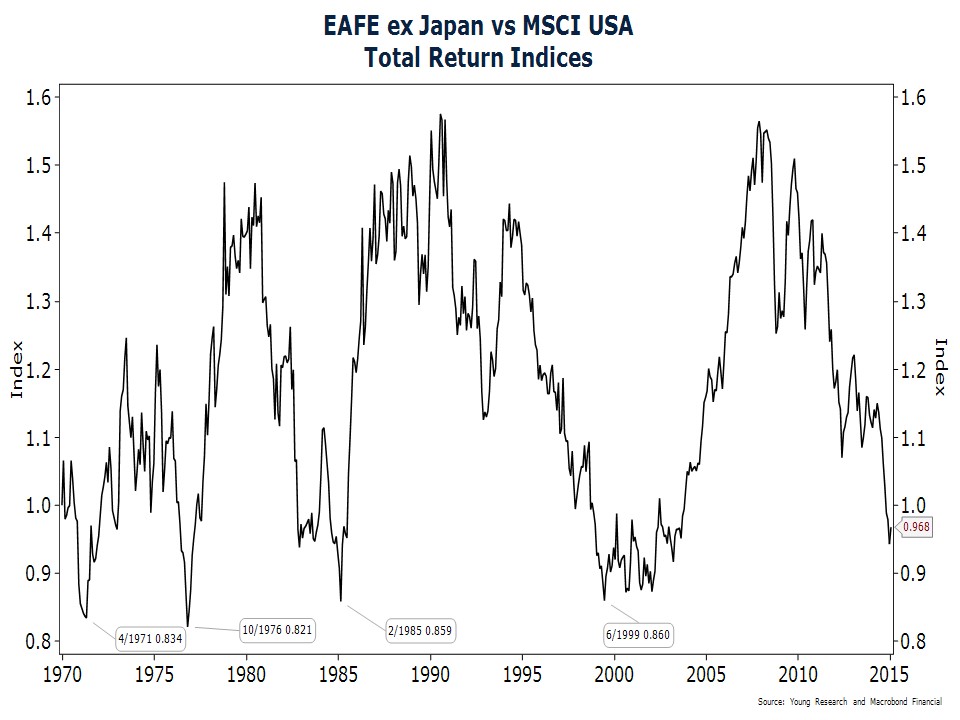
For long-term investment, we believe foreign stocks offer compelling relative appeal at today’s levels. The chart below shows the relative performance of the MSCI EAFE index, excluding Japan, compared to the U.S. stock market. We exclude Japan here because the country’s bubble and bust greatly distorted the index. The performance of foreign stocks and U.S. stocks tend to move in long up and down cycles. At current levels, foreign stocks may still have some limited downside versus U.S. stocks; but, based on the chart, the upside is many times greater than the downside.
Regardless of whether a security is domestic or international, dividends and interest remain the heart of our investment strategy. Over time, dividends and the reinvestment of dividends make up most of the return on stocks. The percentage of return coming from dividends varies by period. Since year-end 1999, dividends have accounted for about 54% of the return on the S&P 500.
When seeking out equities for purchase, we favor stocks with a long record of paying dividends, a history of consistent dividend increases, and above-average dividend yields. We also like companies with strong financial positions, which might mean low levels of debt, high levels of cash flow relative to debt, or readily available access to capital markets. Companies that operate in industries with high barriers to entry or companies with sustainable competitive advantages are also businesses we find attractive.
Have a good month. As always, please call us at (888) 456-5444 if your financial situation has changed or if you have questions about your investment portfolio.
Best regards,

Matthew A. Young
President and Chief Executive Officer
P.S. Early January surprises. The Swiss National Bank (SNB) greatly surprised financial markets in mid-January by ending a three-year-old cap on the franc. The SNB U-turn sent the franc soaring 30% against the euro and about 15% against the U.S. dollar. Six days later, Canada’s central bank delivered a surprise interest rate cut, its first since the recession. All 12 primary dealers of Canadian government securities had predicted rates would hold steady. Expect more currency and central bank surprises like these in the coming years. In my view, a currency crisis is a leading candidate to trigger a black swan event.
P.P.S. Here are some thoughts on copper from Jeremy Jones, CFA Chief Investment Officer at Richard C. Young & Co., Ltd.:
Copper is said to have a Ph.D. in economics because it has been one of the most reliable real-time barometers of the economy. With much of the world’s demand growth coming from outside the U.S., it might be more appropriate to say copper has a Ph.D. in global economics.
What does copper and the global economy have to do with oil? Well, the narrative in the financial press is that the collapse in oil prices is a supply story. The explanation I read most often is that the Saudis are in a battle for market share with U.S. shale producers (as if this makes any sense—topic for another day, though). An excess of oil supply may be part of the reason for the slide in oil prices, but if Ph.D. copper can be trusted, there is also a demand component here. Copper prices are trading at a more-than-four-year low. There is no OPEC market share battle going on for copper, so why are prices falling? And not just copper prices are sliding; iron ore, aluminum, nickel, steel, and even rubber are all trending down.
Could it be that the slide in oil and copper prices is a result of falling demand as much as rising supply?
P.P.P.S. And Steve Forbes in the January 19, 2015, issue of Forbes:
“The world situation is a mess. Japan, Brazil, southern Europe and France are in recession. Germany’s economy is stalled. China is up to its neck in bad loans from its superstimulus spending binge following the 2008–09 financial crisis. The U.S. is growing at a 3% rate that looks good only in comparison with everyone else. Remember, we’re in the sixth year of a recovery; never before in our history has there been such a punk recovery from a sharp economic downturn. Median incomes are still lower than they were before the crisis. The rate of labor-force participation remains awful. Moreover, as the rest of the world contracts, our economy will be hurt.”