Interventionist Fed Policy
April 2012 Client Letter
What should stock market investors expect for the rest of the year? While we cannot predict the future, we continue to see a generally pleasing environment for stocks in 2012. Ultra-low interest rates on treasury bonds offer little competition for stocks, which have the powerful tailwind of election-year fiscal and monetary stimulus working in their favor.
On the surface, a favorable near-term outlook for the stock market may give the impression that things are fine, but a look beneath the surface reveals serious risks.
The interventionist Fed has created a distorted illusion of prosperity. As the Federal Reserve authorities rap on about QE1, QE2, et al., investors intuitively know something isn’t right about perpetual money printing. But it’s hard to believe, as rampant speculation in the stock market continues to expand. The bad stuff in the stock market is going up, and the good stuff is going down, or simply wallowing. To get any type of yield today, investors are being forced into longer-term, more price-sensitive bonds or into the foulest sectors of the stock market. It is an environment we have seen before and one that rarely ends well.
And although employment appears to be in a strong groove, unseasonably warm weather may have fueled much of the recent momentum. This winter was the fourth warmest since records began in 1895. Construction crews were out early and consumers hit the malls more frequently this winter.
During the employment deflation of 2008 and 2009, non-farm payrolls were shrinking by as much as 0.3%, 0.4%, 0.5%, and 0.6% per month. In just late 2008 and the first three quarters of 2009, over seven million jobs went down the tubes. Since the so-called economic rebound began, there has not been a single monthly employment uptick of 0.5% or 0.6%. Not one! In fact, there hasn’t been a 0.3% monthly uptick.
The best monthly uptick in this pseudo economic rebound came back in May 2010 with one lonely 0.4% aberration, which was quickly neutralized with a downtick the very next month. The net-net here is a gain of 3.4 million jobs over the last two years versus a loss of 7.5 million jobs in the prior period outlined above. There have been only half as many job gains in today’s period of supposed economic strength as those lost at the end of the financial meltdown.
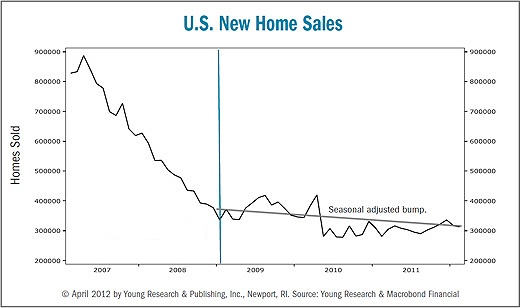
A bona fide sound economic recovery is underpinned by a non-interventionist Fed; a tax-cutting, budget-balancing administration; and associated strong gains in both the housing and employment sectors. Despite white-hot money creation, we have the most modest employment gains. And housing? Did you know that the gap between the median price for new homes and “old” homes is a whopping $76,000, and that difference is up a staggering 57% from 2010? The main culprit, of course, is a monster backlog of cheap, foreclosed old homes. Americans are simply packing up, putting the key in the door, and splitting, leaving banks around the country to choke on piles of upside-down mortgages. Check out the depressing downside momentum in our new home sales chart.
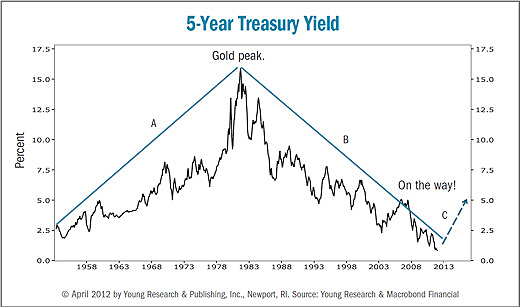
The end of the three-decade secular decline in interest rates also poses risk to investors. Our chart shows that, over the last five decades, there have been two secular swings in interest rates. Just two. Number three is likely on the way. Can you guess the direction? It’s a little hard to have a secular downswing off a zero base, is it not? The reality for interest rates may be a nasty stair-step run-up. A big increase in interest rates won’t have a positive impact on bond prices, home values, the economy, or the stock market. Investors not preparing for such an outcome could be making a costly mistake.
To navigate through the current environment successfully, we invest with a balanced approach. Our investment strategy is similar to the strategies used by two of our long-favored Vanguard Mutual Funds—Wellesley Income and Wellington. We don’t currently own the Wellington Fund; but it is the older of Vanguard’s two balanced funds, so it offers a greater perspective on the performance of a balanced strategy.
With a history that dates back to 1929, the Wellington Fund is one of the nation’s oldest and most successful mutual funds. Wellington has successfully navigated through eight decades of financial market turbulence, including the Great Depression, the stagflationary 1970s, and the more recent credit crisis. We attribute much of the fund’s investment success to its balanced portfolio. Wellington invests about 60% of its assets in mostly dividend-paying stocks and the remaining 40% in investment-grade bonds.
A balanced strategy reduces short-term volatility and tends to hold up better than a single asset-class portfolio in a wider variety of financial and economic climates. By example, since year-end 1999, the average annual return on the S&P 500 has been about 0.55% compared to 6.33% for Wellington. And from year-end 1972 through 1981, a tough period for bonds, Vanguard Wellington earned an average annual return of 4.61% compared to a 2.6% gain on Treasuries and a 5.2% gain on stocks.
Wellington will rarely be the best-performing fund in any given investment environment, but it will keep you in the game and allow the power of compound interest to work for you. From its 1929 inception, the Wellington fund has delivered a compound annual return of 8.18%—enough to turn a $5,000 initial investment into $3.4 million.
Though there are similarities between our investment strategy and the strategies pursued by the Vanguard Wellington and Wellesley funds, there are also important differences. Vanguard Wellesley and Wellington are both multi-billion-dollar mutual funds with strict investment mandates. On the stock side of the ledger, both funds are limited to large-capitalization U.S. stocks. And on the bond side of the portfolio, Wellesley and Wellington invest in intermediate-term investment-grade bonds.
We don’t limit our investment universe to U.S. stocks and medium-term investment-grade bonds. We invest where we see opportunities. We currently own both large-cap and small-cap stocks that are domiciled around the globe. We own shares in Brazilian utilities, Canadian oil companies, Swedish household products firms, and British tobacco companies. And if we find opportunities in other parts of the world, we are free to pursue them.
In bonds we place no restrictions on the maturity or credit ratings of the firms we can buy for you. We buy what we find most attractive for the current environment. Today we favor a mix of short-term corporate bonds, floating-rate loans, high-yield bonds, GNMA securities, and short-term Treasuries. But when the interest-rate cycle turns, and someday it will, we most likely will favor a different mix of fixed-income securities.
We also think it is crucial for investors to diversify beyond stocks and bonds. We invest in precious metals, foreign currencies, and natural resources. All three asset classes provide an additional layer of diversification to a portfolio of stocks and bonds. And in an inflationary environment, where both stocks and bonds tend to perform poorly, an allocation to hard assets and hard currencies helps offset the corrosive effect of inflation.
Have a good month, and as always, please call us at (888) 456-5444 if your financial situation has changed or if you have questions about your investment portfolio.
Sincerely,

Matthew A. Young
President and Chief Executive Officer
P.S. We recently initiated a position in iShares Silver Trust. The iShares fund owns physical silver. Relative to gold, silver appears cheap. The higher the gold/silver ratio, the cheaper silver is. The historical gold/silver ratio has been about 15:1; today it is 53:1. Central banks do not own silver, which they could dump on the world market to depress prices. This is a big plus for silver. Silver trades at about $31/oz. We estimate that the structural low is about $10/oz. There conceivably is a significant downside risk. Our strategy is to slowly build a position in silver over the next few years, with the intention of buying at an average price well below $31/oz. We view silver and gold as insurance policies that we hope will never be needed.
P.P.S. “There’s now a healthy notion that people should be getting income from the stock market. Until the early 1980s, the U.S. stock market was an investment platform for which you were paid in cash. Over the past couple of decades it’s come off of that. But before that, older people remember buying stocks for their dividends. Now they’re doing that again, for the first time probably in three decades, and some ask if that’s a new paradigm. Well, it’s not a new paradigm. It’s actually a very old paradigm. It’s the original paradigm.” —Daniel Peris, Federated Investors.
P.P.P.S. Since 1989, Richard C. Young & Co., Ltd. has emphasized income-producing securities. In 2003, we developed our Retirement Compounders (RCs) program in response to an overall low-yield environment for both stocks and bonds. The RCs is a portfolio of 32 dividend- and income-paying equity securities. The globally diversified portfolio features familiar domestic names, including Kimberly Clark and Procter & Gamble, and lesser-known international companies, such as Canadian Oil Sands, Companhia Energetica de Minas Gerais (CEMIG), and Statoil. The yield on the RC portfolio is currently 4.8%.
P.P.P.P.S. Investors concerned with maximizing yield—or total return, for that matter—benefit by keeping an eye on expenses. Higher expenses eat into a portfolio’s cash flow. We charge less than 1% annually to manage globally diversified custom portfolios. On the fund front, we do not invest in 12b-1 mutual funds, but we instead emphasize lower-expense Vanguard funds and exchange-traded funds.