Quality and Dividends
August 2014 Client Letter
Quality and dividends. If I had to describe our equity strategy in as few words as possible, that would probably do it. This is good news for most clients who are retired or soon to be retired. The strategy is easy to understand and provides a degree of comfort in today’s uncertain global economy. There is nothing more overwhelming than having one’s nest egg tied to an investment strategy that requires a long, confusing explanation, and nothing more underwhelming than a strategy that’s too generic, diversified across too many stock and country sectors.
Longtime favored stock Johnson & Johnson (JNJ) fits our quality and dividends requirements nicely. JNJ is generally thought of as a stodgy company. But there’s nothing boring about its stable of popular brands, including Band-Aid, Tylenol, and Splenda. Nor is there anything boring about its dividend payout dating back to 1944. For investors, the consistency of an annual dividend check is reassuring, especially during periods of market volatility.
Investors can take comfort in JNJ’s rock-solid AAA credit rating, $32 billion in cash reserves, and $17 billion generated annually in operating cash flow. JNJ’s other brands include Bengay, Rogaine, Neutrogena, Listerine, and Sudafed, make the company a branded consumer products powerhouse.
Vanguard Healthcare ETF
For additional exposure to the health-care industry, we purchase Vanguard Health Care ETF (VHT). VHT owns 312 stocks spread across the health-care industry, with its largest holdings in pharmaceuticals, biotechnology, health-care equipment, and managed health care. Its 10 largest holdings make up 45% of the fund and are mostly drug companies. In the past, we have steered away from drug companies. We feel the discovery process for new drugs is too risky in most cases to bet on just one company. By owning the Vanguard Health Care ETF, we reduce the “discovery risk” by owning a broad group of drug names.
JNJ and the health-care industry in general are set to benefit from an enormous demographic tailwind. The percentage of Americans over 65 will jump from 13% to 19% in just 20 years and will hit 20% by 2040. The combination of aging baby boomers and low birth rates is pushing the percentage of elderly people up to record levels. In 2010, the over-65 crowd generated 34% of health-care spending while only representing 13% of the population. They spent three times more than the average working-age person on health care.
In particular, older Americans are spending more on prescription drugs. According to the latest data from the National Center for Health Statistics (released in 2010), in 2008, 88% of Americans over age 60 were using prescription drugs, and 37% of Americans 60 and over were using five or more prescription drugs on a regular basis. Drug use is also up across the general population. According to a 2013 Mayo Clinic study, “Nearly 70 percent of Americans are on at least one prescription drug, and more than half take two.” That’s a lot of drug use.
Looking ahead, health-care spending is projected to increase to $5 trillion, or 20% of GDP, by 2022. That means health care will play an increasingly large role in America’s economy, and investors will not want to ignore an industry representing one-fifth of the economy.
So it appears the health-care industry has decent momentum behind it. But what about the rest of the U.S. economy? As things stand today, the economy seems to be in OK shape based on the following economic indicators.
How to Use the Leading Economic Indicators
First off is the Leading Economic Index (LEI). The components of the LEI are released monthly by the Conference Board. The Conference Board, founded in 1916, is an independent business membership and research association. The LEI comprises 10 components, including average weekly hours, manufacturing; average weekly initial claims for unemployment insurance; manufacturers’ new orders, consumer goods and materials; ISM Index of new orders; manufacturers’ new orders, nondefense capital goods, excluding aircraft orders; building permits, new private housing units; stock prices, an index of 500 common stocks; Leading Credit Index; interest rate spread, 10-year Treasury bonds less federal funds; and average consumer expectations for business conditions.
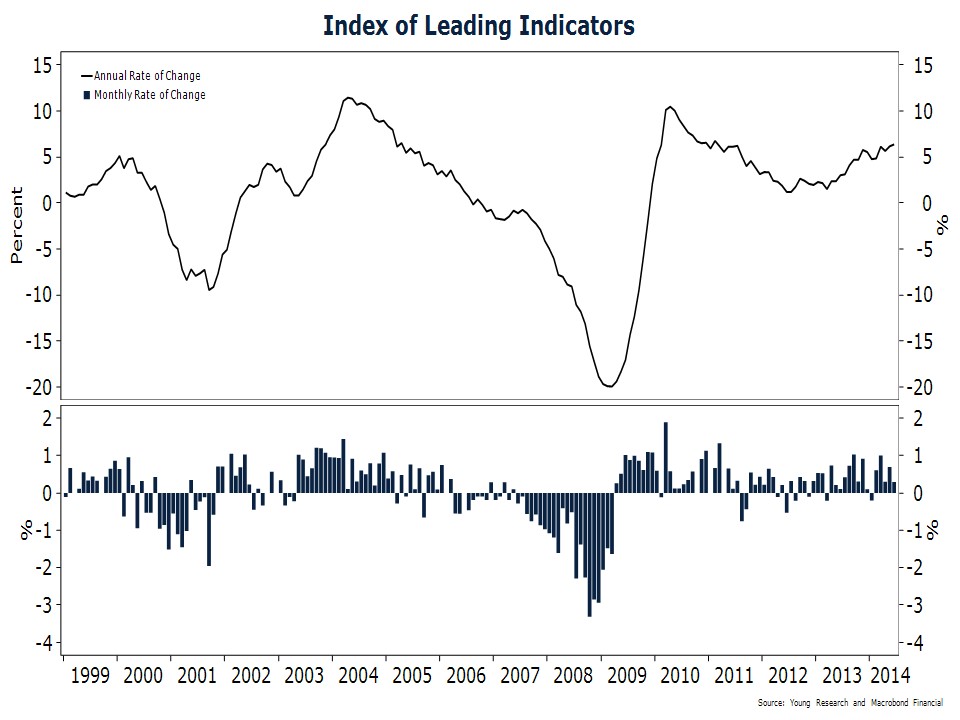
In a press release from July 18, 2014, the Conference Board noted, “Broad-based increases in the LEI over the last six months signal an economy that is expanding in the near term and may even somewhat accelerate in the second half. Housing permits, the weakest indicator during this period, reflects some risk to this improving outlook. But favorable financial conditions, generally positive trends in the labor markets and the outlook for new orders in manufacturing have offset the housing market weakness over the past six months.”
The LEI is useful in helping forecast the ups and downs in the business cycle. As can be seen in our chart, the leaders today are showing decent momentum.
Next is the Coincident Economic Index (CEI). Also published by the Conference Board, the CEI offers a glimpse into whether the economy is expanding or contracting and at what pace. The components include employees on nonagricultural payrolls, personal income less transfer payments, industrial production, and manufacturing and trade sales.
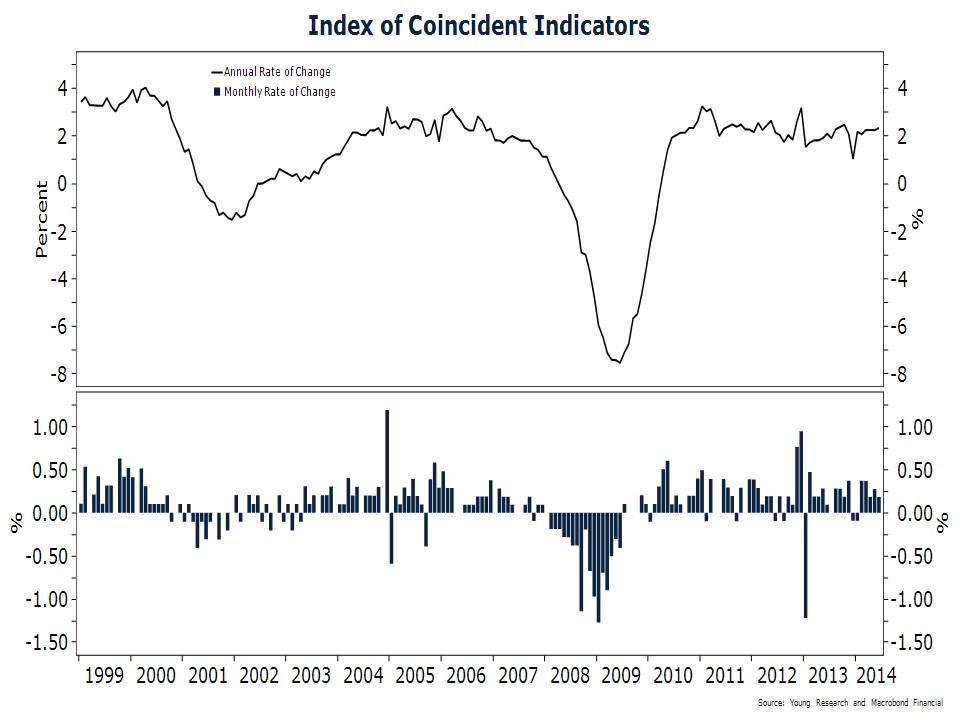
Today, the coincidents look fine.
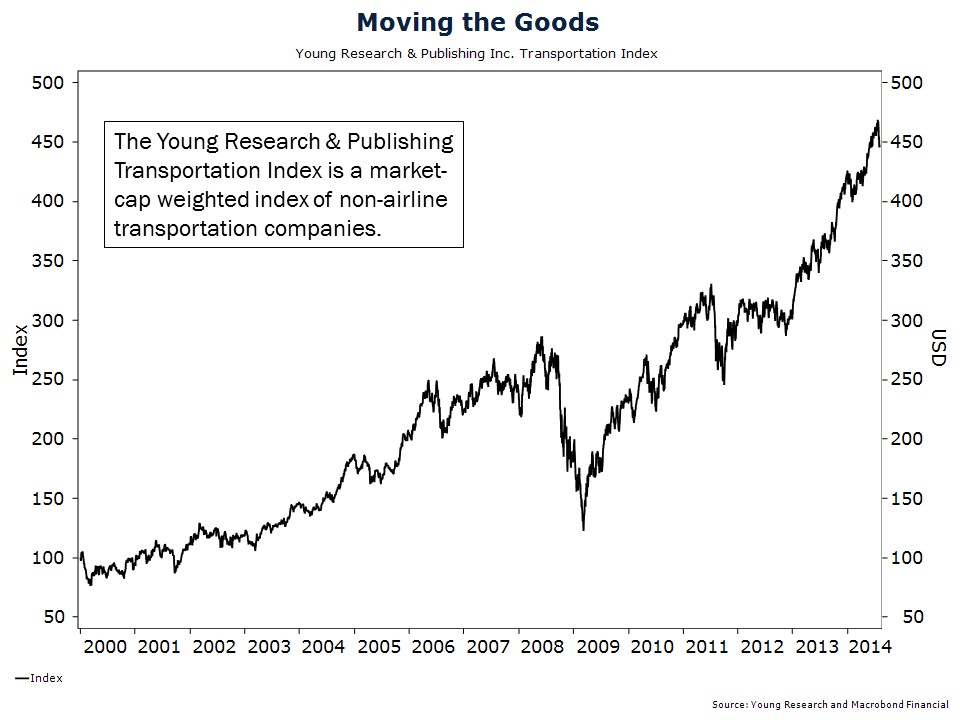
Finally, Young Research & Publishing’s Transportation Index is a market-cap-weighted index of non-airline transportation companies. The idea is if transportation companies—for example, truck, rail, and shipping—are doing well, then shipping volume must be reasonably high, indicating a good economy.
So today, the economy is not in terrible shape. And we are currently on track for a sixth straight year of positive stock returns. Of course, much of the fuel for the stock-market gains and the positive economic growth is a result of the Federal Reserve’s quantitative easing.
Since its inception in 2009, quantitative easing (QE) has been a major driver of asset price appreciation. Stocks have more than doubled since QE began, and the amount of cash on corporate balance sheets has risen dramatically.
The question many have is how the end of the Fed’s current policy will affect the markets. There are no examples from any time in history to use as a gauge for what may happen or how markets will react to QE’s eventual end. While inflation and currency devaluation are cited as potential serious side-effects, we are unsure of the scope of the long-term results.
Due to the high degree of uncertainty moving forward, many clients take comfort from our strategy of pursuing quality and dividends. As I have stated in the past, while an annual dividend is important, we also seek companies that implement annual dividend increases. And that brings us back to our favored JNJ: as of spring of 2014, the company has increased its dividend every year for the last 51 years.
Have a good month, and as always, please call us at (888) 456-5444 if your financial situation has changed or if you have questions about your investment portfolio.
Best regards,

Matthew A. Young
President and Chief Executive Officer
P.S. Some words of wisdom from Steve Forbes, in a Forbes article from August 22, 2014:
No country can become a true global economic power without having a sound and stable currency. Britain, for example, was a second-tier country until it fixed the pound to gold in the early 1700s, when Isaac Newton was Master of the Mint. Germany and Japan didn’t escape the devastation of World War II and rocket to economic prominence until each, in effect, tied its money to gold in the late 1940s. China’s surge was helped enormously in the mid-1990s, when it tied the yuan to the U.S. dollar, as Hong Kong did in 1983.
India has been bedevilled by inflation from its chronically weak rupee, as it labors under the Keynesian delusion that excessive money printing helps growth. It does the opposite. It hurts capital formation. It creates high interest rates, which in turn harm investment. It breeds crony capitalism. A money system is based on trust. Debasing a currency debases society, and inflation undermines social cohesion and social trust.
P.P.S. A Paine Webber broker facetiously told me in the 1990s, “We all hate Jack Bogle.” The founder of the Vanguard group single-handedly disrupted the fee structure in the investment industry. Primarily due to Jack Bogle, investors now have many low-cost options available when selecting stock and bond funds. Despite the broad array of low-cost mutual funds and exchange-traded funds, it surprises me to find investors owning funds with 12b-1 fees and either front- or back-end loads. High expense ratios and loads are especially damaging to returns within the bond-fund universe.
P.P.P.S. In mid-March, the NASDAQ briefly breached its level at March 31, 2000. But depending on an investor’s mix of tech stocks, the gains may offer little comfort. Since the NASDAQ’s peak on March 10, 2000, the Nasdaq-100 which tracks the index’s 100 biggest companies, is down double digits. And several companies, including Cisco, Yahoo, and Applied Materials, are still down at least 50% from their peak.