Destruction of Wealth
September 2018 Client Letter
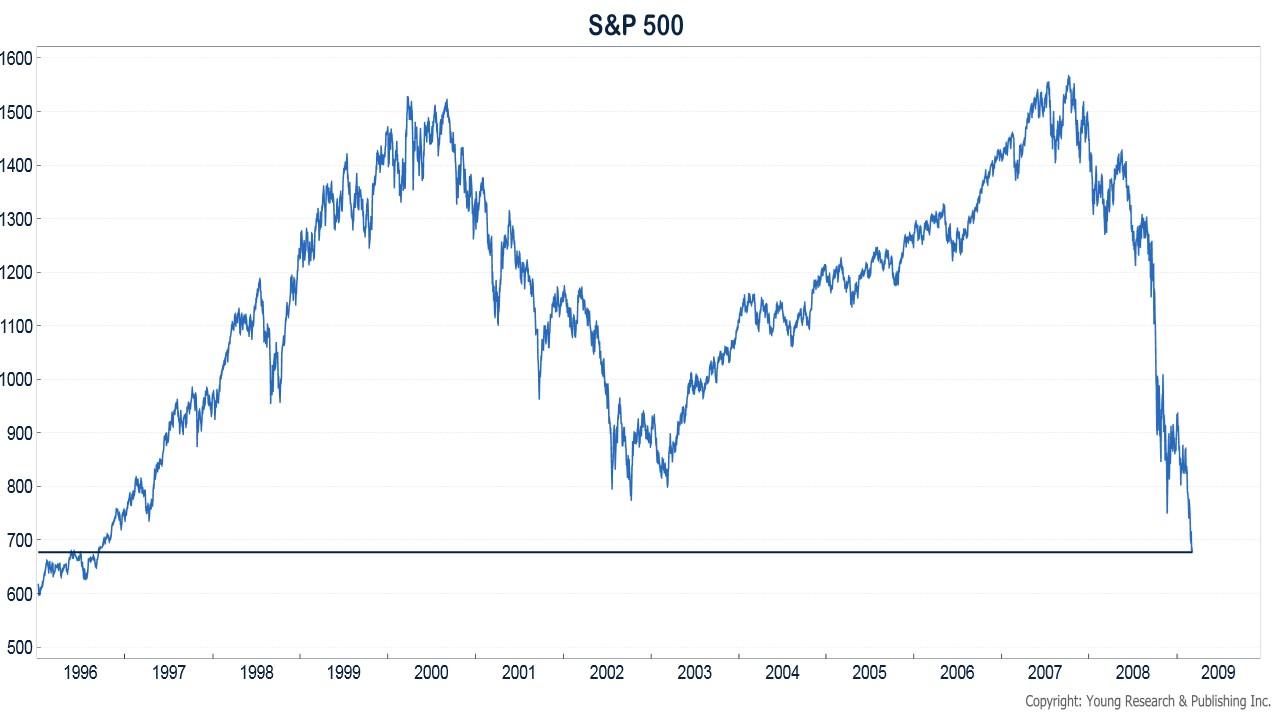
The 2008/2009 global financial crisis destroyed almost $12 trillion of America’s net wealth. Measured globally, the figure was much larger. Many households and businesses saw their net worth cut in half, or worse. Wealth that had been accumulated over years of diligent saving and investment was annihilated in a matter of months.
The S&P 500 fell over 56% from its high in October 2007 to its low in March 2009, but most of those losses came in the final six months of the crash. At its March 2009 low, the S&P 500 had wiped out its gains of the prior 13 years.
What followed was the deepest economic recession since the Great Depression. Unemployment soared, residential and commercial real estate prices collapsed, bankruptcies rose, and home foreclosures shot through the roof. Most Americans had never experienced such a scary environment.
Recessions that stem from financial crises tend to be the deepest and last the longest. The Great Depression lasted for over a decade, Japan is still feeling the effects of its real-estate and stock-market collapse almost three decades later, and it took years for the U.S. economy to recover from the ‘08/’09 market crash.
Financial crises aren’t the only events that can destroy wealth. The dotcom bust, which was associated with a mild recession, devastated the savings of many investors who were hypnotized by the drum beat of positive media over new economy stocks. The relatively benign impact of the dotcom bust on the economy was partly due to the fact technology shares were not owned as widely as homes, and there was much less leverage associated with tech stocks.
It is also true that, while the tech-heavy Nasdaq plummeted 78% in the dotcom bust, not all stocks fared so poorly. The Russell 2000 Value index of small companies was up 20% in 2000 and 11% in 2001, while the Nasdaq was down 39% and 21% in those years.
The biggest losers of the dotcom bust were investors who allowed their portfolios to become overly concentrated in Nasdaq-type stocks. Little thought was given to diversification and portfolio construction by this crowd. While few escaped unscathed from the dotcom bust, investors who properly diversified their portfolios across sectors and styles, and included bonds, fared much better.
Risk Management is Paramount
In investing, diversification is a central tenet of risk management. Over the years, my dad has written often about risk management. In 1997, he explained the importance of risk management to readers:
When the difference between life and death can be counted in milliseconds, you need every advantage you can get. Which is why SureFire developed its Special Operations series [flash light] to be the best extreme-duty tactical illumination tool in the world.
Risk Management Defined
When SureFire asked operators what they wanted, the company was told a light that could survive a halo insertion or a midnight raid on a crack house. Operators wanted SureFire to deliver a light bright enough to find and blind suspected adversaries. SureFire handhelds can be used as non-lethal “force options.” As the company likes to say, “Shine a SureFire in a suspect’s eyes, and he’s out of the fight.” The company understands that you might not be a Special Forces operator hunting for terrorists in an Afghanistan cave to benefit from the retina-searing white light produced by the 500-lumen M6 Millennium. And you may not need a SureFire weapon light for your Heckler & Koch, Colt, or SIG submachine gun, but, then again, you may. But Special Forces operators around the world take dead aim with SureFire illumination tools as the ultimate in risk-management tools.
Invest for Consistency
Every Special Ops fighter knows that on any mission risk management is the first order of duty. It’s a basic military tenet that also works as a basic financial tenet. Why then do so few investors seem to know anything or care about risk management? Usually because of (1) greed, (2) lack of training, and (3) pressure from salesmen, who account for most of the assets held by individual investors. I’m often shocked when I hear what an investor owns in his or her retirement portfolio. For the most part, investors own portfolios of securities that have been sold to them. It’s true. There’s no way to sugarcoat the deal: Most investors simply own a pile of rubbish.
For four decades, I have been a consistently successful investor, practicing my basic investment tenet of diversification and patience built on a foundation of value and compound interest. I’m sure you can dig up folk who will at least tell you that they make more money than does Dick Young. Perhaps this is the case, but my conservative, balanced approach is suitable for investors who want to avoid debacles and emerge from the investment wars with a comfortable nest egg in retirement.
Unmanaged Risks Lurking in Some Portfolios
Two potential big risks we see lurking in the portfolios of some investors today are too much exposure to stocks and an overconcentration in certain segments of the stock market. Years of zero interest rates have no doubt caused some investors to reach for return by over-allocating to equities. But stocks aren’t a one-way bet. Should the stock market experience another 50% plus drop, as it did twice in the last 20 years, over-allocated equity investors will suffer.
Concentration risk is also becoming an issue. The high-flying FAANGs are a contributor, but so are the proliferation of market-cap-weighted index ETFs and mutual funds in retail investor accounts. An Index500-stock portfolio, by example, may give the impression of diversification, but only a handful of names and one or two sectors drive most of the performance in the market-cap-weighted S&P 500.
In our January 2000 client letter, we wrote about the concentration risk of the S&P 500.
The S&P 500 was up 19.5% for the year [1999], but just seven names—Microsoft, Cisco, GE, Wal-Mart, Nortel Networks, Oracle, and AOL—accounted for 50% of the S&P’s total gain. In fact, the S&P 500 had more losers than winners last year: 54% of the 500 stocks were down. And, on the NYSE, only 38% of stocks listed had gains for the year.
Nortel and AOL are long gone, and Microsoft and Wal-Mart took more than a decade to regain their dotcom-era highs.
You have read similar statements from me over the last year on how the performance of just a handful of big, and in some cases speculative, names are driving the performance of the S&P 500. I’m not forecasting a similar fate for the handful of stocks driving the S&P 500 today, but the possibility of such a scenario should not be ruled out.
How We Manage Risk for You
How do we look to maintain the proper asset allocation and manage overconcentration risk in your portfolio?
We craft globally diversified balanced portfolios of individual securities (almost entirely) for our clients and monitor the allocations of those portfolios continually. The ongoing monitoring is vital to risk management. Allocations can shift widely over time as stock and bond markets fluctuate. As a basic example, consider a 50/50 portfolio comprised of the S&P 500 and the Bloomberg Barclay’s Aggregate Bond Index. If you purchased that portfolio at year-end 2009 and never rebalanced, you would now have a portfolio that is 70% stocks and 30% bonds. You would also be nine years older today, which might demand an even more conservative asset allocation than your starting 50/50 portfolio, yet the risk profile of your portfolio has increased.
The necessity of having a portfolio rebalancing strategy should now be established wisdom. Rebalancing cuts risk and may even boost return. But for many, rebalancing is the chore that never gets done. What to sell, when to sell, how many positions to sell, which accounts to sell in, and tax considerations, are all questions that must be answered.
We, of course, take the hassle of rebalancing away from you. We don’t employ the set-in-stone monthly/quarterly rebalancing strategies that so many in the industry seem to favor. Nor do we bother with minor deviations in portfolio allocation. Stocks and bonds need room to breathe. Our approach seeks to reduce risk while integrating our investment strategy and minimizing taxes and transaction costs.
The Health-Care Tailwind
Last month I profiled the defensive nature of the consumer-stock sector. The health-care sector shares some defensive traits with the consumer staples sector. In addition, the aging of America’s population is a powerful secular growth tailwind for the health-care sector. It’s no secret that as people get older they demand more health-care products and services, and America’s population is aging rapidly. Census Bureau data shows that in 2020 nearly 55 million Americans will be aged 65 and over. By 2030 that number will jump to over 72 million, a 30% increase in just 10 years. Americans over 65 will represent 19.3% of the country’s total population, a record high.
Many of America’s elderly are already on medications, and the numbers will likely increase as the country’s cohort of elderly citizens grows. In a 2015 study, the CDC reported that 40% of Americans 65 years and over were on five or more prescription drugs. About 65% were on three or more. And 91% were on at least one.
This striking reality appears to bolster the case for investing in the health-care industry. We target health-care companies with strong records of regular dividend payments and attractive yields. Merck is a company on our current buy list and one held in many portfolios via the Fidelity and Vanguard Healthcare ETFs. Merck has paid a dividend since 1935, and its yield of 2.7% today is more than twice the yield of the broader health-care index.
Making Merck
In 1668, Jacob Friedrick Merck acquired Angel Pharmacy in Darmstadt, Germany, and began the Merck family pharmaceutical business. In 1853, the business, known as E. Merck, made one of its first forays into America at the World Exhibition in New York City. In 1887 the company opened its own New York City branch. In 1891, George Merck traveled from Germany to New York to oversee the newly formed Merck & Co., a standalone firm built from E. Merck’s American operations. In subsequent years, Merck produced groundbreaking medicines, including the first diphtheria antitoxin, a smallpox vaccine, a bubonic plague vaccine, and more.
Merck was a large supplier of medicines and vaccines to the military during both World Wars, alongside Sharp & Dohme, another major pharmaceutical company with which Merck merged in 1953. In the same era, Merck began producing medicines for animals, opening up its business to the large market for agricultural health-care products.
Modern-Day Medicine
Later, Merck would begin producing consumer products, and they continued to roll out drugs such as Sinemet and Pneumovax and vaccines like MR-II and Deptavac-HVT. In more recent years, Merck has developed breakthrough medications and vaccines like Gardasil and Keytruda.
Today, Merck operates in over 140 countries, with approximately 69,000 employees. In 2017, Merck spent $7.3 billion on research and development and generated over $40 billion in revenue. The company’s core areas of focus today include diabetes, infectious diseases, oncology, and vaccines. Merck is also innovating in animal health, with efforts aimed at livestock, companion animals, and aquaculture.
Have a good month. As always, please call us at (888) 456-5444 if your financial situation has changed or if you have questions about your investment portfolio.
Warm regards,

Matthew A. Young
President and Chief Executive Officer
P.S. Pipeline shares have made a comeback over the last six months. Since March 31st, the Alerian MLP index has gained 18.7%, including dividends. Year-to-date, the Alerian MLP index is up 5.34%. Higher oil prices, more clarity on a FERC ruling that hurt the stock price of many pipelines earlier in the year, more favorable sentiment, and less new-equity supply have helped the sector. With yields approaching 7%, we continue to favor MLP pipelines.
P.P.S. Chinese real estate remains a looming risk to the global economy. Marketwatch recently reported Chinese real estate sells for $202 per square foot—a 38% premium to the median price per square foot in the U.S. despite the fact the U.S. has income per head that is more than 700% higher than in China. Rental yields of 1.5% aren’t supportive of Chinese real estate prices, nor are the vast number of vacant apartments. Prices are being supported by the greater-fool theory of investing. Sooner or later, that will end. And when it does, the mop-up will likely be unpleasant.
P.P.P.S. Residents of high-tax states are preparing to face a reckoning in 2019. Changes made to the tax code last year capped their ability to deduct state and local taxation from federal tax returns. That means high-income earners in high-tax states could now pay much more each year.
High-income earners have been fleeing high-tax states for years, but Chris Edwards of the Cato Institute explains the trend could continue given the new tax burden placed on those filers. He writes:
High earners are the hardest hit by the new tax cap, and the IRS data show that they were already moving to low-tax states. For the 25 highest-tax states, the average migration ratio for those earning more than $200,000 was 0.84, meaning large net out-migration. For the 25 lowest-tax states, the average ratio was 1.37, meaning large net in-migration.
New York had the lowest ratio for high earners at 0.49, while Florida had the highest at 2.62. High earners love Florida’s lack of income and estate taxes, and there has been a steady stream of high-paying financial firms moving to Florida from the Northeast for that reason.