Tame Volatility with Balance not Market Timing
November 2011 Client Letter
Here is one problem facing investors: during August and September, the Dow Jones Industrial Average rose or fell by more than 1% on 29 days. By third quarter’s end, the Dow was down 12%, the largest quarterly percentage decline since the first quarter of 2009. This degree of volatility, which of course is great fodder for the media, can lead to knee-jerk decisions that send investment strategies off course.
One reaction to the volatility is selling and going to cash. Hitting the mattresses and living to fight another day worked pretty well in the 1980s, when yields on one-year T-bills were often higher than 7%. And for much of the 1990s, one-year T-bills hovered around 5%. Today, nervous investors have unappealing options, including money markets essentially offering no yield or a 2% yield on 10-year U.S. Treasury notes. At these low rates and with overall inflation running at 3.9%, investors who move to cash are pretty much throwing in the towel and accepting a loss.
Spooked investors who sold in September witnessed an October U-turn as the Dow quickly barreled ahead 6.6% in the first two weeks of October. The month finished at one of the biggest one-month gains since the early 1990s. Studies have been done illustrating how missing the best months of market returns can dampen investment returns. Investors who attempt to time the market run the risk of missing periods of exceptional returns just like we had in October.
Now, investors who sold out in September must decide whether to sit in cash and accept inflation risk or get back into the market and accept the potential for continued volatility.
It’s important for investors to understand their tolerance for risk. Risk varies for each investor. By example, volatility may not be the primary risk for the long-term investor. Instead, the long-term investor may be more concerned with the portfolio’s future purchasing power—in other words, keeping pace with inflation. This is definitely an issue for those who expect to be living for several decades.
Over longer periods, stocks have historically outperformed both cash and bonds. Additionally, the longer-term stock investor has reduced risk of loss compared to a shorter-term investor. Historically, over a one year holding period, the chance of losing money in the stock market has been about 33%, over 5 years, 22% and over 10 years, 13% (based on historical S&P 500 returns excluding dividends from year-end 1930-2010). But when you go out over longer periods, especially over 20 years, the risk of loss is minimal.
Investors are living longer than before, and the rise in longevity means that retirees often face decades of investment decisions. More than likely, their main decision will be how to reduce portfolio volatility while having enough portfolio growth to keep pace with inflation. Most investors recognize the importance of an equity component to achieving their long-term investment goals.
Balanced portfolios often are less volatile than all-stock portfolios. Balanced portfolios feature a mix of both bonds and stocks. Historically, when stocks do poorly, bonds perform relatively well. And when bonds do poorly, stocks can help pick up the slack. This teeter-totter effect can help smooth out the volatility and reduce dramatic swings in portfolio values.
We currently suggest a portfolio featuring a mix of bonds, dividend-paying stocks, gold, and foreign currencies. Many clients at Richard C. Young & Co., Ltd., have at least 50% dedicated to bonds with approximately 40% in dividend-paying stocks and ETFs and 10% in gold and currencies (50-40-10).
A 50-40-10 mix can offer at least two benefits. The first is that a balanced portfolio with 40% invested in stocks should experience much less volatility than an all-stock index. During dramatic stock-market declines, a balanced portfolio should not take as wild a ride. (The flip side is that when the stock market soars, a balanced portfolio will often lag by comparison.)
The second benefit is that approximately 90% of the portfolio invests in securities paying interest or dividends. This regular stream of cash can help offset the negative impact of inflation. Such a portfolio has appeal to the longer-term investor concerned with inflation risk.
As I wrote in last month’s letter, the Federal Reserve’s August decision to hold short-term interest rates near zero for another two years pushed already low interest rates down even further. Yields on short- to intermediate-term Treasury securities are now under 1%. Investors looking for a 2% return in Treasury securities must now buy 10-year maturities. And those income seekers hoping to maintain the purchasing power of their money in full-faith-and-credit-pledge U.S. Treasuries are out of luck. The highest-yielding Treasury security, the 30-year T-bond, yields only 3.17%, compared to an inflation rate of 3.9%.
The Federal Reserve’s confiscatory monetary policy has greatly complicated the task of clipping bond coupons. Federal Reserve Chairman Ben Bernanke is seemingly unconcerned with the potentially devastating consequences of his repressive interest-rate policy.
The Fed is forcing investors who are the least equipped to shoulder risk into speculative investments. You either take the Fed’s bait by risking portfolio-decimating losses or sit in cash and lose purchasing power. We of course are resisting the Fed’s misguided push to invest speculatively, but we aren’t sitting idle. To navigate the current low-interest-rate environment, we are investing selectively in high-yield bonds and taking a more active approach by using a roll-down strategy.
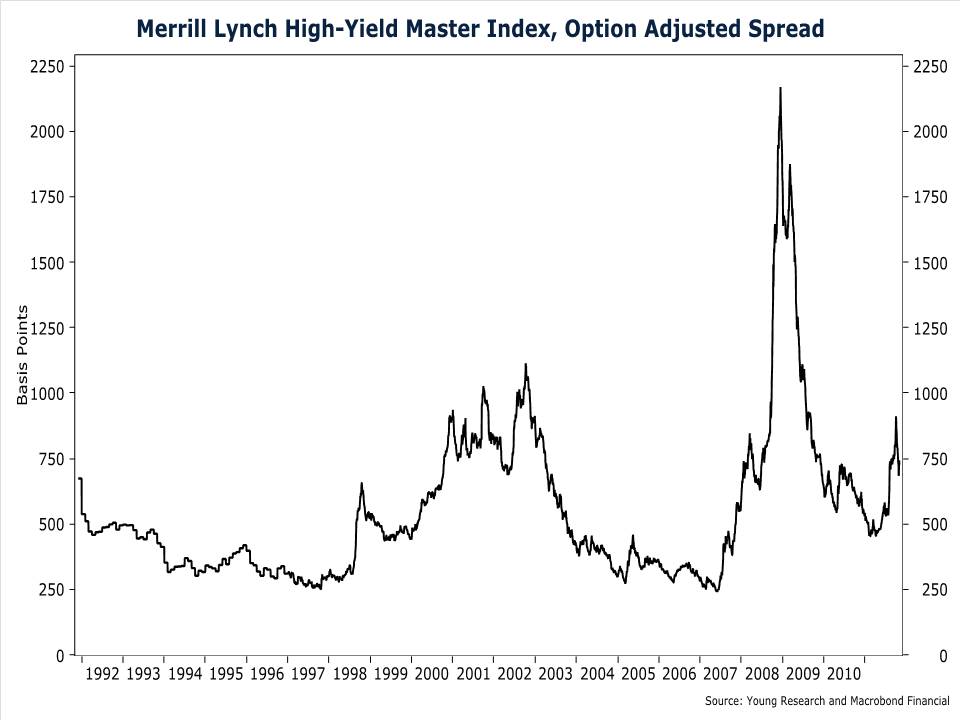
Concern about a recession in the U.S., a hard landing in China, and most notably, a sovereign-debt-induced financial crisis in the euro area has pushed high-yield bond prices down, and yields up. In early October, the yield on the Merrill Lynch High-Yield Master II Index rose to 10% and today sits at nearly 9%. Of course, high-yield bonds offer such juicy yields because they are issued by borrowers who are less creditworthy than those in the investment-grade bond market. But in our view, at current levels, investors are being compensated for the added risk.
One of the data points we use to assess the value in high-yield bonds is the default rate embedded in prices. A simple back-of-the-envelope calculation can show the default rate that is priced into high-yield bonds. To make the calculation, you need only two variables: the spread on high-yield bonds (yield advantage relative to Treasuries), and the loss rate on defaulted bonds. The spread on the Merrill Lynch High-Yield Master II Index is 7.5%. Historically, the loss rate on defaulted high-yield bonds has averaged about 60%. To find the market’s expectation of the default rate, we simply divide the spread, 7.5%, by the loss rate of 60%. The result of 12.5% is the default rate that would set the return of high-yield bonds equal to the return on comparable-maturity Treasury securities. In other words, if 12.5% of the bonds in the Merrill Lynch High-Yield Master II Index were to default, the return on high-yield bonds would equal the return on comparable-maturity Treasuries (assuming a 60% loss rate on defaulted bonds).
How does a 12.5% default rate compare with history? According to Moody’s, the speculative-grade default rate has exceeded 12.5% only twice in the last 90 years—once during the Great Depression and a second time during the 2008 financial crisis. At current spreads, high-yield bonds are priced for calamity. Yet corporate fundamentals appear to be solid. Nonfinancial corporate debt to pretax income is at the low end of a three-decade range. Corporate profits and profit margins are at a record, and liquidity in the banking sector remains near record highs. We see limited downside risk and the opportunity for considerable upside.
For some clients, we recently purchased a high-yield bond from Sunoco Inc. Sunoco is a leading oil-refining and marketing company. Sunoco sells fuel through more than 4,900 retail gas stations in 24 states that are supplied by Sunoco-owned refineries. Sunoco is also the general partner and has a 34% stake in Sunoco Logistics, a pipeline company. As of June 30, Sunoco had $1.4 billion in cash on hand, compared to $2.5 billion in debt. We purchased Sunoco’s 4.875% bonds due in October of 2014 at a yield of nearly 5%.
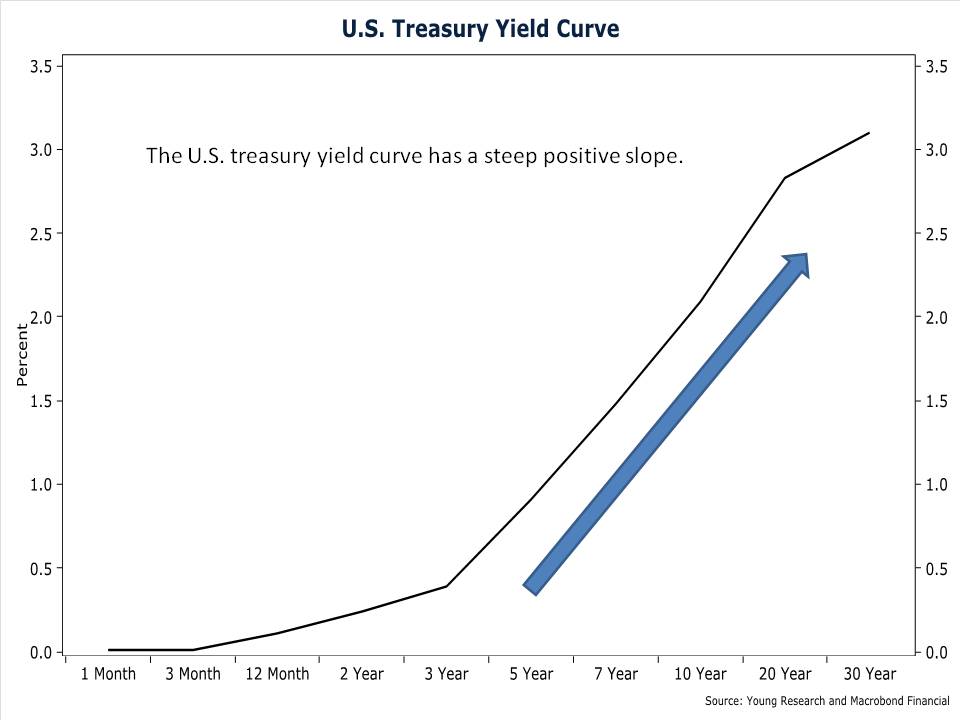
A second adjustment we are making to portfolios to enhance yield is a roll-down strategy. A roll-down strategy seeks to profit from a steep and positively sloped yield curve (when long-term rates are higher than short-term rates). As a bond approaches maturity, its yield falls (assuming a positively sloped yield curve), potentially pushing up its price. With a roll-down strategy, an investor sells the bond after it rises in price and reinvests the proceeds in a longer-maturity bond.
Let’s look at an example. Today, five-year Treasury securities yield 1.038% and four-year Treasury securities yield 0.73%. If an investor buys a five-year Treasury security today for $1,000, in one year the bond’s price will rise to $1,012 (assuming no change in interest rates) so that the bond’s yield falls to 0.73%—the yield on four-year Treasuries.
Adding the $10.38 in annual interest the investor will collect,the value of the bond will be $1,022 ($10 in interest plus $1,012 in principal). That’s a 2.23% return—more than double the bond’s yield at purchase. Now, if the investor holds the bond to maturity, its price will eventually fall back to $1,000 and his return will equal the bond’s yield to maturity when purchased. But if the investor instead sells the bond at the end of year one, he can capture a capital gain and reinvest the proceeds in another five-year bond yielding 1.038%.
A roll-down strategy works best when the yield curve is positively sloped and interest rates are likely to remain stable. Today the yield curve is steeply positive, and the Fed’s commitment to maintain its zero interest rate policy until mid-2013 is likely to keep a lid on short- to intermediate-term interest rates.
As part of our roll-down strategy, we recently sold an AT&T bond due in 2013 at a price of $111.04 and yield of 1.29% and purchased an AT&T bond due in 2016 that was yielding 2.10% at a price of $103.67. We picked up 81 basis points in yield and for many portfolios captured a gain (above amortized cost).
During the past decade ending September 2011, the S&P 500 generated a not-so-great annual return of 2.81%. For many investors, this experience highlights the unpredictable nature of the stock market, even over a 10-year period. It’s important to remember that stock markets do not run on a schedule. They are random and unpredictable.
To cope with today’s speculative markets, we favor a defensive approach featuring a globally diversified portfolio of stocks and bonds. We emphasize companies that have strong balance sheets and operate in industries with high barriers to entry. And most importantly, we prefer securities that pay a steady stream of dividends or interest. Cash payments today and the promise of higher payments tomorrow are a comfort during periods of high volatility.
Have a good month, and as always, please call us at (888) 456-5444 if your financial situation has changed or if you have questions about your investment portfolio.
Sincerely,

Matthew A. Young
President and Chief Executive Officer
P.S. An important feature of our equity strategy is to focus on companies we believe possess the ability and desire to raise dividends annually. Companies with annual dividend increases are usually confident about their future earnings. These companies tend to be stable businesses well positioned in their markets and able to perform throughout market cycles, making them good candidates for long-term growth.
P.P.S. In October, the Conference Board Consumer Confidence Index plunged deep into recessionary territory. The index has only been lower twice in its more than four-decade history. Both episodes were associated with deep recessions. Why are consumers forecasting recession? Wasn’t October the best month in stocks in almost two decades? Maybe low consumer confidence has something to do with income. In the third quarter, real personal income excluding transfer payments fell for the first time since the recovery began. So we have millions who are scraping by with unemployment benefits, and those who are working are seeing their incomes fall. That doesn’t bode well for future economic growth.