Up 230%
September 2015 Client Letter
From its March 2009 low, the S&P 500 is up 230%, including dividends. That is an impressive return and has been cited regularly by pundits and promoters as a reason to buy more stocks. But it is important to remember that few investors earned 230%.
To these investors, the 230% gain in the S&P 500 during this bull market is irrelevant. A more meaningful return is one that assumes investment before the financial crisis. Consider the returns an investor in the S&P 500 would have earned had he bought at year-end 2006 instead of the March 2009 low. From year-end 2006 through August 2015, the S&P 500 delivered an average annual return of 6.1%—not bad, but not nearly as impressive as the 19% annual return from the March 2009 low.
In fact, the 6.1% return on the S&P 500 is only about 0.50% more than the return of the much less volatile Vanguard Intermediate-Term Investment-Grade bond fund over the same time period.
What if an investor started investing prior to 2006? Surely the stock market would have delivered returns that are closer to the current bull market returns, right? Not exactly. From year-end 1998 through August 2015, the S&P 500 compounded investors’ money at a rate of 4.8%. Compare that to the 5.6% annual return of the Vanguard Intermediate-Term Investment-Grade fund.
Markets go through cycles. It is important not to base an investment strategy on returns earned during only one part of a cycle.
Correction or Crash
As I wrote last month, prior to August it had been almost four years since the stock market last experienced a 10% correction. Historically, stock market corrections are quite common. So the recent market correction wasn’t so out of the ordinary. What was out of the ordinary, and what caught many investors off guard, was the suddenness of the correction and the speed of the uninterrupted decline. To many, it felt more like a crash than a correction.
Over the last 70 years, there have only been seven other occasions when stocks fell by as much as they did—and as fast as they did—in August.
New Stock Market Structure and Correction
Why was the correction so fast? We would place the black hat on the new and “improved” stock market structure (sort of like the “new” Coke). The players who dominate stock trading today are not the same players who dominated markets even 10 years ago.
High frequency traders (HFTs) now account for over half of the stock market volume, while exchange-traded funds (ETFs) play a more prominent role in financial markets, and hedge funds—many of them leveraged—are also a bigger part of the investment landscape than in decades past.
Do High Frequency Traders Make Market Declines Worse?
HFTs have the potential to exacerbate market declines. Today, HFTs represent a large part of the market and are under no obligation to provide bid and offer quotes in periods of market stress, as NYSE specialists once were. HFT traders claim to increase liquidity, but the evidence suggests otherwise.
Blue-Chips Down 20%
On August 24, the worst day of the sell-off, the Dow opened down over 1,000 points, with some of the largest listed stocks in the U.S., including GE and Pepsi, opening down 20%. ETFs traded at discounts of as much as 30% to the value of their underlying holdings. That’s not supposed to happen in a liquid market. Where was the liquidity the HFTs are so quick to boast about when it was needed most?
ETFs Increase Volatility
ETFs are a net benefit to the investor class. But they don’t offer the same buffer to stock prices that traditional open-end mutual funds do. When an order is placed to sell a traditional mutual fund in the morning, a portfolio manager has the entire day to come up with ways to meet the redemption. Selling shares, dipping into cash, or borrowing temporarily are all available options. When an ETF sell order is placed, the trade is executed immediately. If many investors put in similar orders at the same time, the aggregate order volume can have an impact on the underlying stocks in the ETF.
As the price action on August 24 proved, ETFs can trade at a substantial discount to their Net Asset Value (NAV). The issue is that while most days ETFs trade within a fraction of a percentage point of the value of their underlying holdings, nothing guarantees this relationship.
Last but not least, hedge funds tend to be fast money traders and can use astounding amounts of leverage. In times of market stress, if just a couple of the big boys are caught leaning the wrong way, massive margin calls can drive the whole market down in a flash as trading activity reaches a frenzy.
Unfortunately for serious long-term investors, the new and improved stock market structure is here to stay. Sharp jarring corrections and powerful relief rallies are now likely a permanent part of the equity market landscape. This creates risks as well as opportunities.
We think the new market structure goes a long way toward explaining the speed of the recent correction, but it doesn’t explain why stocks corrected in the first place. The financial press puts the blame on emerging markets, the Fed, or the Chinese stock market correction.
In our view, while any one of these factors may have been the catalyst for the correction, it wasn’t the root cause. The root cause of the correction was from a U.S. stock market way out in front of its skis. As our chart shows, prior to the correction the price-to-sales ratio of the S&P 500 was at dotcom-bubble-era levels. When stock valuations enter bubble territory, it often isn’t a matter of if, but a matter of when they will correct.
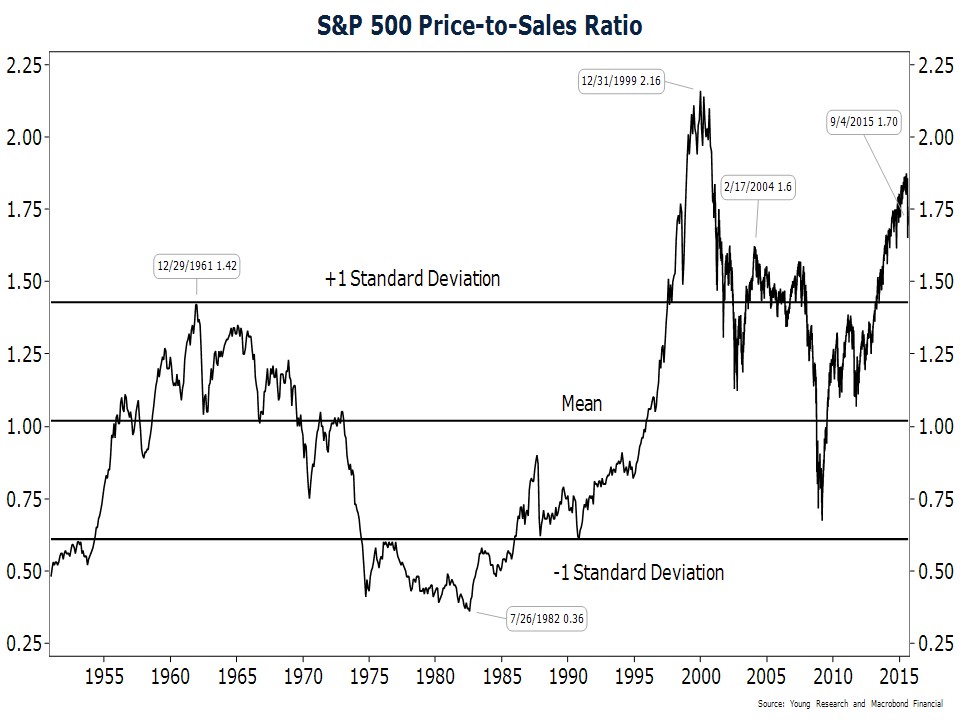
Even after the 10% correction in the S&P 500, stocks are still not priced to deliver the types of long-term returns many have come to expect from equities. That doesn’t mean another correction is imminent, but we would argue that it does increase downside risk.
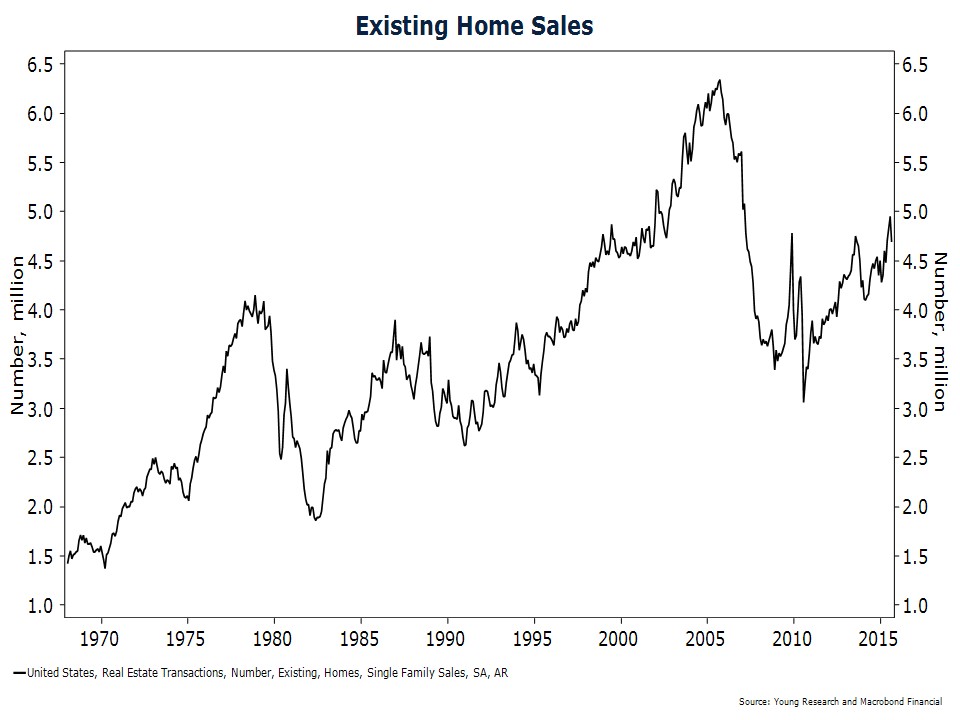
As we see it, the good news is that despite the U.S. economy being in the winter stages of the cycle, growth still looks OK. The housing sector, which has been the last to recover, is showing continued signs of strength. Sales activity is at an eight-year high, as seen in our chart on existing home sales.
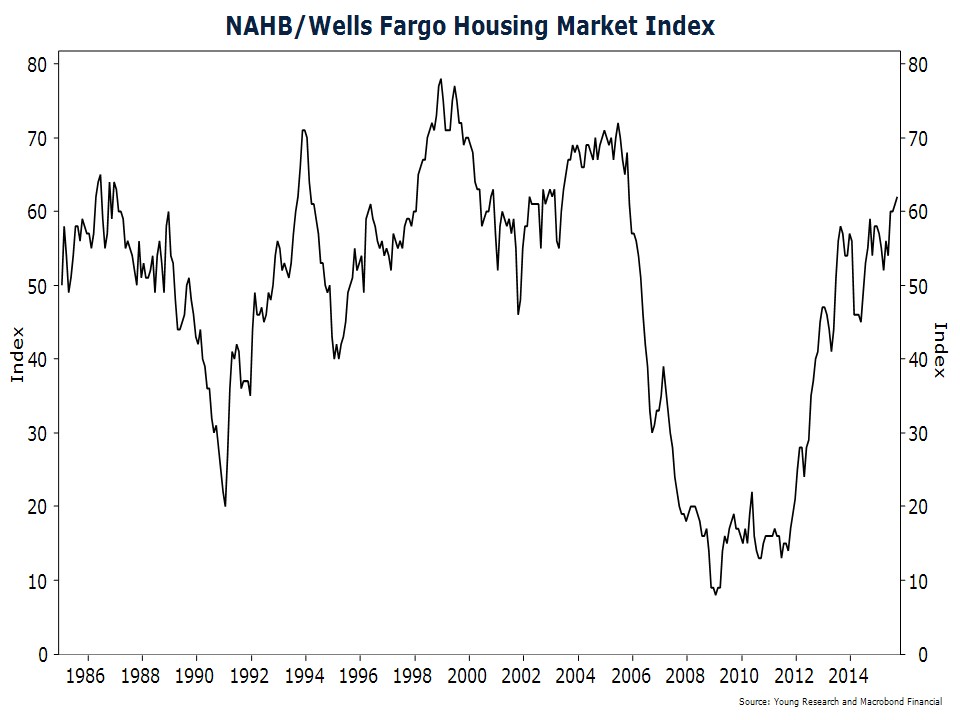
Home-builder sentiment is also surging. Home builders are the most positive on their industry in years and the outlook for sales over the next six months is at its highest level in almost a decade.
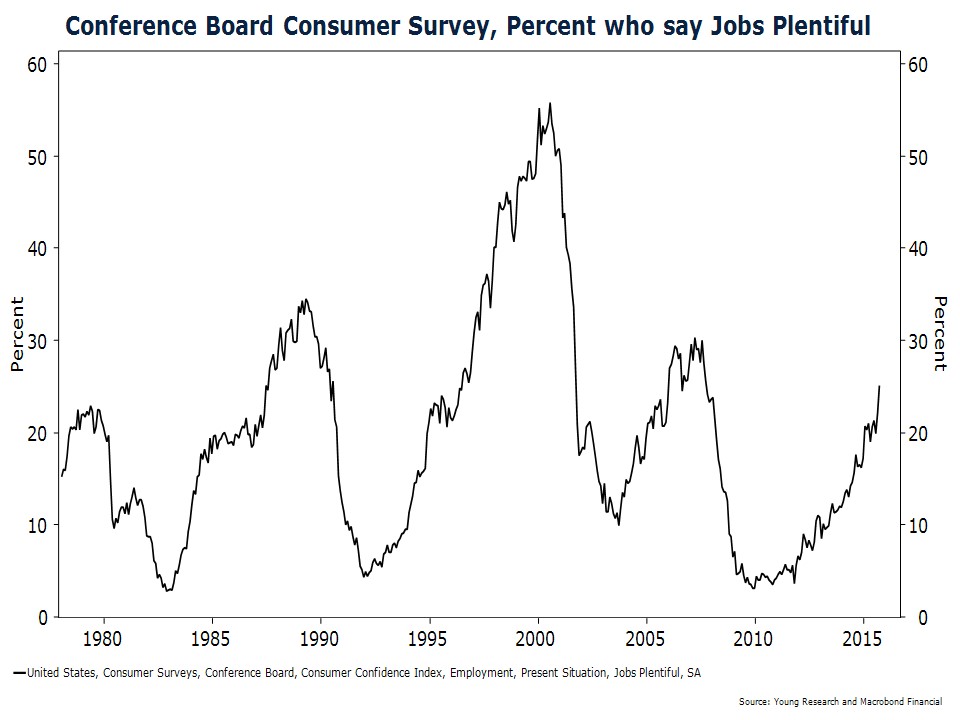
The U.S. job market is also in good shape. Weekly jobless claims are printing at some of the lowest levels on record, payroll employment continues to increase at a steady pace, and consumer sentiment toward the job market is on the rise. The percentage of Americans who say jobs are plentiful is at levels consistent with economic expansion.
What could take the wind out of the sails of the U.S. economy and the stock market?
China Risk
One factor being closely watched is China. If China’s stock market correction and currency devaluation do in fact lead to a deeper slowdown in the emerging economies, additional losses in U.S. stocks may come sooner rather than later. While the Chinese stock market doesn’t provide a reliable guide to what is going on inside of the Chinese economy, a host of other indicators point toward slowing global growth. Emerging market stocks outside of China are selling off, oil is in the tank, industrial metals are falling, lumber is trending down, and the CRB index of raw industrials prices has fallen in 13 out of the last 15 months.
The emerging markets have been the growth engine of the global economy. If many of the world’s emerging economies enter recession, it could bring stock prices in developed markets down further. During the 1997–1998 emerging markets crisis, emerging economies accounted for 20% of global output. Today they account for almost half of output and an even larger share of the growth. During 1998, the S&P 500 fell nearly 20% as emerging economies imploded. From its peak in May to its trough in August, the S&P 500 fell about 12%. At their current level, stocks are only 7% off their high.
Recessions in the emerging economies by themselves probably can’t push the U.S. economy into a recession, but it is important to remember that the U.S. economy is not the U.S. stock market. Exports account for a manageable 13% of GDP, but foreign sales account for 33% of total S&P 500 revenues. A crash in global growth would hurt U.S. multinational firms much more than the broader U.S. economy.
Federal Reserve Update
After high expectations for the first interest rate hike in almost a decade at its September policy meeting, the Federal Reserve was apparently spooked into delay by recent financial market volatility. The Fed has long argued that its policies are data dependent, but their recent actions argue otherwise. In recent years, we believe the Fed has been overly focused on the stock market. Some might say they’ve been obsessed.
Yellen & Co. are still saying that they expect to increase rates before year-end, but we’ve heard this song before. The Fed seems to be waiting for some optimal set of conditions that never arrive. What those conditions are, the public has not been told.
What is our outlook for a Fed rate hike? We’ll believe it only when we see it.
Have a good month. As always, please call us at (888) 456-5444 if your financial situation has changed or if you have questions about your investment portfolio.
Best Regards,

Matthew A. Young
President and Chief Executive Officer
P.S. “The Fed has talked and talked about the need to move away from its zero interest rate policy for months before the Asian angst. Chair Janet Yellen seemed fairly certain just two months ago that the Fed would be raising rates this year if the economic forecast unfolded as planned. The key takeaway from last Thursday (the Fed’s 9/17/15 meeting) is that the seemingly perfect or near-perfect conditions the Fed seems to be waiting for are hardly likely to emerge anytime soon. The goalposts keep shifting, and I believe that even when the overseas markets and economies turn around, the Fed, with all its flexibility and power, will simply switch its focus to something else to justify staying on the sidelines.” Financial Post, David Rosenberg, 9/22/15
P.P.S. An issue of growing concern for all investors is cyber fraud. Cyber fraud continues to grow and evolve. While we take precautions on our end to protect your personal information, we encourage you to be proactive in this area to mitigate the potential risks. Some steps you can take include: managing your electronic devices, protecting all passwords, surf the Web safely, protect information on social networks, protect your email accounts, safeguard your financial accounts and notify us if you change your address. Also, please notify us immediately if you suspect that your email account or Fidelity account has been compromised. If it is after business hours, you can call 1-800-FIDELITY and ask for the Customer Protection Team.
P.P.P.S. I am pleased to announce that Barron’s has ranked Richard C. Young & Co., Ltd. as one of the top independent advisors in the nation for 2015, the fourth consecutive year. Please see the enclosed flyer to read an excerpt from Barron’s “Taking a Winning Tack”.