Why Financial Market Have Been so Volatile
January 2012 Client Letter
One of the more common mistakes individual and even professional investors make is ignoring or underestimating future events. During the past three years, both the Dow and the S&P 500 posted positive returns. While 2012 could certainly be another favorable year, investors would be well advised to expect continued periods of high volatility.
During the last five months of 2011, wild gyrations became common in the equity markets. The S&P 500 plunged almost 13% in early August, and then rallied over 8% to close the month, only to fall another 10% in September. Then in October, stocks rose a remarkable 17% from trough to peak. The spectacular rallies and corrections continued in November with the S&P 500 falling 7.5% and then rising an equal amount in the span of four trading days.
While this period of heightened stock-market volatility has been particularly acute, elevated volatility has been with us since the financial crisis began. There are many ways to measure stock-market volatility. Some investors prefer to look at the VIX Index, which uses put options to measure the implied level of volatility in the market. A more intuitive measure is the percentage of trading days the S&P 500 moved by more than 2%. Since the financial crisis began in late 2007, the percentage of days when the S&P gained or lost more than 2% has been almost five times the post–World War II average. In 2011, approximately 14% of trading days resulted in a 2% or greater move in the index. And for the final three months of 2011, the figure was a Depression-era 32%.
Why have markets been so volatile? There are many possible explanations. But in our view, the primary driver is the ongoing tension between a global economy trying to cure structural imbalances and actions by policy makers intended to prevent or slow this corrective process.
In past letters, I have discussed the structural headwinds the world’s largest economies face over coming years. The sources of these headwinds are many and varied, but a common thread across the world’s largest economies is the misallocation of capital.
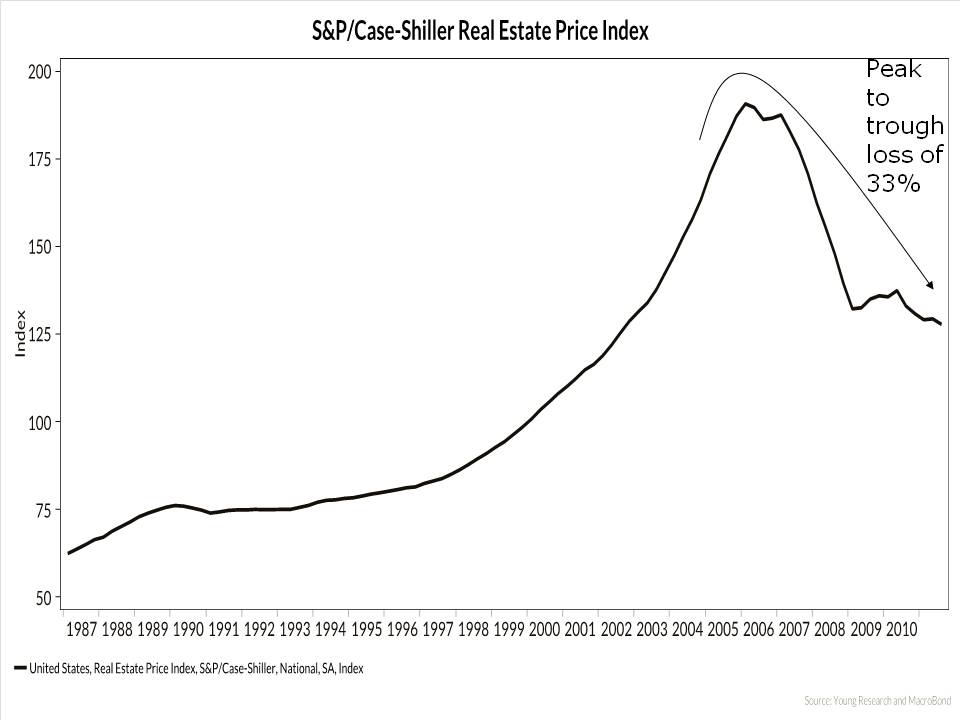
When capital is misallocated, either by force or by monetary persuasion, an unsustainable boom is created, which inevitably leads to a painful bust. The real-estate bubble is the most recent example of capital misallocation in the U.S. Years of easy money, low interest rates, and a central bank focused on levitating asset markets contributed to an atmosphere of excessive risk taking by lenders, borrowers, and investors. Lenders made no- and low-documentation loans to folk with no ability, or in some cases willingness, to repay those loans. Investors and borrowers essentially made leveraged bets on home prices, using leverage of as much as 33 to 1. The underlying assumption of all market participants was that the downside risk was limited. If home prices started to drop or the economy slowed, the Fed would flood the system with liquidity.
When the housing bubble finally burst, the Federal Reserve did indeed flood the system with liquidity, but the damage was too great for Fed Chairman Ben Bernanke to contain. Some of the nation’s largest lenders collapsed, speculators were crushed, and foreclosures surged. Home prices are down more than 30% from their peak. Home equity has evaporated for some and collapsed for many more. According to Core Logic, 22% of all properties with a mortgage are underwater, and an additional 5% have an equity cushion of less than 5%.
The market is still correcting the widespread misallocation of capital built up over a decade or more. Market participants are searching for a bottom in housing and consumption and the stock market, but policy makers are doing everything in their power to prevent or delay this inevitable result. Despite the failings and risks presented by the Federal Reserve’s unconventional monetary policy, Mr. Bernanke presses on.
In the 38 months that have passed since Lehman Brothers failed, the Fed has been on hold (not easing or threatening to ease) in only six of those months. The Fed’s liquidity injections haven’t helped the labor market or prevented housing prices from falling.
But they have distorted financial markets, increased volatility, decimated the income of many retired investors, and created a dangerous dependency on 0% interest rates.
In the aforementioned six months that the Fed has been on hold, the average stock-market return was -2.02%, with only two out of the six months resulting in gains. This is a policy-driven market. When the Fed stops supporting asset prices, risk falls out of favor. When the Fed injects liquidity, investors bid up the prices of risky assets. This risk-on, risk-off environment has created a great deal of volatility.
But the policy-driven market is not limited to the United States. Financial markets have reacted violently to every statement and rumor about a possible solution to the euro-area debt crisis. As in the U.S., economic forces in the euro area are trying to right years’ worth of capital misallocation, and policy makers are trying to prevent or slow the process.
The euro experiment created a common currency and monetary policy for a diverse group of countries, but left each country to run its own fiscal policy. Profligate spenders such as Greece and Italy were able to borrow at Germany’s much lower interest rates. The euro area’s peripheral countries temporarily “papered over” the deficit in their competitiveness with Germany by going on a borrowing binge. In Spain and Ireland, too much capital was invested in real estate, and bubbles resulted. In Greece and Italy, government largesse was the result. Historically, countries such as Italy and Greece could improve competitiveness via inflation and currency devaluation, but now they are tied to the euro, those channels are closed. In a fixed-currency regime, the only way to improve long-term competitiveness is through politically intolerable wage and price deflation. But with debt levels now at unsustainable levels, the jig is up for the euro area’s periphery. Debt defaults, fiscal union, and painful wage deflation are the remedy to create a sustainable currency union, but these solutions are easier said than done.
In financial markets, the euro-area policy makers’ attempts to prevent a collapse of the common currency have caused elevated volatility. When rumors that a lasting solution to the debt crisis emerge, risky assets rally, but when those rumors are squashed, risky assets tumble.
High Frequency Trading and Volatility
High-frequency trading has also heightened volatility in the stock market over recent years. U.S. equity markets have changed drastically over the last 5–10 years. Gone are the days when the NYSE and its specialists dominated stock-market trading. Today, as many as 50 different venues in the U.S. trade equities. Now, almost all stock trades are done electronically. The NYSE specialists who were once obligated to make an orderly market during periods of market stress have been effectively replaced by high-frequency trading firms (HFTs).
HFTs are opportunistic traders that operate with little capital, hold small inventory positions, and are under no obligation to make an orderly market during periods of stress. These firms use sophisticated ultrahigh-speed programs to predict stock prices milliseconds into the future. The most successful HFTs are not the firms with the best insights into a company but those with the fastest programs, located closest to the exchange’s servers. HFTs don’t use fundamental analysis to make trading decisions. Instead these firms use information in order books, past stock returns, cross-stock correlations, and cross-asset correlation to make decisions.
While some might believe HFTs are benign market participants, just the opposite is true. High-frequency trading now accounts for 70% of U.S. stock-market volume—an astonishing statistic, to be sure. The purpose of financial markets is to efficiently allocate capital to its highest and best use, yet a majority of the daily trading in stocks is conducted by investors with no interest in the value of the companies they buy and sell. HFTs are interested only in the price of a stock over the next second or two.
HFT proponents will tell you high-frequency trading poses no risk to the broader market, and in fact increases liquidity and keeps transaction costs low. The counterargument is that HFT liquidity is transitory and shallow (large orders are hard to fill), and while HFTs have helped drive down bid-ask spreads on stocks, they are extracting those profits from investors in other ways (some of the strategies are discussed later).
Because HFTs are not under the same obligation as NYSE specialists to provide liquidity, they often pull back from the market during periods of stress, creating a liquidity vacuum, which can result in cascading prices. The so-called “Flash Crash” in 2010 was partly caused by several major HFTs stepping away from the market in order to limit risk. Here is what a joint CFTC-SEC report on the Flash Crash said about the structure of today’s stock market.
The Committee believes that the September 30, 2010 Report of the CFTC and SEC Staffs to our Committee provides an excellent picture into the new dynamics of the electronic markets that now characterize trading in equity and related exchange traded derivatives. While these changes have increased competition and reduced transaction costs, they have also created market structure fragility in highly volatile periods. In the present environment, where high frequency and algorithmic trading predominate and where exchange competition has essentially eliminated rule-based market maker obligations, liquidity problems are an inherent difficulty that must be addressed. Indeed, even in the absence of extraordinary market events, limit order books can quickly empty and prices can crash simply due to the speed and numbers of orders flowing into the market and due to the ability to instantly cancel orders. Liquidity in a high-speed world is not a given: market design and market structure must ensure that liquidity provision arises continuously in a highly fragmented, highly interconnected trading environment.
More troubling than the transitory liquidity HFTs provide are some of the dubious strategies employed by these firms. Below are some examples of the strategies used by various HFTs—most are illegal but difficult for regulators to detect.
Front-running – Using computer algorithms to detect and trade ahead of institutional orders.
Quote stuffing – Submitting and then immediately cancelling trades in order to gain a few-millisecond speed advantage over the competition. The computers of the HFT who submits the erroneous orders don’t have to process that information, whereas the competitors’ computers do.
Layering – Using hidden orders on one side of a trade and visible orders on another side of the trade to manipulate prices. For example, if a trader wants to buy a stock at $5.01, but the current bid is $5.02 and the asking price is $5.03, the HFT may put in an order that is hidden to buy at $5.01. It will then flood the market with orders to sell at a price higher than the current asking price, let’s say $5.05. Others will see the selling pressure and adjust their bid and ask prices lower, likely hitting the HFTs intended bid price of $5.01.
Spoofing – A trader may initiate the rapid-fire submission and cancellation of many orders, along with the execution of some trades to “spoof” the algorithms of other traders into buying or selling more aggressively, which can exacerbate market moves.
My goal is not to suggest all high-frequency traders are unscrupulous or the practice should be banned (though I suspect few would actually miss it). But it seems to me high-frequency trading has become so vital to the proper functioning of today’s stock market that, at the very least, more oversight and disclosure should be required of these firms.
Even with the structural imbalances in the global economy and the potential for elevated volatility from high-frequency trading, we believe stocks could have a positive year in 2012. First, in the current low-interest-rate environment, many investors feel there is greater upside potential from stocks versus bonds. A bias toward stocks could help elevate share prices. Additionally, stocks tend to favor U.S. presidential election years. The election-year argument didn’t work out so well last time around, but in 2008 markets were in a bubble due to excessive leverage.
Even with the potential for a decent year in stocks, we do not favor abandoning our strategy for a globally diversified portfolio that includes corporate bonds. Short-term corporate bonds, which we currently favor, can greatly reduce volatility if misfortune or an unlikely event makes an appearance in 2012. Risks including the euro mess, the Middle East, and a less-than-robust U.S. economy are potential triggers for widespread market disruptions.
As most of us are all too aware, the stock market is an emotional and volatile place. Diversification is not about maximizing returns. Diversification is about reducing risk. A portfolio invested, by example, 50% in corporate bonds, 40% stocks, and 10% in gold and currencies should have much less downside volatility than a portfolio invested primarily in stocks.
Have a good month, and as always, please call us at (888) 456-5444 if your financial situation has changed or if you have questions about your investment portfolio.
Sincerely,

Matthew A. Young
President and Chief Executive Officer
P.S. The homepage of Younginvestments.com reads “Dividends and Interest. Cash Flow Is Our Focus.” For 2012, we continue to believe conservative retired and soon-to-be-retired investors are well advised to concentrate on the dividends and interest theme. A continuous stream of cash should provide comfort in an environment where stock volatility could remain high.
P.P.S. “Dividends are a bonus in up markets and provide comfort during slides. Over time, dividends have provided about 44% of the U.S. stock market’s annualized total return of 10%. And they are sure to remain an important component of returns if appreciation is hard to come by in coming years, as we expect. Thanks to dividends, you can make money even if the market essentially goes nowhere.” Kiplinger’s Personal Finance, January 2012
P.P.P.S. The fact that a company pays a dividend is only one criterion in our stock selection process. Beyond a cash payment, we seek high-quality companies, dominant in their industry, with high barriers to entry, strong balance sheets (in our opinion) and a manageable payout ratio. We believe that limiting our purchases to this type of company will allow our clients to sleep better at night and appreciate a continuous stream of cash payments during what should be an eventful 2012. The yield on our Retirement Compounders equity program is 5.1%.*
*Yield as of 1/23/2012