July 2014 Client Letter
For most retired or soon-to-be-retired investors, significant portfolio losses are unacceptable. Since year-end 1999, the stock market has experienced two peak-to-trough declines of about 50%. During the dot-com bust, the S&P 500 lost 48% of its value, and during the credit crisis, the index cratered 56%.
How would you react if your life savings, the source of your livelihood in retirement, was cut in half? Would you be comfortable riding out the storm in hopes of making your money back in future years? Or would you cut your losses? These are not hypothetical scenarios. These were actual returns. And based on the potential bubble valuations in the stock market today, significant market declines could be seen again before the decade is out.
Following the financial crises of 2008, it took six years of 0% interest rates, trillions in monetary bribery, and another bubble for the S&P 500 to recover its losses from the prior bear market. Investors nearing retirement or in retirement don’t have that kind of time, and they shouldn’t count on monetary policy bailing them out again.
Portfolios with a bond component often have reduced volatility compared to an all-stock portfolio offering investors a degree of comfort to ride out bear markets. When crafting a bond portfolio, there are many decisions to consider. These include the weightings in various types of bonds, maturities to favor, sectors to favor, and where to position the bond portfolio on the quality spectrum.
Before crafting a suitable fixed-income portfolio, it is useful to develop an interest rate outlook. The purpose here is not to make a precise forecast, but to assess the risk of possible outcomes. At Richard C. Young & Co., Ltd., we assess risk by answering various questions, including: Where are interest rates today? How is the economy performing? What is the Federal Reserve doing?
Where Are Rates?
Rates are currently low, but low in relation to what? In our view, the most common yardstick for the level of current rates is an estimate of their fair value.
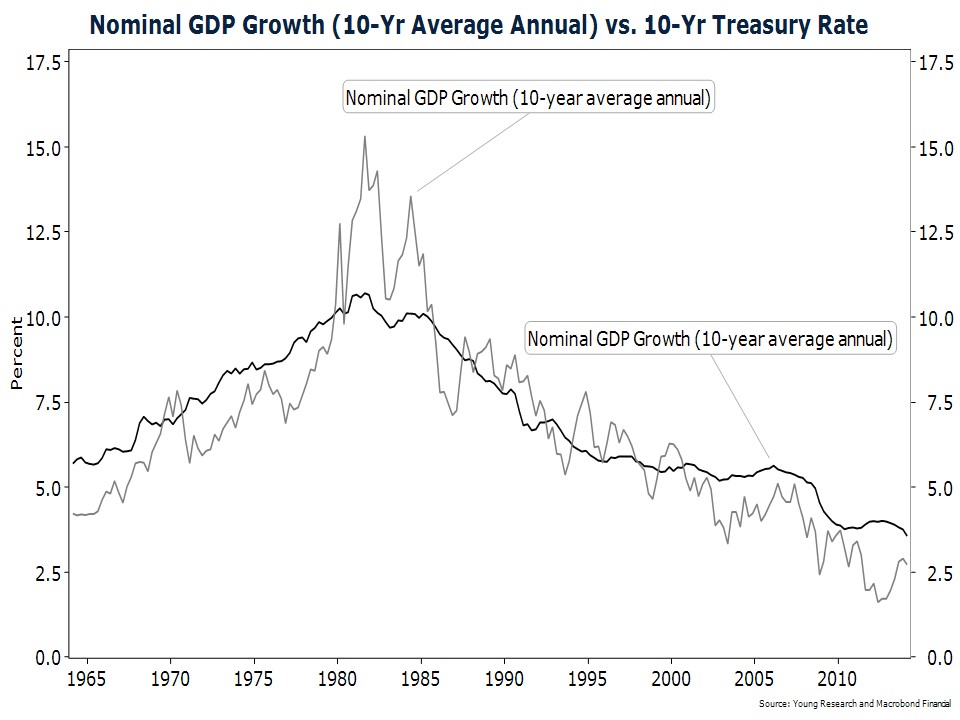
A back-of-the-envelope guide to the fair value in long-term interest rates is the growth rate in nominal GDP (GDP before adjusting for inflation). When long-term interest rates are below-trend nominal GDP growth, one should assume they will rise, and when rates are above-trend GDP growth, one should assume they will fall.
The chart below shows the close association between nominal GDP growth (10-year CAGR) and 10-year interest rates. If you assume that the Fed will prevent measured inflation from rising much above 2%–2.5% and that real GDP is capable of growing at 2%–2.5%, you get a fair value estimate for 10-year Treasury rates of 4%–5%.
Today, 10-year Treasuries yield 2.6%, or about 1.4%–2.4% below fair value. Ignoring all other factors then, one should assume that, over time, 10-year Treasury rates could drift higher by at least 1.4% to 2.4%.
How Is the Economy Performing?
It is crucial to assess the economy when crafting a fixed-income strategy, because a slowing economy often pressures interest rates lower and a booming economy pressures rates higher.
Notwithstanding the dismal first-quarter GDP number (looks mostly weather-related), several U.S. economic indicators have shown signs of strength.
Labor market indicators look strong. The four-week moving average of jobless claims hit a post-recession low in early June, payroll employment growth is averaging a healthy 200,000 per month, and average manufacturing hours worked is at a more-than-six-decade high.
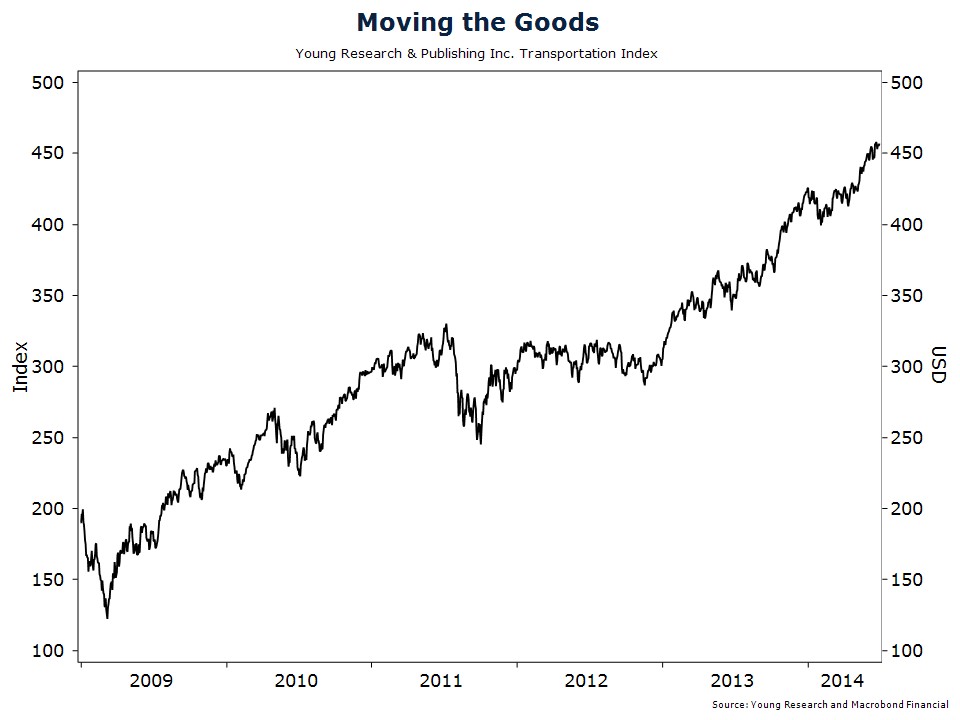
The Young Research Moving the Goods Index is in a solid uptrend. The Moving the Goods Index is a leading indicator of economic activity. Transportation companies are often the first business to experience a pickup in demand since they have to move goods before they can be purchased. If the economy were losing momentum, Young Research’s Moving the Goods Index would most likely be falling.
What Is the Fed Doing?
The Federal funds rate acts as the anchor in the bond market. Long-term interest rates can rise and fall, but they rarely get more than four percentage points above the Federal funds rate. With the Fed holding rates at zero, long-term interest rates are unlikely to get much above 4%.
Our Outlook and Strategy
In our view, long-term interest rates are well below normal levels, economic growth is moderate, and the Fed is signaling rates are likely to rise next year. We assume the risk of higher rates for both short- and long-term maturities far outweighs the risk of a substantial decline in rates.
A short maturity (duration) strategy remains our favored strategy, but we have reached the point in the credit cycle where it is time to pare back credit risk.
Our bond strategy during this prolonged period of 0% interest rates has been to take credit risk as opposed to maturity risk. Credit risk is the risk that a bond issuer will default. Maturity risk is the risk that interest rates will rise before the bond matures, thereby decreasing the value of that bond. We have invested primarily in short-term corporate bonds, with complementary positions in GNMA securities and floating rate notes.
GNMAs
GNMA securities remain one of our favored fixed-income sectors. GNMA securities are mortgage-backed securities (MBSs). They are the only MBSs that are explicitly backed by the full-faith-and-credit pledge of the United States government.
Mortgage-Backed Securities vs. Conventional Bonds
Mortgage-backed securities are not like conventional bonds. Conventional bonds pay interest during the life of the bond and all principal at maturity. Mortgages pay principal and interest every month in varying amounts. Most investors intuitively understand this. When you take out a mortgage, you make a payment each month that includes interest and principal. When you refinance your mortgage, you are making what is called a pre-payment.
Pre-Payment Risk
Because GNMA securities are backed by the U.S. government, they are free of credit risk, but they do carry other risks. The principal risks unique to mortgage-backed securities are pre-payment risk and extension risk. Pre-payment risk is the risk that your principal will be repaid before maturity. Why is that a risk?
Let’s say you invest in a GNMA security and every mortgage backing that security has a 6% rate. Fast-forward one year and assume that mortgage rates have fallen to 4%. Further assume that every mortgage backing the GNMA security is refinanced to lock in that lower 4% rate. As the investor in this GNMA security, the entire balance of your principal is returned to you. You can reinvest in another GNMA security, but the prevailing rate on GNMA securities is now only 4%. Instead of earning 6% on your money, you now earn 4%.
Extension Risk
Extension risk is the opposite of pre-payment risk. When interest rates rise, the rate of pre-payments on GNMA securities slows, which effectively extends the maturity of a GNMA security. You now have a longer maturity bond than you originally invested in just as interest rates are rising. The combination of higher rates and a longer maturity results in a lower price.
In return for taking on pre-payment risk and extension risk, investors in GNMA securities are compensated with yields that are greater than the yields on Treasuries. Today, GNMA securities yield 2.9%.
Corporate Bonds
Corporates have been our bond investment of choice since the last recession ended. During the credit crisis, yields on corporate bonds rose to extraordinary levels. The opportunities in corporate bonds in 2009 and 2010 were likely generational. But yields and spreads have compressed as the economy has recovered.
Priced for Perfection
Short-term investment-grade corporate bond spreads, or the additional compensation investors are paid for taking credit risk, are back to levels last seen during the height of the 2006 and 2007 credit market mania. If short-term interest rates were 4% and spreads were as low as they are today, there still might be a case for buying short corporates. But with low short rates and spreads at cycle lows, there is minimal upside in short-term corporates and enough risk to warrant a shift away from the sector.
Medium-Term Corporate Opportunities
The same is not true of intermediate-term corporates. While spreads on medium-term corporates are below average, they haven’t yet reached prior cycle lows. With the Fed still pinning interest rates at zero and a general shortage of decent income opportunities, we expect spreads on medium-term corporates to grind lower.
New Position in Treasuries
To keep the maturity of overall bond portfolios short and to reduce credit risk, we have begun building a position in 3-year Treasury securities. Yields on 3-year Treasuries have improved over the last 12 months and now offer a partial offset to inflation. The yield on 3-year Treasuries is about 0.95%. Not a great return, but the goal is not to maximize yield. It is to preserve principal for a time when investors are again adequately compensated for bearing risk.
Adding a lower-risk bond component, such as Treasuries, to a portfolio can help smooth out returns over time. For years, we have used the Vanguard Wellesley Income Fund as a quick and easy proxy to measure how a balanced portfolio of stocks and bonds performs in various market environments.
For over 40 years, Wellesley’s portfolio has included a bond component. The Wellesley fund invests about 40% of its assets in blue-chip stocks and 60% in bonds. How has Wellesley weathered the financial market storms of recent years?
During the three-year dot-com bust when the S&P 500 fell by half, the Wellesley fund was up—yes, up—21%. During the last bear market, the S&P 500 lost 56%, but Wellesley’s losses were limited to a more manageable 21%.
On paper, an all-stock portfolio may offer the highest long-term returns. But in practice, the gut-wrenching volatility of an all-stock portfolio leaves investors more vulnerable to making emotionally charged decisions that can sabotage portfolio returns. In our experience, the stability of a bond component helps investors stay on course and ultimately achieve greater investment returns.
Have a good month, and as always, please call us at (888) 456-5444 if your financial situation has changed or if you have questions about your investment portfolio.
Best regards,

Matthew A. Young
President and Chief Executive Officer
P.S. In 2013, the Bank of Japan initiated a money printing campaign that, relative to the size of Japan’s economy, was much larger than Ben Bernanke’s. Japan’s quantitative easing program resulted in a massive depreciation of the yen, but the impact of that program is now waning. The yen has been range-bound for the better part of the last six months.
Bank of Japan Governor Haruhiko Kuroda recently came out and tried to jawbone the yen lower. His actions seem to signal that the BOJ has drawn a line in the sand for the yen around 101 to the dollar. If the exchange rate falls meaningfully below 101, we would anticipate a response from the BOJ that would likely weaken the yen further. The yen could also depreciate if U.S. economic momentum continues to accelerate. A short yen trade appears to offer limited downside with meaningful upside. We took a small position in the ProShares UltraShort Yen Fund (NYSE: YCS).


 Client Portal
 Secure Upload
 Client Letter Sign Up