June 2019 Client Letter
The first half of 2019 is over, and the current investment environment appears more uncertain today than it was at this time last year. While it’s difficult to judge how the remainder of the year will play out, we’ve decided to hand out letter grades to some of the current storylines that may impact financial markets and your investment portfolio.
Trade Negotiations
For the past two years, trade has been a focal point for markets. A trade deal with the Chinese that looked nearly complete a month or two ago has broken down. As a result, President Trump raised tariffs to 25% on $200 billion of goods imported from China. If the 25% tariff is left in place, it may have a greater impact on the U.S. than the 10% tariff put in place last year. The difference this year is China has not offset the higher rates by depreciating its currency.
Tariffs aren’t a pro-growth economic policy, but the president has used them effectively against China. The Chinese have taken advantage of the U.S. for years via currency manipulation, intellectual property theft, and subsidizing Chinese companies. Reform has been a long time coming. President Trump maintains that he remains open to a trade deal with China, but all indications suggest the deal must have teeth to win his support.
U.S. multinational firms are likely to feel the bite of Chinese tariffs, but the broader U.S. economy should be able to weather the storm.
The more concerning trade issue was President Trump’s threat to use tariffs as a tool against Mexico to achieve non-trade-related objectives. The tariffs were never instituted, but the president’s willingness to use trade as a weapon for non-economic means likely sent a chill down the spines of many global business CEOs.
Trade policy grade: B
Iran
Events in the Persian Gulf are evolving rapidly. As of the time of my writing, Iran had shot down an American drone and President Trump had pulled back on a military response that would have taken 150 Irani lives. Then the president authorized a non-lethal cyber-attack on some of Iran’s military infrastructure. That was a wise choice by the president. A disproportionate response could have sent the entire region into war.
According to some reports, the president is engaged in a debate with National Security Advisor, John Bolton, over the idea of military engagement with Iran. Trump seems wisely inclined to avoid another quagmire in the Middle East, but Bolton presses for deeper engagement against Iran, which is something he has pursued for many years.
There could be few things more destabilizing to world economic markets than a war centered in the Persian Gulf. War with Iran would likely lead to cross-Gulf attacks aimed at crude oil tankers leaving Saudi Arabia and other Gulf states. That could shut down seaborn oil shipments, and prices for oil would probably climb rapidly, hurting economic growth not only in the United States, but around the world. John Bolton’s grade on Iran: F
The Federal Reserve
Fed policy has been a major disappointment for income investors in 2019. In 2018, the Fed lifted short-term rates back above the rate of inflation for the first time in a decade and signaled more normalization of interest rates and the balance sheet were planned for 2019. Unfortunately, Powell & Co. caved as stock market volatility picked up late last year. The financial markets are not the economy, but the Dow Jones Industrial Average has become a leading indicator of Federal Reserve policy.
At its latest meeting, the Fed all but guaranteed a rate cut this summer, with another likely in the fall. With unemployment near a record low, GDP expanding at 3%-plus, the stock market near a record high, credit spreads at normal levels, and interest rates still far from restrictive, the Fed’s desire to cut rates is rather disturbing. The only upshot to the Fed as guardian of the stock market is that the equity side of your portfolio could have another tailwind at its back. Federal Reserve grade: F
U.S. Economy
The U.S. economy still looks pretty good. GDP for the first quarter came in above 3%. It was a low-quality 3% with inventory-build inflating the headline number, but some one-time factors also dragged down the growth rate. The consumer remains healthy with solid wage growth, low unemployment, and high consumer-confidence readings.
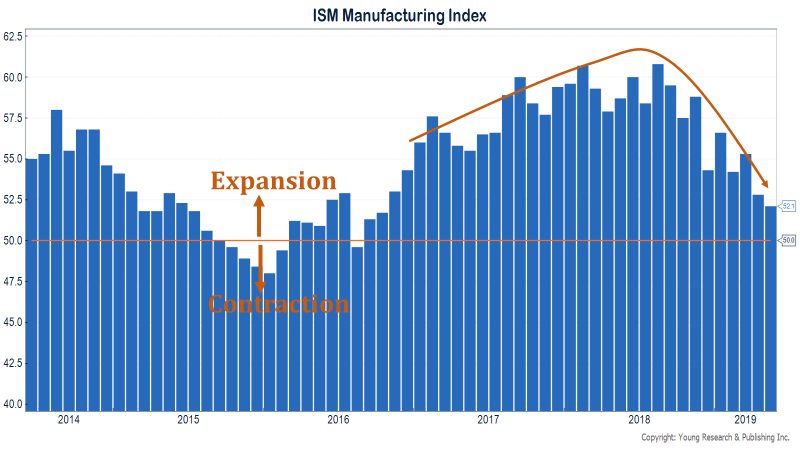
Some trouble spots in the economy bear watching, but nothing to panic over at this stage. As you can see in the following chart, the ISM Manufacturing Index has fallen to its lowest level in more than two years. Readings above 50 signal expansion in the manufacturing sector. Core capital-goods-orders growth has also fallen to its lowest level in more than two years, and CEO confidence has dropped sharply over the last year. Both measures have likely been impacted by trade policy uncertainty. But while CEOs of major companies are pessimistic, small businesses remain optimistic. U.S. economy grade: B

Yields and the Bond Market
The yield environment has gotten much more challenging over the last six to nine months as the Fed pivoted from signaling more rate hikes to rate cuts. In early November of last year, 10-year treasury notes offered a yield of 3.20% and 2-year treasury notes offered a yield of 2.80%. Today, 10-year treasury notes yield 1.98% and 2-year treasury notes yield 1.71%. Yields on corporate bonds have also fallen sharply since last year. For investors who own bonds, the drop in yield has provided a nice bump in price and solid total returns YTD. The problem with falling yields is all of the income on bonds and principal on maturing bonds must be reinvested at today’s lower interest rates. Bond market grade: C
Small victories are the name of the game in fixed-income portfolio management today. One area of fixed-income markets where we see opportunity that probably won’t last is in certificates of deposits (CDs). Yup, we recently purchased FDIC insured bank CDs with yields 0.50% to 0.70% higher than those on comparable-maturity treasury notes. The FDIC is backed by the full-faith-and-credit pledge of the U.S. government. We were essentially able to purchase fixed-income securities in your account with the same credit risk as the risk in Treasury securities, but with a yield that was 0.50% to 0.70% higher. CDs are less liquid than Treasuries, but our intention is to hold to maturity. I won’t grade our CD purchase, but I hope you will agree with me in viewing this as a solid buy.
Gold Market
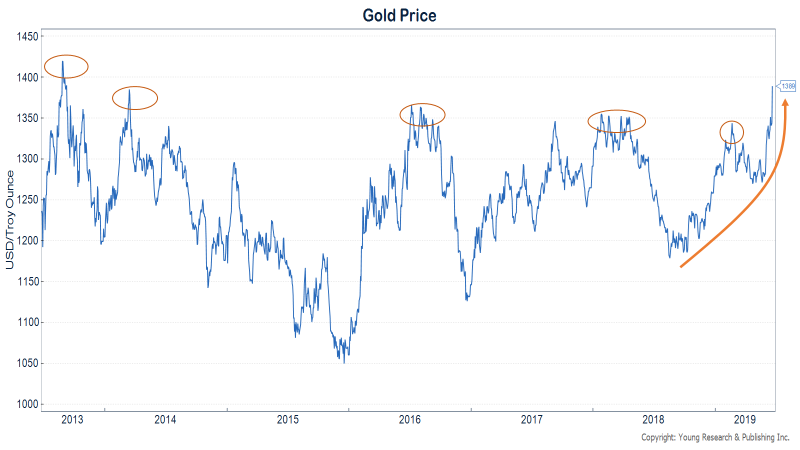
You buy gold with the hope it declines in value. I first heard this from my dad many decades ago. Gold should be looked at as an insurance policy for your portfolio. We buy gold and hope its price goes down because often when gold is falling everything else in your portfolio is rising. How is gold doing today? Last December when the stock market cratered more than 9%, gold prices rose 4.90%—I would say gold is holding up its end of the bargain. Gold is also up in 2019, along with stocks and bonds. Our chart shows gold is on the verge of breaking out of a six-year trading range. YTD the SPDR® Goldshares fund is up almost 10%. Can’t ask for much more than that. Gold grade: A

Stock Market
After falling for the first full calendar year since 2008, the stock market has boomed YTD. The Federal Reserve’s flip-flop on monetary policy has been a big driver of stock prices and may continue to encourage risk-taking. Through the first half of the year, you are sitting on double-digit gains in your stocks. And this is from a stock portfolio about 20% less risky (as measured by standard deviation or beta) than the S&P 500. I don’t often talk about the lower volatility of the dividend stock portfolios we manage for you, but I want to share some arithmetic that highlights the benefits of an approach focused on downside protection.
The Asymmetry of Gains and Losses
Let’s compare two hypothetical portfolios. Portfolio A is an investment in the SPDR S&P 500 ETF. Portfolio B can be thought of as a low-risk stock portfolio—think high dividends, low relative volatility, and a beta or sensitivity to changes in the broader market of about 0.70. What that 0.70 beta means is that for every one-percentage-point increase in the S&P 500, the portfolio with a beta of 0.70 will increase by 0.70% (assuming 0% alpha and 0% short-rates). The same is true on the downside.
OK, stay with me. Let’s see how the portfolio performs through a full cycle. Say the S&P 500 returns 200% over a period of nine years. At the end of year nine, a $10,000 investment in Portfolio A (the S&P index fund) would be worth $30,000, and a $10,000 investment in Portfolio B would be worth $24,000. (0.70 beta times 200% equals 140% return.)
Now let’s consider year 10, which we will assume is a big down-year for the market—a real big down-year with the S&P 500 plunging 50%. What is likely to happen to Portfolio A and Portfolio B?
The $30,000 value of Portfolio A will be cut in half, to $15,000. At the end of year 10, Portfolio A will be up 50% or 4.1% on a compounded annual return basis. Portfolio B is likely to lose 35% of its value in the year-10 bear market (0.70*-50% =-35%). At the end of year 10, Portfolio B will be worth $15,600, for a total return of 56% or a 4.5% compounded annual return. Yes, as surprising as it may be, Portfolio B ends up ahead of Portfolio A through the full market cycle, and it does so with less volatility and a smaller peak-to-trough decline. On the way up, things didn’t look so spectacular for the investor in Portfolio B; but on the way down, the lower-risk approach helped preserve capital.
While I can’t make any assurances that our common-stock portfolios will mimic the returns of Portfolio B in a downturn, I can say the beta of the portfolios we manage is much closer to the beta of Portfolio B than of Portfolio A. Stock market grade: A
Why Our Approach Tends to Be Lower Risk
The portfolios we manage for clients tend to have lower risk because we invest in securities that pay dividends, and we focus on those that make regular annual dividend increases. We are also value conscious and favor businesses with durable competitive advantages. All of those attributes help limit losses during times of distress. Two dividend-payers included in many of our clients’ portfolios today are CVS and American Tower.
CVS
CVS is the largest pharmacy healthcare provider in the U.S.—with over 9,600 pharmacies and 1,100 walk-in medical clinics—and a leading pharmacy benefits manager, delivering services to 93 million plan members. Seventy-six percent of the U.S. population lives within five miles of a CVS pharmacy. CVS has a dedicated senior pharmacy care business serving more than one million patients each year. The number of Americans aged 65 and over is expected to increase by 18% over the next five years and 38% through 2025. This older demographic uses twice the prescriptions of the under-65 population. Increased utilization, combined with growth in specialty medications, is expected to fuel a 6% rise in prescription spending annually over the next decade. CVS is down year-to-date, but patient investors can enjoy the shares’ yield of over 3.75% while they wait for prices to rebound.
American Tower
American Tower’s business is basically just what it sounds like: towers, specifically those that hold communications equipment. American Tower leases its tower space to wireless communications companies. The business’s global portfolio comprises over 170,000 sites in the U.S., Mexico, most countries in South America, India, France, Germany, and some of Africa’s fast-growing cellular markets. American Tower went public in 1998 after being spun out of CBS/Viacom, when the media conglomerate took over American Radio, which had built American Tower as a subsidiary. In 2012 American Tower became a REIT and began paying regular dividends to shareholders. In every year afterward, American Tower’s board has increased dividend payments per share.
Have a good month. As always, please call us at (888) 456-5444 if your financial situation has changed or if you have questions about your investment portfolio.
Warm regards,

Matthew A. Young
President and Chief Executive Officer

 Client Portal
 Secure Upload
 Client Letter Sign Up